HAL Id: halshs-00264404
https://halshs.archives-ouvertes.fr/halshs-00264404
Submitted on 26 May 2008
HAL is a multi-disciplinary open access archive for the deposit and dissemination of sci-entific research documents, whether they are pub-lished or not. The documents may come from teaching and research institutions in France or abroad, or from public or private research centers.
L’archive ouverte pluridisciplinaire HAL, est destinée au dépôt et à la diffusion de documents scientifiques de niveau recherche, publiés ou non, émanant des établissements d’enseignement et de recherche français ou étrangers, des laboratoires publics ou privés.
A web information system for the management and the
dissemination of Cultural Heritage data.
Elise Meyer, Pierre Grussenmeyer, Jean-Pierre Perrin, Anne Durand, Pierre
Drap
To cite this version:
Elise Meyer, Pierre Grussenmeyer, Jean-Pierre Perrin, Anne Durand, Pierre Drap. A web information system for the management and the dissemination of Cultural Heritage data.. Journal of Cultural Heritage, Elsevier, 2007, 8 (4), pp.396-411. �10.1016/j.culher.2007.07.003�. �halshs-00264404�
A web information system for the management and the
dissemination of Cultural Heritage data
Élise Meyer
a,*, Pierre Grussenmeyer
b, Jean-Pierre Perrin
a,
Anne Durand
c, Pierre Drap
ca Research Centre in Architecture and Engineering CRAI UMR 694 MAP CNRS-MCC, Nancy School of Architecture, 2 rue
Bastien Lepage, 54000 NANCY, France
b Photogrammetry and Geomatics Group PAGE UMR 694 MAP CNRS-MCC, INSA Strasbourg Graduate School of Science and
Technology, 24 Boulevard de la Victoire, 67084 STRASBOURG, France
c Information Sciences and Systems Laboratory LSIS UMR 6168 CNRS, ESIL Luminy Graduate School,
Case 925, 13288 MARSEILLE, France
E-Mail: [email protected], [email protected], [email protected], [email protected],
[email protected] * Corresponding author. Tel/Fax: +33 3 88 14 47 33.
Abstract
Safeguarding and exploiting Cultural Heritage induce the production of numerous and heterogeneous data. The management of these data is an essential task for the use and the diffusion of the information gathered on the field. Previously, the data handling was a hand made task done thanks to efficient and experienced methods. Until the growth of computer science, other methods have been carried out for the digital preservation and treatment of Cultural Heritage information. The development of computerized data management systems to store and make use of archaeological datasets is then a significant task nowadays. Especially for sites that have been excavated and worked without computerized means, it is now necessary to put all the data produced on computer. It allows to preserve the information digitally (in addition with the paper documents) and offers new exploitation possibilities, like the immediate connection of different kinds of data for analyses, or the digital documentation of the site for its improvement. Geographical Information Systems have proved their potentialities in this scope, but they are not always adapted to the management of features at the scale of a particular archaeological site. Therefore this paper aims to present the development of a Virtual Research Environment dedicated to the exploitation of intra-site Cultural Heritage data. The Information System produced is based on open source software modules dedicated to the Internet, to avoid users to be software driven and to permit them to register and consult data from different computers. The system gives the opportunity to do exploratory analyses of the data, especially at spatial and temporal levels. The system is compliant to every kind of Cultural Heritage site and allows managing diverse types of data. Some experimentation has been done on sites managed by the Service of the National Sites and Monuments of Luxembourg.
Keywords:Database / Information System / Data management / Internet / Cultural Heritage / Archaeology
1. Research aims
The research aim of this paper is to present the development of a Virtual Research Environment VRE1 dedicated to the exploitation of Cultural Heritage information. This work comes within the context of research conducted as part of a PhD thesis entitled 3D acquisition, documentation and restitution in archaeology:
proposal of a model of Information System dedicated to Cultural Heritage. We propose a Web Information System,
which has the following objectives:
- complete digital archiving of archaeological datasets,
- innovative data inquiry notably through clickable maps and 3D models,
- attractive visualization and communication of the site information thanks to thematic and interactive interfaces.
The tool notably combines survey, modelling and imagery data, and our purpose is to highlight how such a system can offer new possibilities for the management and the dissemination of these data, especially those coming from archaeological sites.
1 Term introduced by the Joint Information Systems Committee (JISC), which manages research and development
programmes in the use of ICT in teaching, learning and research to build knowledge. Particularly, it supports a project called virtual research environments programme. A VRE is an online environment dedicated to support collaboration whether in the management of a research activity; the discovery, analysis and curation of data or information; or in the communication and dissemination of research outputs.
2. Introduction
Cultural heritage documentation induces the use of computerized techniques to handle and preserve the information produced. In the archaeological domain particularly, data computerization gives solutions to specific problems in allowing inventory actions to save, represent or understand the features. Archaeology is an erudition discipline where the knowledge grows up in necessarily referencing the precious documents already gathered. The quantity of data produced during the working of a site can thus be quickly huge. Moreover, archaeological datasets are made of primary information, concerning the archaeological realities themselves (objects or configurations), and of secondary information including documents that permit to know these realities, publications with artefacts descriptions and comments, or images collections. It is then required to develop systems allowing to create relationships between these numerous and heterogeneous data, for instance to retrieve immediately for a primary data like a ceramic, the diverse secondary data making easier its study.
A drawback of Information Systems currently carried out, according to J.D. Richards [1], is the fact that a large proportion of the literature until now has been concerned with the establishment of databases for archaeological sites and monuments at regional and national levels. They are few projects concerning data management at a site level, the data recorded being obligatory more dissimilar at this scale than at a bigger. Furthermore, the visualization systems used at this time (3D models for instance) are often virtual images of the site, which only aspire to illustrate it and do not make possible the access to any additional information about it.
2.1. Proposition
Our idea is then to propose a Virtual Research Environment for archaeology, which aims notably to avoid the difficulties quoted before. We have developed a tool for the management of documents produced during the working of an archaeological site. We have chosen to work at the scale of a site, notably because there are more completed projects at bigger levels. These are mostly Geographical Information Systems (GIS) dedicated to the management of spatial data, especially at large scales. In our case, the VRE that we have developed is an Information System permitting to manage very different types of data (not only geographical), what is more uncommon and is based on dissimilar treatments than those from GIS. Therefore, the main difference with ordinary GIS is the fact that our VRE allows to do a complete documentation of a site or a monument, this documentation including spatial and non-spatial data. We dedicate our system both to the professionals who are in charge of the site, and to the general public who wishes to have information on it. Hence, we have used open source software modules and languages to develop our Web Information System, in order to be independent of any software and data format, and to allow maximum accessibility and adaptability to the needs of the diverse actors using the tool.
We propose to record the data in the XML (eXtensible Markup Language) format and to insert them automatically into a MySQL database. XML has been chosen because it is a standard of the W3C (WWW Consortium) for data description, and because it induces the registration of metadata about the data to preserve (to have secondary information about the primaries). The system is very flexible as it allows the user to choose the metadata he wants to attach (according to an archaeological standard for instance CIDOC-CRM2 [2]). Afterwards, this information is made accessible through diverse interfaces, particularly interactive 2D and 3D representations that permit spatiotemporal queries. These clickable representations are 2D images or vectors created in SVG (Scalable Vector Graphics), and 3D models produced in VRML (Virtual Reality Modelling Language) or X3D (eXtensible 3D), for a full compliance with the W3C recommendations. In addition, the user of the system can generate his own 3D models and composition plans, in order to be able (for instance) to see in a new way the historical changes of the site, by stacking different parts of 3D models or by creating synthesis plans or photos-montages.
The tool proposed in this paper is compliant to every kind of Cultural Heritage site and allows to manage very diverse types of data. Some experimentation has been done on sites managed by the Service of the National Sites and Monuments of Luxembourg, like the medieval castle of Vianden or the gallo-roman villa of Echternach.
2.2. Structuring
The first part of this paper deals with a state-of-the-art study done to highlight the benefits of the VRE that we propose. We underline the increasing role and the needs of computer science in the context of Cultural Heritage data management, our reflection being divided in four main parts: Databases, Geographical
2 The CIDOC (International Committee for Documentation of the International Council of Museums) Conceptual
Reference Model (CRM) provides definitions and a formal structure for describing the implicit and explicit concepts and relationships used in cultural heritage documentation.
Information Systems, Visualization and Communication. These parts represent the main domains of application of computer science in Cultural Heritage, particularly in archaeology. We also quote some theoretical aspects of documentary representation, to make clear how we have conceived the user interfaces of the Web Information System.
The second part concerns the development of the VRE for archaeology. Firstly, we explain the architecture of the system and the conceptual data model. Then, we show the way the recorded data are retrievable and updatable, notably through the interactive maps and 3D models. Finally, we give some details about the generation of original models and graphs from the initial data.
3. Cultural Heritage data management and computer science
A good overview on this subject has been given by Julian D. Richards in 1998. His paper reflects especially that «although archaeologists have been quick to apply the latest technology, in most cases the technological driving force has been outside the discipline» [1]. What means that the use of computer science in the archaeological domain is often driven by software offers rather than by archaeological questions. In the VRE that we propose, we try to find solutions to this difficulty. Archaeologists are faced with this problem in the various tasks where they need to use computerized tools: when they have to record their data in databases, when they want to link and make use of them, when they require systems to visualize and publish them. The following sections describe how these tools have been used by archaeologists for years, in order to understand the real needs and to shape the main lines of a system that would allow to answer it.
3.1. Databases
At the beginning (1960), databases were founded on statistical approaches (with the question of the classical statistics relevance), significance testing and multivariate analysis. Then, discussions about database design have dominated the debate, particularly in France [3,4]. The principal question at this time was the generalization and the standardization of the databases, in order to avoid that they constitute a constraint rather than a help for the research. This problem still exists, because archaeologists have often to choose between the different databases they have at their disposal, and when they have adopted a type of recording it is complicated to change afterwards. Likewise, there are practical and theoretical difficulties concerning the nature of the data (very heterogeneous), the form of their analysis and the limitations of the software that run them. In any case, the bridges that could be necessary between different database systems must have been prepared from the beginning of the work.
Coming to the content of the database, it was proposed by Ginouvès and Guimier-Sorbets [5] to record the totality of the characteristics generally used by the archaeologist in his interpretative reasoning, with in addition the characteristics which does not serve directly but allow to have a more precise view of the document, or for which we can think that they could be valuable one day. Therefore, the description of the feature that is recorded in the database is at least as rich as the report from traditional publications. From a practical point of view, it is even more rich because, for uniformity reasons, it is required to record the totality of the provided information whereas traditional publication makes various and non-explicit choices. These recommendations are still current and the recording of metadata (data about data) is something common nowadays, notably with the XML format, which is dedicated to the formalization of such information and which allows polymorphism. Moreover, to help the information providers for using metadata standards, it exist services like EPOCH3 (European Research Network of Excellence in Open Cultural Heritage) that fosters the application of the CIDOC-CRM (ISO 21127) at all its partners, facilitating this through training dissemination and access to documentation [6].
During the 1990s, archaeological interest has focused «on how the structure of excavation data can be successfully modelled in a relational database, on the possibilities of object-oriented design, and on the creation of databases founded upon archaeological entities» [1]. These steps were necessary to grasp the way to define the relationships between the archaeological features recorded in the tables of the database, and to consider objects for what they do and not just for what they are. But GIS have rapidly taken an important place for data management (see Section 3.2) and «although inventories of archaeological sites and monuments have traditionally been implemented in simple flat-file databases, the advent of GIS has forced archaeologists to accept that this is an inadequate representation of archaeological landscapes and that a site is an artificial concept in a landscape containing field systems, sacred zones, and boundaries in which a site is simply a focus of human activity» [1]. Then, the classic excavation databases have been adapted to be able to link computer-aided design objects or contextual data. The idea is that an excavation archive can be viewed as a hyper document with texts and images bounded by internal links, and allowing readers to follow different paths to retrieve information through the report [7]. And «if such documents can be made publicly accessible, on the
Internet, for example, then they begin to blur the distinction between archive and publication» [1]. Our work has been carried out this way. An interesting example of integrated computerized field project linking basic finds, plans and context data recording in the field and operated using GIS mapping tools is related by Powlesland in 1991 [8]. An output form for the electronic publication of the project is besides available.
In projects done currently, as already said in introduction, the majority of databases of archaeological sites and monuments are established at regional and national levels. It is then necessary to do projects at smaller scale for the management of the heterogeneous data of a particular site. Our project is thus devoted to the management of data generated by the working of one site (and not of a group of sites).
Below, we describe the use of GIS in the archaeological domain (large scale) and we explain the distinction between the terms GIS and Information System, the last being used in this paper to describe the work we have done.
3.2. Geographical Information Systems
Geographical Information Systems have been developed to create relationships between data and to analyze spatial information recorded in databases. The principal applications of GIS are either heritage management (monitoring of known sites or identification of new ones) or explanatory framework (site catchments or analysis of the intervisibility of the sites). The greatest number of GIS projects to date is landscape applications. Many are driven by the needs of cultural resource management [9] or predictive modelling. A great quantity of examples are quoted in Richards' paper and his conclusion is the following: «There has been a lack of projects that have made effective use of GIS at the intra-site level; the projects on an Iberian cemetery [10], Roman Iron Age sites in the Assendelvers Polders [11], and the Romano-British settlement at Shepton Mallet [12] are rare exceptions.» [1]. Until the time of this paper, some others have obviously been carried out, but they are always less numerous that projects at higher levels, and what's more the types of data treatments at a small scale can be very different from those that can be done at a bigger scale.
For that reason, the system that we have developed concentrates on this lack. To free us from the requirement to have geolocalized data (bound to the concept of GIS), we use the term Information System (IS) to describe our work. Indeed, the types of data that are possible to manage are not only geographical or geolocalized data (maps, vectors), but also archaeological, historical, topographical, architectural, geological, environmental and textual data. The management of a database by an Information System provides an enrichment of information, in permitting the immediate confrontation of all these data types. An Information System could be defined as a combination of diverse types of data (recorded in databases) accessible through various interactive consultation systems. The quality of this system can be estimated by its capacity to present information in a useful way, as fast as possible. It is thus constructed keeping in mind the need to acquire quickly the best information elements that will give answers to experts' questions, and to make these elements available for interpreting studies. Such a tool must permit to carry out a real multidisciplinary synthesis of all resources of the database.
For Cultural Heritage data particularly, the creation of an Information System can lead to achieve:
- to process graphically several information derived from very different kinds of surveys, because a selective superimposing could be a precious help for the interpretation;
- to combine elements selected in diverse graphs or models for the generation of visualizations in synthesis maps or 3D models;
- to present images and their connections with the concerned texts from the database, to lead to a complex system in which the analyse of texts and images would be possible simultaneously.
Especially in our project, the term management comprises the gathering of all the documents (photographs, maps, drawings, texts…) already created or that will be done during the further exploitation of the site (models, virtual images…), and the construction of relationships and links between them.
The treatments of the information are necessarily combined with visualization systems that will permit to see the results of these data extractions.
3.3. Visualization
Visualization of archaeological information is one of the most attractive ways in which computer technology can be employed in archaeology. This word is taken for any exploration and reproduction of data by graphical means. The use of this technique allows visual interpretation of data through representation, modelling, display of solids, surfaces, properties or animation, what is rarely possible in traditional paper publication. Visualisation techniques are constantly evolving. In the early 1990s, visualization meant 3D modelling: most of these 3D models were developed for museum presentations. P. Reilly in 1992 provided an excellent historical overview of 3D modelling in archaeology [13]: it is a little dated but basic utilizations are still the same. At the beginning there were mainly solid-model reconstructions, which allow the archaeologists to visualize the aboveground appearance of sites that, until this moment, they only knew from their foundations. Virtual reconstruction is still a very frequent intend for the construction of 3D models in
our time. More recently, surface models have also been applied in archaeology. In contrast to solid models these techniques incorporate no information regarding the solid geometry of a building and simply present it as a series of two-dimensional flat surfaces that can be rendered or viewed in a variety of ways. A surface model would not allow the modeller to cut a cross section through a building or to calculate its internal volume [14].
Until now, the most 3D models are intended for heritage centres and museums displays. Rarely are some of them available on-line on the Internet. An impressive and popular publication of visualizations of international important sites has been edited by Forte and Siliotti in 1997 [15]. Also virtual reality with fully immersion has a great potential as a medium for interpretation and communication to the general public. An example of web-based visualization in VRML that allow exploring an archaeological landscape (large scale) has been given by Gillings and Goodrick in 1996 [16]. To finish with this type of computer science application in archaeology, we can quote the applications of image processing and imaging technology in many areas of the domain, such as classification, conservation, palaeography, aerial photography and satellite imaging.
Principal drawbacks of the types of 3D models used in archaeology nowadays are that factors (for museum displays notably) work towards the omission of archaeological complexity, and that these models are blank. Indeed, they only serve for visualization needs and they do not give any other information. For the first problem, the current techniques of surveying like photogrammetry and laser scanning permit to avoid the complexity lose while the creation of the models, because it is possible to do very accurate 3D models thanks to these methods. Concerning the second difficulty, 3D models can now serve as research interfaces to access different kinds of information, notably in coupling them with web procedures (scripts). Our system has been carrying out this way: we have produced interactive maps and 3D models that work like web interfaces to obtain views of the database records. It is based on research work of P. Drap [17,18], who has notably developed such a system integrating photogrammetric data and archaeological knowledge.
3.4. Communication
Speaking about communication in our domain of interest is often heard as publication. More precisely, significant developments regarding communication currently have appeared with new forms of electronic publications. On this subject, Richards said: «Probably one of the safest predictions for the next millennium is that new forms of computer based publication will continue to revolutionize the dissemination of information; for some aspects of archaeological publication the book is now dead.» [1]. Electronic publication allows to blur the distinction between traditional archive and hard copy report, with supporting data made accessible for the first time [7]. We retrieve here the need to access metadata. From another source, there are advantages through multimedia and accessibility of new forms of data, particularly drawings, plans, video, and photographs [19,20]. In the late 1990s, some believe that CD-ROM publication represents a way forward, perhaps because it offers a model quite similar to traditional publication. Some others note that doubts have been expressed about the speed of adoption because of resistance from traditional publishers [21].
We can now say that these doubts were well-founded because there is not yet a great quantity of electronic publications in archaeology, especially available on the Internet. However, one of the best examples of on-line publication (peer-reviewed journal of record) is Internet Archaeology, an international electronic journal project set up with funding from the United Kingdom's Higher Education and Further Funding Council (HEFCE) as part of their eLib (Electronic Libraries) program [22,23,24]. This publication does not contain any other material than textual documents. In addition, there are a number of projects whose aims are (or were) to preserve a continually updated archive of computer-readable material. In the United States, the Archaeological Data Archive Project [25] sought care for data sets of value to archaeological research (this project is now aborted). In the United Kingdom, the Arts and Humanities Data Service has established an Archaeology Data Service to take responsibility for the long-term preservation and distribution of data to the archaeological community [26].
According to Richards, «undoubtedly the major growth area of the second half of the 1990s has been that of archaeology on the Internet, particularly on the World Wide Web» [1]. This is even truer today: the web provides a tremendous opportunity to link distributed resources and to make unpublished material widely available (remarkably uncommon material like detailed fieldwork data, quantities of photos and archive drawings, vectorial graphs or 3D models). The traditional division between publication and archive could thus be removed, even if there is still a big challenge to control the way in which the Internet is used (for the discoveries, quality controls or copyrights).
From our side, the way we perceive the term communication is more complete than only the publication process. Aims of our VRE are to assist the digital archiving of the documents, their inquiry and their processing by everyone, both the professionals (archaeologists, surveyors or architects) and the general public. Different types of access to the data are available depending on the user of the system. Representations adapted to museum displays (public attractive) have been done as well as interfaces permitting to update the
data directly from the 3D models, for the needs of the site managers. This system is dedicated to the Internet, to allow accessibility and simplicity for all the users, and above all to be independent from any software. As a conclusion, Richards said that «in all areas of computer applications in archaeology, the discipline has been technology driven and software constrained. Rarely has the use of computers in archaeology been led by archaeological theory, although in specific fields, such as GIS, it can be demonstrated that computers have advanced archaeological knowledge.» [1]. Thus we hope the Information System we have developed will also serve archaeological knowledge in proposing an other type of communication and sharing of data coming from the working of an archaeological site.
Having from now on a small overview of computer use and needs in archaeology, particularly for Cultural Heritage management, and having explained relatively the choices made for the implementation of our project, we will prompt quote some theoretical points to simplify the understanding of the way data has been recorded in the database and represented by the diverse interfaces of the VRE.
3.5. Documentary representation
The handling of documents thanks to an Information System sets the problem of the access to the information. It has to be fast, synthetic and multilingual, to be adapted to the today's practices and habits. What ever the objectives of the data management may be, it implies synthetic representations of the information and possibilities to "navigate" through the documents. The principal interrogations are about indexation and structuring of the documents, and about presentation and representation for exploration purposes.
Concerning indexation, our interest focuses on computerized indexation (on the contrary of documentary indexation where the indexes are manually attributed). It proposes a suite of character sets, extracted from their environment in order to be stored and statistically analyzed elsewhere. The questions are:
- How to transform non-coded data into a set analyzable by statistical tools? - How to recover documents whose description has not been validated by experts?
A solution taken up is to do a search on a full-text indexation, where the character sets are considered as indexes themselves. Tools are more and more sophisticated, integrating Boolean logic or regular expressions, and also effective. But for the non-specialists who want to retrieve information, these tools are not really a great help: the access to information depend entirely on the degree of mastery of the researcher, on his pre-existing knowledge about the document he searches, and on his assessment of the research tool capacities. To avoid these difficulties, in the search engine of our Information System, we propose to the visitor the keywords that have been full-text indexed in the database. Thus, while doing a search, the user is informed of the choices at his disposal, depending on the document characteristics on which he wants to do the search. We have created a "directed keywords research tool" to retrieve in the database all types of documents (texts, drawings, graphics, models…) indexed on keywords belonging to the metadata recorded about them. Combinations of keywords for several characteristics are also possible in order to obtain finally the corpus of interesting documents by gradual refinements of the queries.
For the representation of the documentary base, the ergonomics of the visualization tools is essential. Circulation and navigation in information are made possible by succession or combination of diverse representation processes. The numerous documents processed have been made reachable through graphical interfaces proposing representations (maps, graphs, diagrams…) reflecting the documents organization. Some of these schemas have been done in UML (Unified Modelling Language), notably Use Case Diagrams that reflect the instructions for use of the VRE. Indeed, it is only the synthetic representation of the information that allows the understanding. It is required to think about the impact of information modelling choices, because these choices are led by the need to handle the data and to take out the essence of the information (information being the addition of data and semantic elements). It is thus necessary to do a reading of it according to our objectives (saving, modelling, interpreting or dating) [27].
Diverse representation strategies can be used to conceive an efficient system:
- accesses to the information by a view from above, a cartography that serves as a support of navigation in the corpus, at different levels;
- graphs permitting to show documents immediately related to another one: the document of interest (drawing, model or text) then appears in the centre of the graph surrounded with the other ones that have different kinds of relations with it;
- documents grouped in files in which we flow by hyperlinks (Internet navigation);
- trees in which it is possible to go down in depth, to zoom in internal structures of a class of document. In any case, it is valuable for data research tools to be, as much as possible, tools that help reading and understanding the information. The question is really about the capacity to present it in a useful way, in order to be fast workable. Indeed, considering the project of a person at a given moment and in a given environment, what does matter to him is to obtain a clear description of the tools he has at disposal to visualize the documentary base in different ways.
During the construction of our Web Information System, we have taken care of these theoretical points and remarks that are significant for the broadcasting of the system we have developed.
The next part explains the development of the VRE for archaeology, which has been carried out taking into account the results of the former state-of-the-art study.
4. A Virtual Research Environment for Cultural Heritage data
According to the objectives highlighted before, we will now present the approach used to develop the project, to be able to reach these aims in the best possible way.
To begin with, it is relevant to point out the fact that the computational base of the Information System carried out comes from projects done to integrate photogrammetric data and archaeological knowledge on the web (ISA-PX "Information System for Archaeology using Photogrammetry and XML") [17,18]. Indeed, some functions and computer formats (XML, VRML) used in the ISA-PX system wasalready corresponding to our needs. Then we have based the development of our VRE on this system, before adding other functionalities specifically designed to answer our requirements, notably to allow the management of different documentary data (not only data coming from photogrammetric surveys).
4.1. Architecture of the system and conceptual data model
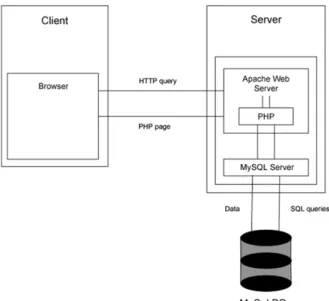
The resulting Information System is based on a web server infrastructure allowing to interpret PHP (Hypertext Preprocessor) programs. We use a set of free software programs commonly employed together to run dynamic websites or servers, called LAMP for:
- Linux, the operating system (Microsoft Windows (WAMP) or Macintosh (MAMP));
- Apache, the Web server;
- MySQL, the DBMS (DataBase Management System or database server);
- PHP (Sometimes Perl or Python), the programming language.
The combination of these technologies is primarily used to define a web server infrastructure, to characterize a programming paradigm of developing software, and to establish a software distribution package. It is a middleware, i.e. a software that connects two otherwise separate applications. In our case, the middleware product WAMP links a database system to a Web server. It allows users to request data from the database using forms displayed on a Web browser, and it enables the Web server to return dynamic Web pages based on the user's requests and profile4.
For our simple use, it is just necessary to know that data are recorded in a MySQL database and accessed thanks to scripts written in the PHP language. Fig. 1 shows the dynamic client-server architecture of the system.
Fig. 1. Schema of the dynamic client-server architecture of the system.
Data in our system are then recorded in tables of a relational MySQL database but also as XML files. These two record possibilities were already available in the ISA-PX system, to obtain standardized data written in XML (for simple information exchanges) and a classic form of data searchable through SQL queries in the DBMS MySQL. More precisely, we record the data and the metadata about them (for instance the provenance, author, subject or references of a photo). Fig. 2 sums up the process to fill the XML and MySQL databases (both are filled simultaneously).
Fig. 2. Filling of the databases thanks to a data entry form.
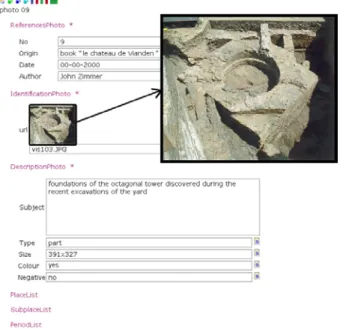
After having integrated a first time the corpus of each data type in the form of an XML file generated by the system (a data entry form allows to create the metadata structure), all the metadata is recorded through other data entry forms as shown in Fig. 2. The data itself is attached thanks to an URL link. Fig. 3 gives an example of the HTML (HyperText Markup Language) representation of an XML photo file (data and metadata) thanks to an external XSL5 document [28]. When the user clicks on the miniature of the photo, he has access to the original photo.
Fig. 3. HTML representation of the XML data and metadata of a photo thanks to an external XSL document.
Our Web Information System permits to run various types of data, like it is required for the management of an archaeological site. For instance, we can quote those found the most frequently among the archaeological data of the sites of the Service of the National Sites and Monuments of Luxembourg.
We have classified these data in four categories: - temporal data (description of historical periods),
- spatial data (description of places of the archaeological site), - archaeological objects,
- documents.
To give some precisions, the documents are principally:
5The eXtensible Stylesheet Language (XSL) is a family of transformation languages which allows one to describe how
- different sorts of graphs that have been digitized (maps, cross sections, plans, elevations, excavation profiles and plans),
- digital photos or ancient photos digitized, - scanned drawings,
- scanned texts, - vectorial plans, - 3D models - virtual images.
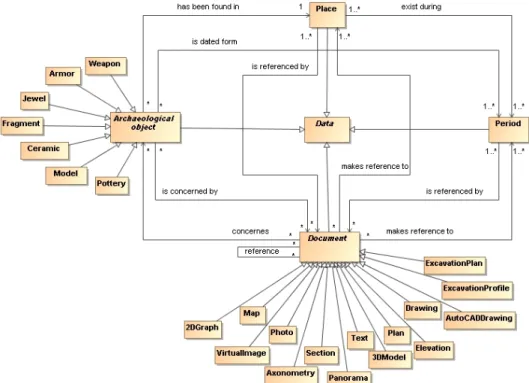
The class diagram (Fig. 4) shows how these data are linked in the relational database. It is just an example; a lot of other data can be managed. This schema highlights the main query forms available in the system: queries are possible on the historical periods, and on the most important geographical places of the site, what corresponds to a worry of the archaeologists who need to position the features in space and time. To be able to formulate these queries on periods and places, each data has for attribute a list of periods and a list of places that it refers to, in addition to the other metadata (description, identification, references or location). The system also permits to formulate queries on a combination of period and place, to find documents referencing a given place at a given period. We will see later (Section 4.2.2.) that it is interesting for instance to access documents through the historical 3D models of the site: it is then possible, by clicking on a place of the model, to obtain only the documents corresponding to the period of this model (and not all the documents referencing the place chosen).
Fig. 4. UML class diagram representing the data that can be managed by the system and the connections between them.
When data and metadata about the archaeological site have been recorded, the VRE offers different types of access to this information.
4.2. Consultation of data in the VRE
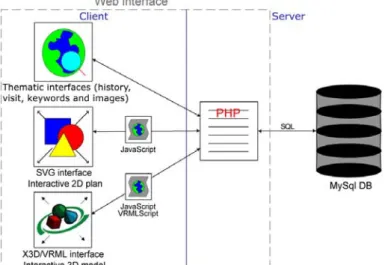
The creation of an Information System aims at combining the various accessible resources: databases, know-how, processing capacities. It is a tool that contains both the data and the methods permitting to treat them, principally an IS includes thematic and interactive treatments. Fig. 5 illustrates the computer behaviour of our Web Information System: it shows clearly the thematic and interactive interfaces that are available. The possibilities of thematic treatments are based on:
- the study of the history of the site (from the temporal data), - the virtual visit of the site (from the spatial data),
- search engines by keywords and by images.
In addition, interactive treatments are achievable thanks to the creation of: - clickable maps,
- clickable 3D models.
These diverse interfaces of the VRE permit a user friendly and insightful access to the archaeological data recorded in the database described above.
To help the users of the VRE for the documents retrieval, the functioning of the system regarding the users is explained by means of UML Use Case Diagrams (as already said in Section 3.5.). Fig. 6 gives examples of these schemas done to lead the users for the documents inquiry: some treatments quoted before (by history, visit, interactive representations) are shown and one is detailed. Likewise, the research tools (by keywords and images) are explained thanks to such schemas, to allow the user to find a document as fast as possible if he has particular criteria [29]. The keywords search engine is multi-criteria (full-text indexed), what means that the user has choice between different words; he does not give the words himself (according to the recommendations given in Section 3.5.).
Fig. 5. Main types of access to the data in the VRE (computer behaviour).
Fig. 6. Use Case Diagrams for the documents inquiry and the interaction with the maps (UML) To give some details, we explain below the data consultation through the interactive maps and 3D models, which have been created thanks to the initial documents coming from the working of archaeological sites.
4.2.1. Interactive maps
The interactive maps are generated in Scalable Vector Graphics SVG, which is the XML formulation of 2D vector graphics. It has been chosen because of its multi-platform and full compliance with XML specifications. It includes drawing of vector data, displaying of image data, interaction and animation. Structure and appearance of graphic elements is separated by using stylesheets. Applying a SVG viewer as a plug-in for the web browser enables zooming and panning in the graphic area. Furthermore sophisticated design possibilities like pattern filling, shading, insertion of symbols and others are provided by SVG. The interactive maps in SVG can be done in the open-source software Inkscape or in the commercial software Adobe Illustrator, from digitized plans of the site or from graphs coming from AutoCAD.
The potentialities of SVG have been used by building a representation, which gives quick access to the dataset by means of templates defined by the user: archaeological templates, photographic templates or typological templates. The PHP interpreter allows access to the file system of the server and a JavaScript program permits the interactivity between the SVG graphic and the Information System. By clicking on different zones (corresponding to the places of the site recorded in the database) defined in the SVG drawing, we access the corresponding form showing the elements that refers to the clicked zone.
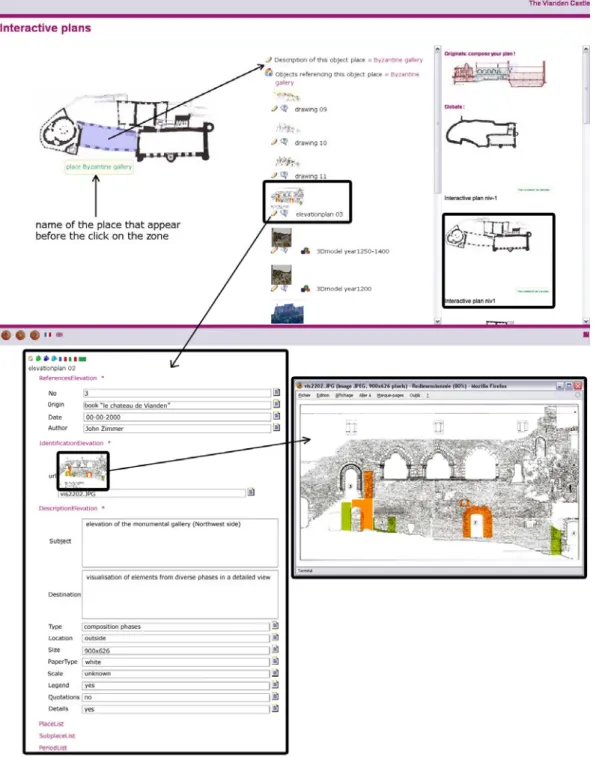
Fig. 7 gives an example of SVG interface created from a scanned image of the Vianden castle, on which interactions zones have been defined. It corresponds to the plan of the first level of the castle like it is today. More particularly, this figure shows the search of documents concerning the place named "Byzantine gallery". When clicking on the geographic place matching this room, we access all the documents referencing it or referenced by it. For instance, a corresponding elevation plan is displayed (elevationplan 03), and when we click on the item permitting to obtain the descriptive form of this elevation, we see the metadata recorded in the database. On this metadata page, we can also click on a miniature to see the original image attached.
Fig. 7. Interactive SVG interface and the correlated documents that can be directly open afterwards. Example of the Vianden castle site.
The possibility to create 2D interfaces is useful to complete the 3D interfaces that we will explain below, because often archaeologists are more used to work on 2D representations than on 3D models. Therefore the proposed VRE gives the possibility to create and exploit 2D interactive graphics to permit multiple types of navigation in the information. However, the 3D offers more possibilities than the 2D and that's why we have developed interaction means for 3D models, which work in the same way than for the 2D graphics explained above.
4.2.2. Interactive 3D models
3D graphics data for the Web is known as VRML Virtual Reality Modelling Language description. That format convention is updated to the XML version, predicted as eXtensible 3D X3D. The VRML code has just to be rewritten with XML conventions and descriptive elements to convert it to X3D format. A lot of viewer can be applied for VRML and X3D in stand-alone mode or as a plug-in for Web browsers (for example Cortona VRML Client from ParallelGraphics). The navigation through the 3D model works in the same way that in the 2D SVG interface, with all the additional possibilities offered by the 3D. The PHP interpreter, scripts in JavaScript and VRMLScript with "routes" are also used for the communication between the database server and the 3D model, in order to access the data that refers to the clicked element.
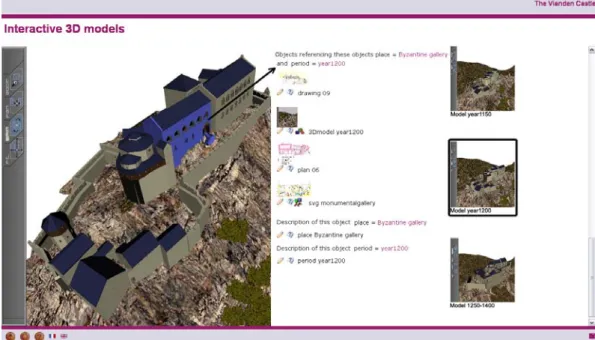
The 3D models included in the VRE have been produced from historical documents (for the models of the past phases of the site) or from surveys (notably laser scanning). The modelling can be done in any software permitting to export in VRML or X3D (for instance Maya). Fig. 8 gives an example of 3D model corresponding to the historical reconstruction of the castle during the 1200s. It has been done by the MAP-CRAI laboratory of Nancy (France).
Fig. 8. Interactive VRML interface allowing access to data referencing and being referenced by the place clicked. Example of the Vianden castle site.
On this model, the place called "Byzantine gallery" can be seen and clicked (like in the 2D plan above). The same interactions are possible, with in addition the opportunities to turn the model, to zoom in deeply or to see elevation data. For instance, we can see directly the particular form of the windows of the gallery, what was not possible on the 2D representation. This example shows the possibility of a query on a combination of period and place (see Section 4.1.): here, the click on the place "Byzantine gallery" on the model of the year 1200 gives only the documents referencing this place and this period simultaneously. On the contrary, in Fig. 7 above we had seen that the interactive map gives the possibility to access all the documents referencing the place "Byzantine gallery" but not at a particular historical period.
4.3. Data update, revision and correction
To look at the data is the first step in the analysis of a dataset. To go further on, the archaeologist (or any expert involved) needs to edit them. A login process allows the user of the VRE to be identified, in order to be able to add data or to modify the facts recorded. This modification is possible in three different types: the update, the revision and the correction of the data and metadata.
The update is the process that permits to manage the evolution of the site (construction, destruction of artefacts). Most of the time, it consists in adding new data (drawings, texts, graphs…) and in modifying metadata about the already recorded objects. For instance, if a building has been destroyed, the old plans stay in the database, but their metadata have to be modified to indicate that the building appearing on the plan does not exist anymore.
To update the data and the metadata recorded in the database:
- the metadata corpus can be used to correct some basic errors (misspelling or simple inconsistencies); - through the graphic interfaces in SVG or VRML, the expert user can directly modify the metadata of
the selected object;
- through different types of search engines (by object type, by location, by epoch), the user can access the data and edit it for modifications;
- a particular item of the Information System permits to add new data.
For the insertion of new data, there are two cases. If the object type is already known in the system, the user has just to fill a data entry form (see Fig. 2) to add a new occurrence of this data. On the other hand, if the object type does not exist yet, the user has to create it and afterwards he can choose the metadata to record (according to a standard like the CIDOC-CRM for example) for the type of data considered.
The revision is another procedure that has to be done if the knowledge of the archaeologist about the site has evolved in time. For instance, if the occupancy of a building has changed, or if a new finding done during a recent excavation deeply modifies the former deductions of the archaeologist about the age or the use of the site. In this case it is necessary to revise the system, what can notably imply to do changes in the conceptual model (Fig. 4) of the VRE (the relations between the objects can vary as well as their attributes). The expert user will then modify the tree structure of the dataset describing the object model. The revision can also concern the maps and the models of the diverse parts of the site. Indeed, if for instance the architectural organization of archaeological entities changes during the working of the site, it is necessary to modify accordingly the 3D models and the maps already recorded and interfaced in the system.
Finally, the correction is principally the rectification of errors that can exist or appear in the database (objects recorded two times with different names, bad links between the tables, etc.).
4.4. Generation of original models and graphs from the initial data
In addition to the data working possibilities explained before, the user of the VRE can generate his own models and composition plans thanks to multi-criteria data entry forms written in PHP. He has the choice to select for example one or several places, and one or several historical phases for which he wants to generate "on the fly" the 3D model, to see the evolutions of the site in time.
For the VRML models, the principle of generation of an original model, according to the choices of the user, is based on the fact that a VRML file is composed of different fragments permitting to cut it in distinct parts. For instance, a geometric form (sphere) can be described by the fraction of computer code shown below:
Shape {
geometry DEF e2_Chateau:pSphere115_0Geo IndexedFaceSet {
convex FALSE solid FALSE
coord DEF e2_Chateau:pSphere115GeoPoints Coordinate { point [ 0.008 -0.099 -0.029, -0.017 -0.119 -0.024, -0.011 -0.112 0.011, 0.015 -0.108 0.005, -0.025 -0.118 -0.001, -0.023 -0.091 0.034, 0.019 -0.085 0.031, ] } } }
This allows to divide the initial models in several parts, each of them containing the code corresponding to the places of interest (during a given period). Then, when the user makes his choices (places and periods in the data entry form), the PHP program that has been written crosses the file containing the fragments of VRML codes and rebuilds a new model by assembling the different parts selected by the user (that had formerly been separated from the initial model). This is possible notably thanks to the fact that in the header
of a PHP program, the type of result file aimed by the user can be chosen. Thus, instead of producing a HTML file (most popular use), it is possible to produce a VRML or a SVG file.
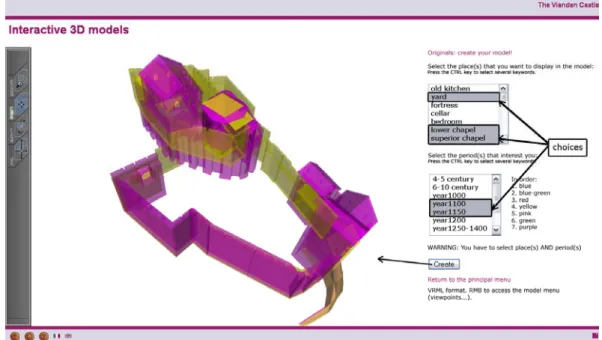
The procedure for an original 3D model of the Vianden castle is to see in Fig. 9. The resulting model presents different parts of the castle (yard, chapel and hall) in two different periods (year 1100 and 1150). We can see in this figure the architectural changes that have been done during the 50 years considered.
Fig. 9. Process to generate 3D models "on the fly". Example of the Vianden castle site.
Approximately the same principle is available to generate synthesis plans or photo-montage in SVG, allowing for instance to superimpose the architectural arrangement of the castle today with its former configurations. Fig. 10 presents north-east elevations showing the castle during the second roman phase (year 1200) of the castle and the same view currently. The process of creation of a synthesis plan is not exactly the same as the process for a VRML model, because we do not use the "vectorial possibilities" of the SVG language yet. In this project, for the moment, we use SVG to interact with scanned plans or drawings that are in a raster format (our initial data were not vectorial). The principle of superimposition described here is then really a display "one on the other one" of raster images having a transparent background. We have not investigated the possibilities of dynamic modifications of vector SVG data yet, this will be done during the continuation of our project.
5. Conclusion
After having set our work objectives on the basis of a state-of-the-art reminding the main computer resources for Cultural Heritage data management, we have presented a Virtual Research Environment for archaeology. The Web Information System allows recording, making use and representing data of any Cultural Heritage site. This VRE has been made to offer solutions to help archaeologists in their tasks at an intra-site level and to avoid them to be software-driven for their conservation and communication work.
In comparison to usual GIS, the Information System developed allows to manage all types of documentary data related to an archaeological site or monument. We are not limited to large-scale spatial data, as we connect all the data types afterwards by places and by periods that are linked to them. Thus, the user can do different kinds of spatiotemporal searches on the data, especially in three dimensions what is rarely amenable to traditional GIS. Moreover, classical GIS are dedicated to the management of geographical data (points, lines, surfaces…) coming from numerous sites, whereas we permit to treat in a unique system the entire heterogeneous documentation (texts, drawings, graphs, models…) of a particular site.
Our GIS is then usable for every type of archaeological site or architectural monument, and the full XML choice for textual and graphical representations permits relevant interactions between the data coming from the different sites. The use of 2D graphics and 3D models as user-interfaces to the data permits to link purely documentary data and metadata to geometric representations. We connect very different types of data to emphasize new research possibilities and new information exchanges between diverse sites, to be able to draw conclusions by crosschecking for instance. Moreover, the data are available through the Internet what allows us to work in the direction of communicating them in an innovative and interactive way.
However, a particular attention has to be paid to this publication on-line of archaeological documentation and research results. We planned to take charge of this problem in our future works, and therefore we have, at this state of progress of our study, no precise answer to these important difficulties. Nevertheless, we can give some elements of reflexion onto these concerns. First of all, we think that the VRE should preferably be used exclusively by the archaeologists who are working on the site during the time of the excavation. Indeed, during this phase of data processing, the professionals have to confront their opinions for the interpretations and it is not pertinent to show data in progress to the general public. This also raises the problem of the rival accesses to the database, in case several archaeologists work at the same time on the same data. Afterwards, before the on-line publishing of the documentation and research results, it is necessary to think about the best means to protect them. Indeed, archaeologists are used to be very careful with their data and interpretations, and they grant a big importance for the protection of their research. This is probably the biggest problem with Internet publication of archaeological data, and we shall take time afterward to find solutions to this difficulty.
Our final aim is to create a simple and everywhere accessible tool for all the sites managers, who wish to be able both to manage efficiently the quantity of data produced, and to represent them in order to make use of this VRE as a virtual storefront for the communication and the e-publication of their findings.
References
[1] Richards Julian D., Recent Trends in Computer Applications in Archaeology, Journal of Archaeological Research 6 (1998) 331-382. DOI 10.1023/A:1022879819064, URL http://dx.doi.org/10.1023/A:1022879819064.
[2] Doerr M., The CIDOC CRM - An Ontological Approach to Semantic Interoperability of Metadata, AI Magazine 24(3) (2003).
[3] Guimier-Sorbets A.-M., Les bases de données en archéologie, CNRS Ed, Paris, 1990.
[4] Ginouvès R., Des banques de données pour l'archéologie ?, Traitement de l'information en archéologie 15 (1990) 97-107. Brises (CNRS).
[5] Ginouvès R., Guimier-Sorbets A.-M., La constitution des données en archéologie classique, CNRS Ed, Paris, 1978.
[6] D'Andrea A., Marchese G. and Zoppi T., Ontological Modelling for Archaeololgical Data, VAST 2006, Joint event of VAST/CIPA/EG WS G&CH/EuroMed, Eurographics Symposium Proceedings, M. Ioannides, D. Arnold, F. Niccolucci, K. Mania (eds.), in cooperation with ACM SIGGRAPH (2006) 211-218. ISBN 3-905673-42-8. Available on line http://diglib.eg.org.
[7] Ryan N. S., The excavation archive as hypertext document?, Computer Applications and Quantitative Methods in Archaeology 1994, Huggett J. and Ryan N., eds., Oxford: BAR International Series 600 (1995) 211-219.
[8] Powlesland D. J., From the trench to the bookshelf: Computer use at the Heslerton Parish Project, Computing for Archaeologists, Ross S., Moffett J. and Henderson J., eds., Oxford: Oxford University Committee for Archaeology Monograph 18 (1991) 155-169.
[9] Van Leusen P. M., GIS and archaeological resource management: A European agenda, Archaeology and Geographical Information Systems: A European Perspective, Lock G. and Stani Z., eds., London: Taylor and Francis (1995) 27-41. [10] Quesada P., Baena J. and Blasco C., An application of GIS to intra-site spatial analysis: The Iberian Iron Age cemetery at El
Cigarralejo (Murcia, Spain), Computer Applications and Quantitative Methods in Archaeology 1994, Huggett J. and Ryan N., eds., Oxford: BAR International Series 600 (1995) 137-146.
[11] Meffert M., Spatial relations in Roman Iron Age settlements in the Assendelver Polders, The Netherlands, Archaeology and Geographical Information Systems: A European Perspective, Lock G. and Stani Z., eds., London: Taylor and Francis (1995) 287-299.
[12] Biswell S., Cropper L., Evans J., Gaffney V. and Leach P., GIS and excavation: A cautionary tale from Shepton Mallet, Somerset, England, Archaeology and Geographical Information Systems: A European Perspective, Lock G. and Stani Z., eds., London: Taylor and Francis (1995) 269-285.
[13] Reilly P., Three-dimensional modelling and primary archaeological data, Archaeology in the Information Age: A Global Perspective, Reilly P. and Rahtz S., eds., London and New York: Routledge. 1992. 147-173.
[14] Chapman G., Surface modelling and proprietary software for building reconstruction, Archaeological Computing Newsletter 27 (1991) 3-11.
[15] Forte M. and Siliotti A., Virtual Archaeology, Great Discoveries Brought to Life Through Virtual Reality, Foreword by Colin Renfrew, Thames and Hudson, London, and Harry N.Abrams, New York (1997).
[16] Gillings M. and Goodrick G. T., Sensuous and reflexive GIS: Exploring visualization and VRML, Internet Archaeology 1 (1996) http://intarch.ac.uk/journal/issue1/gillings_index.html (Accessed 20 March 2005).
[17] Drap P. and Grussenmeyer P., A digital photogrammetric workstation on the web, Journal of Photogrammetry and Remote Sensing 55(1) (2000) 48-58. Official publication of the International Society of Photogrammetry and Remote Sensing (ISPRS). ISSN 0924-2716.
[18] Drap P., Durand A., Seinturier J., Vannini G. and Nucciotti M., Full XML documentation from Photogrammetric survey to 3D visualization. The case study of Shawbak castle in Jordan, The ISPRS International Archives of Photogrammetry, Remote Sensing and Spatial Information Sciences, XXXVI-5/C34 (2005) 771-777. ISSN 1682-1750.
[19] Rahtz S. P. Q. and Sinclair P., Multimedia information systems for East African archaeology, Archeologia e Calcolatori 5 (1994) 219-236.
[20] Smith N., An experiment in electronic exchange and publication of archaeological field data, Computer Applications and Quantitative Methods in Archaeology 1991, Lock G. and Moffett J., eds., Oxford: BAR International Series 577 (1992) 49-57.
[21] McAdam E., CD-ROM—The publishers' view, The Field Archaeologist 24 (1995) 17-18.
[22] Heyworth M. P., Ross S., and Richards J. D., Internet Archaeology: An international electronic journal for archaeology, The Field Archaeologist 24 (1995) 12-13.
[23] Heyworth M. P., Ross S., and Richards J. D., Internet Archaeology: An international electronic journal for archaeology, Interfacing the Past: Computer Applications and Quantitative Methods in Archaeology CAA95, Kamermans H. and Fennema K., eds. Analecta Praehistorica Leidensia 28 (1996) 517-523.
[24] Heyworth M. P., Ross S., and Richards J. D. and Vince A.G., Internet Archaeology: An international electronic journal for archaeology, Archeologia e Calcolatori 7 (1996) 1195-1206.
[25] Eiteljorg Harrison II, The Archaeological Data Archive Project, Computer Applications and Quantitative Methods in Archaeology 1994, Huggett J. and Ryan N., eds., Oxford: BAR International Series 600 (1995) 245-247.
[26] Richards J. D., The Archaeology Data Service, Archaeological Computing Newsletter 46 (1996) 19-23.
[27] Antoni M.-H., Représentation documentaire et construction de la connaissance, Le Médiéviste et l'ordinateur 41 (2002) http://lemo.irht.cnrs.fr/41/mo41_03.htm (Accessed 23 January 2005).
[28] Meyer É., Grussenmeyer P., Perrin J.-P., Durand A., Drap P., Integration of heterogeneous cultural heritage data in a web based information system: a case study from Vianden Castle, Luxembourg. Accepted for the proceedings of the Computer Applications and Quantitative Methods in Archaeology 2006, "Digital Discovery. Exploring New Frontiers in Human Heritage", Oxford: BAR International Series (2006).
[29] Meyer É., Grussenmeyer P., Perrin J.-P., Durand A., Drap P., Intra-site Level Cultural Heritage Documentation: Combination of Survey, Modeling and Imagery Data in a Web Information System, Short papers from the joint event CIPA / VAST / EG / EuroMed 2006, 30 October – 4 November 2006, Nicosia, Cyprus, edited by M. Ioannides, D. Arnold, F. Niccolucci, K. Mania, EPOCH Publication (2006) 129-134. ISBN-10: 963 8046 74 0.