Albane B.R. Maggio*, Julie Wacker Bou Puigdefabregas, Valerie M. Schwitzgebel, Catherine
Chamay-Weber, Maurice Beghetti and Nathalie J. Farpour-Lambert
Insulin secretion response during oral glucose
tolerance test is related to low cardiorespiratory
fitness in obese adolescents
Abstract
Background: The obesity paradox refers to a category of
subjects who may be less prone to develop co-morbidities,
such as type 2 diabetes. Cardiorespiratory fitness (CRF)
has been identified as one of the key factors. We aimed at
exploring the difference in insulin metabolism between fit
and unfit obese adolescents.
Methods: We recruited 22 obese adolescents and assessed
CRF during an incremental treadmill test. According to
a cut-off at 80% of predicted maximal oxygen
consump-tion (VO
2max), subjects were separated into low or normal
CRF. Body composition was determined by
densitom-etry. Serum levels of insulin were measured sequentially
during an oral glucose tolerance test and insulin secretion
responses were calculated.
Results: Compared to adolescents with normal CRF, the
ones with low CRF had higher insulin resistance indices
(p = 0.023) and insulin secretion response (p = 0.010),
inde-pendently of the body mass index z-score.
Conclusions: Interventions in obese adolescents should
focus on the maintenance or improvement of CRF to at
least 80% of predicted VO
2max. Indeed, this cut-off was
significantly related to insulin secretion responses,
inde-pendently of the adiposity level. A CRF above the proposed
cut-off may prevent the development of insulin resistance.
Keywords: adolescent; cardio-respiratory fitness; insulin
sensibility; obesity paradox.
DOI 10.1515/jpem-2014-0321
Received July 29, 2014; accepted September 22, 2014; previously published online October 18, 2014
Introduction
Childhood obesity leads to the development of many
com-plications, such as type 2 diabetes (T2DM), resulting in
an increased morbidity and premature mortality in
adult-hood (1). The prevalence of abnormal glucose metabolism
or T2DM is increasing in youth, especially for subjects at
risk (2). Furthermore, insulin resistance is frequent in
over-weight adolescents, long before the occurrence of glucose
dysfunction, and is related to the severity of obesity (3, 4).
This condition plays a crucial role, as it is also implicated
in the development of other co-morbidities such as
dys-lipidemia, hypertension, non-alcoholic fatty liver disease
and the metabolic syndrome (5, 6).
The obesity paradoxes have been widely discussed
in the adult population (7). One of those paradoxes refers
to a subgroup of obese subjects who may be protected
against obesity-related complications. The role of
cardi-orespiratory fitness (CRF) as a protecting factor has been
proposed (8–10), with the demonstration that
metaboli-cally healthy obese subjects were fitter than unhealthy
ones (8). This paradox has been poorly investigated in
obese adolescents.
*Corresponding author: Albane B.R. Maggio, MD, Pediatric Obesity
and Chronic Diseases, Service of Pediatric Specialties, Department of Child and Adolescent, University Hospitals of Geneva 6, rue Willy-Donzé, 1211 Geneva 14, Switzerland, Phone: +41-22-382-33-11, Fax: +41-22-372-50-90, E-mail: albane.maggio@hcuge.ch
Julie Wacker Bou Puigdefabregas and Maurice Beghetti: Pediatric
Cardiology Unit, Service of Pediatric Specialties, Department of Child and Adolescent, University Hospitals of Geneva and University of Geneva, 1211 Geneva 14, Switzerland
Valerie M. Schwitzgebel: Pediatric Endocrine and Diabetes Unit,
Division of Growth and Development, Department of Child and Adolescent, University Hospitals of Geneva and University of Geneva, 1211 Geneva 14, Switzerland
Catherine Chamay-Weber: Pediatric Obesity and Chronic
Diseases, Service of Pediatric Specialties, Department of Child and Adolescent, University Hospitals of Geneva and University of Geneva, 1211 Geneva 14, Switzerland
Nathalie J. Farpour-Lambert: Obesity Care Program, Service
of Therapeutic Education for Chronic Diseases, Department of Community Medicine, Primary Care and Emergency, University Hospitals of Geneva and University of Geneva, Geneva, Switzerland; and Pediatric Sports Medicine Clinic, Service of General Pediatrics, Department of Child and Adolescent, University Hospitals of Geneva and University of Geneva, Geneva, Switzerland
This study aimed at looking at the difference in insulin
levels, measured sequentially during an oral glucose
toler-ance test (OGTT), between fit and unfit obese adolescents.
Materials and methods
Study design and subjects
This study is embedded in a prospective cross-sectional protocol which aimed at measuring cardiovascular risk factors in obese lescents. The main study population was composed of 25 obese ado-lescents (55% of females), aged 10–16 years (mean: 14.0 ± 0.9), living in an urban area. They were recruited at the Pediatric Obesity Clinic of the University Hospitals of Geneva.
Inclusion criteria for the main study were: 1) onset of puberty, 2) no diagnosis of hypertension, 3) no antihypertensive or anti-dia-betic treatment, 4) no use of medication affecting glucose and lipid metabolisms, 5) no history of familial hypertension or dyslipidemia and 6) absence of diabetes or other chronic diseases. Based on these criteria, we had to exclude one subject after the initial laboratory testing because of previously unknown familial hypercholestero-lemia.
For the purpose of this project, only subjects from the main study who performed a cardiorespiratory fitness test were analyzed (22/24).
Once informed, a written consent was obtained from both par-ents and adolescpar-ents. The Mother and Child Ethics Committee of the University Hospitals of Geneva approved the study.
Measures
Anthropometrics and body composition We assessed body weight
(kg) in light clothes (panties and tee-shirt) and height (cm) with-out shoes. Body mass index (BMI) was calculated as weight/height squared (kg/m2) and z-scores were derived using the World Health
Organization references (11). Mean BMI and BMI z-scores were 30.5 ± 5.4 (kg/cm2) and 2.6 ± 0.7, respectively. Pubertal development
(Tanner’s stages) was determined by clinical examination.
Fat mass (FM, kg), fat-free mass (FFM, kg), percentage of total body fat (%) and percentage of abdominal fat (%) were measured using dual-energy X-ray absorptiometry (DXA; GE Lunar Prodigy™,
Lunar Corp., Madison, WI, USA). Manual analysis, with the “regions of interest” feature, was performed on total body scans to assess abdominal fat. The upper border was defined as the distal margin of the lower ribs, and the lower border was defined as just superior to the supra-iliac crest. The lateral margins were placed outside the body, so that all abdominal but no arm tissue was included (12).
Glucose and insulin metabolisms All subjects underwent an OGTT
in the morning (8:00 AM) after a 12-h overnight fast. Timed blood samples (at –15, 0, 30, 60, 90 and 120 min) were collected for the measurement of plasma glucose and insulin concentrations (13), which were measured using standard automated techniques (SYN-CHRON LX20®) and radioimmunoassay (Access® ultrasensitive
insu-lin, Beckman Coulter Ireland Inc.), respectively.
Insulin resistance was assessed using the homeostasis model [HOMA-IR = fasting insulin (μU/mL) × fasting glucose (mmol/L)/22.5]. An HOMA-IR > 3 was considered abnormal (14). Insulin sensitivity index (ISI) was calculated according to the method described by Matsuda and DeFronzo (13), and the beta-cell function was evaluated by the insulin secretion responses during the OGTT. The total area under the curve was calculated by the trapezoid integration procedure (AUCinsulin)
(15). Glucose response during the OGTT was also evaluated. Impaired fasting glucose (IFG), impaired glucose tolerance (IGT) or T2DM was defined according to the American Diabetes Association.
Cardiorespiratory fitness CRF was determined as peak oxygen
consumption (peakVO2) assessed by direct gas analysis (Vmax
Spec-tra™, Vyasis Healthcare, GE, USA) during a multi-stage treadmill test
(Marquette 2000™, GE, USA). After a graded warm-up (2 min at 4 and
2 min at 5 km/h), the subject either walked fast or ran on the treadmill at a constant speed, which varied by age and physical capacity (6–9 km/h). The grade of the treadmill was increased by 2.5% every 2 min until the subject was exhausted. Maximal heart rate (beat/min), res-piratory quotient (RQ) and VO2 were recorded at the end of the test.
The VO2 was considered maximal if clinical signs of exhaustion and
at least one of the following criteria were present: heart rate > 95% of predicted maximal heart rate for age (i.e., 220–age), RQ > 1.05, or oxygen plateau with a < 2 mL/kg/min increase in VO2 with
increas-ing work rate. CRF was considered low if the peakVO2 was < 80% of
predicted maximal VO2 (16, 17).
Statistical analysis
Statistical analyses were performed using the SPSS software 18.0 (Chicago, IL, USA). The initial number of subjects needed was culated for the main cardiovascular outcome. However, a power cal-culation analysis with an alpha error of 5% showed that, with our sample size, statistical power was of 97.5% for AUCinsulin, 73.9% for
HOMA-IR and 53.3% for ISI. Data are presented as mean and stand-ard deviation (SD). Statistical differences between groups or gender were analyzed using an independent Student’s t-test and χ2. We used
analysis of co-variance (ANCOVA) to adjust the groups’ comparison for the percentage of abdominal fat, one-way ANOVA with the Bon-ferroni post-hoc test to compare some variables among pubertal stages and a quadratic regression analysis to evaluate the relation-ship between insulin sensitivity and secretion. We had no missing data. Differences were considered significant if p < 0.05.
Results
Patients’ characteristics
The complete physical characteristics of the subjects
have been reported previously (18). Only data on fasting
glucose and insulin concentrations are duplicated in the
present study. Characteristics of the 22 subjects who
per-formed the cardiorespiratory test are presented according
to their VO
2max in Table 1.
Glucose and insulin metabolisms
The HOMA-IR was normal in 77% (17/22) of subjects and
none of them presented IFG and/or IGT upon OGTT.
Insulin levels measured at different time points during the
OGTT for all subjects are presented in Figure 1A, and the
relationship between insulin secretion (AUC) and
sensitiv-ity (ISI) is presented in Figure 2. There was no difference
in insulin or glucose concentrations between gender or
among pubertal stages (p > 0.05 for all).
Cardiorespiratory fitness
All subjects reached exhaustion during the treadmill
test, 64% (14/22) of them attained the 95% of predicted
maximal heart rate and 55% (12/22) had an RQ above 1.05.
In total, 17 subjects fulfilled the criteria for the maximal
test. As all subjects reached exhaustion, we decided to
compare peakVO
2rather than VO
2max in order to analyze
all of them. There was no difference in pubertal stages
or gender for peakVO
2or maximal heart rate, but an RQ
above 1.05 was more frequently achieved in girls (girls:
9/12, boys: 3/10; p = 0.035).
Half (11/22) of all subjects were considered to have
low CRF with a peakVO
2under the 80% of predicted
maximal value. There was no difference in the number
of subjects fulfilling the criteria for the maximal test
between the two groups (8/11 in normal CRF; 9/11 in low
CRF; p = 0.611). The characteristics’ comparison between
the two different cardiorespiratory statuses is presented
in Table 1.
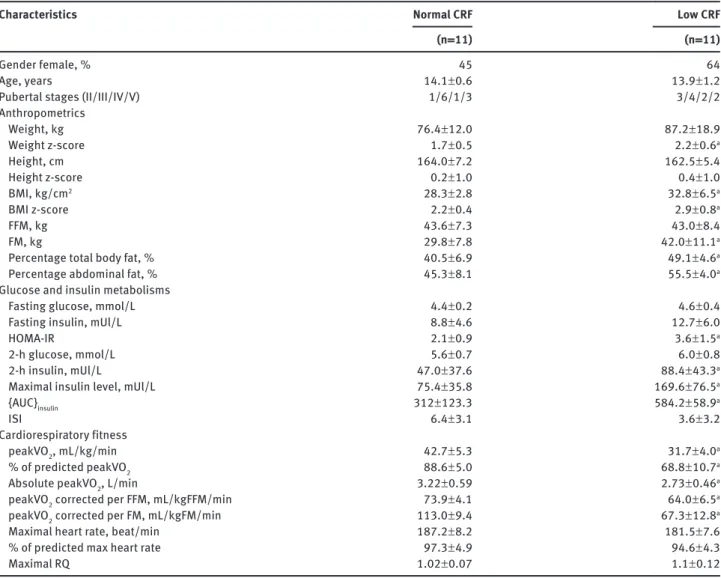
Table 1 Characteristics of obese subjects. Characteristics
Normal CRF(n = 11) Low CRF(n = 11)
Gender female, % 45 64
Age, years 14.1 ± 0.6 13.9 ± 1.2
Pubertal stages (II/III/IV/V) 1/6/1/3 3/4/2/2
Anthropometrics Weight, kg 76.4 ± 12.0 87.2 ± 18.9 Weight z-score 1.7 ± 0.5 2.2 ± 0.6a Height, cm 164.0 ± 7.2 162.5 ± 5.4 Height z-score 0.2 ± 1.0 0.4 ± 1.0 BMI, kg/cm2 28.3 ± 2.8 32.8 ± 6.5a BMI z-score 2.2 ± 0.4 2.9 ± 0.8a FFM, kg 43.6 ± 7.3 43.0 ± 8.4 FM, kg 29.8 ± 7.8 42.0 ± 11.1a
Percentage total body fat, % 40.5 ± 6.9 49.1 ± 4.6a
Percentage abdominal fat, % 45.3 ± 8.1 55.5 ± 4.0a
Glucose and insulin metabolisms
Fasting glucose, mmol/L 4.4 ± 0.2 4.6 ± 0.4
Fasting insulin, mUl/L 8.8 ± 4.6 12.7 ± 6.0
HOMA-IR 2.1 ± 0.9 3.6 ± 1.5a
2-h glucose, mmol/L 5.6 ± 0.7 6.0 ± 0.8
2-h insulin, mUl/L 47.0 ± 37.6 88.4 ± 43.3a
Maximal insulin level, mUl/L 75.4 ± 35.8 169.6 ± 76.5a
{AUC}insulin 312 ± 123.3 584.2 ± 58.9a
ISI 6.4 ± 3.1 3.6 ± 3.2
Cardiorespiratory fitness
peakVO2, mL/kg/min 42.7 ± 5.3 31.7 ± 4.0a
% of predicted peakVO2 88.6 ± 5.0 68.8 ± 10.7a
Absolute peakVO2, L/min 3.22 ± 0.59 2.73 ± 0.46a
peakVO2 corrected per FFM, mL/kgFFM/min 73.9 ± 4.1 64.0 ± 6.5a
peakVO2 corrected per FM, mL/kgFM/min 113.0 ± 9.4 67.3 ± 12.8a
Maximal heart rate, beat/min 187.2 ± 8.2 181.5 ± 7.6
% of predicted max heart rate 97.3 ± 4.9 94.6 ± 4.3
Maximal RQ 1.02 ± 0.07 1.1 ± 0.12
Results are expressed as mean and SD. ap < 0.05 between normal and low CRF. CRF, cardiorespiratory fitness; BMI, body mass index; FFM,
fat-free mass; FM, fat mass; HOMA-IR, homeostasis model assessment; AUC, area under the curve; ISI, insulin sensitivity index; peakVO2,
Absolute and FM- or FFM-corrected peakVO
2were
statistically different between the two CRF groups
(abso-lute: p = 0.040; FM- and FFM-corrected: p < 0.001). There
were no differences among gender or pubertal stages for
0.0 0 200 400 600 800 1000 R2 Quadratic=0.809 2.5 5.0 7.5 10.0
Insulin sensitivity index, ISI
Insulin secretion, AUC
12.5
Figure 2 Relationship between insulin secretion and sensitivity.
The plain line represents the quadratic regression line.
normal or low CRF. Compared to subjects with normal CRF,
adolescents with low CRF had an ISI divided by almost 2,
with a difference approaching the significance (p = 0.062).
Insulin resistance indices and insulin levels during the
OGTT, except at the fasting state, were also significantly
higher in this group (Figure 1B).
As subjects with low CRF had also a higher BMI
z-score, we performed an ANCOVA with adjustment for
the BMI z-score, in order to compare HOMA-IR, ISI and
AUC
insulinbetween the two CRF groups. We found that they
stayed significantly different between the two CRF groups
(HOMA-IR: F = 20.0, p < 0.001; AUC
insulin: F = 9.5, p = 0.001;
ISI: F = 4.5, p = 0.026). We performed the same analyses
adjusting for body composition, gender or pubertal stage
(all variables) and found that HOMA-IR and AUC
insulinremained significantly different. However, results for
insulin sensitivity were less clear with nonsignificant
results when adjusting for gender or pubertal stage (all
variables).
Discussion
The association between CRF and insulin metabolism has
been poorly studied in obese children and adolescents, in
contrast to the adult population. In our study, we aimed
to explore the difference in insulin metabolism between
fit and unfit obese adolescents. We therefore investigated
sequential measurements of insulin levels after glucose
overload, and we demonstrated that unfit obese subjects
had higher insulin resistance indices and insulin
secre-tion response compared to fit subjects. This difference was
independent of the adiposity level.
It is well known that cardiovascular diseases risks
are different between fit and unfit adult subjects (8, 19),
with better insulin sensitivity in those with high CRF
(20–22). Indeed, subjects with insulin resistance or T2DM
have generally reduced CRF concomitantly to a decreased
capacity to transport and oxidize glucose, as well as a
decrement in cellular glycogen synthase activity (23). We
therefore divided obese adolescents into normal and low
CRF (peakVO
2<
80% of predicted VO
2max) (16, 17). Using
this cut-off, the mean peakVO
2by gender in each group
(data not shown) corresponded to the normative data
pro-posed by the European Group of Pediatric Work
Physiol-ogy, i.e., a peakVO
2of ≥ 35 mL/kg/min for girls and ≥ 40
mL/kg/min for boys (24). In addition, 50% of our subjects
had low CRF. This difference in CRF was not due to body
composition, as absolute and corrected peakVO
2values
for FM or FFM remained significantly different between
200A
B
180 160 140 120 100 80 60 40 250 200 150 100 p=0.001 p=0.013 p=0.031 50 0 20 0 T0 T30 T60Time of measure, min
Mean insulin level, mU/L
Mean insulin level, mU/L
T120 PeakVO2 <80% of predicted level PeakVO2 >80% of predicted level T0 T30 T60
Time of measure, min
T120
Figure 1 Evolution of insulin concentrations according to time
of measurement after glucose overload. (A) In all subjects: bars refer for standard deviations; T = time of sampling. (B) According to cardiorespiratory fitness levels: bars refer for standard deviations; T = time of sampling.
the two groups. This highlights the fact that regardless of
the difference in lean or fat mass, the low CRF group has
lower muscle oxidative capacity compared to the normal
CRF group.
The main finding of this study is that low CRF in obese
adolescents was associated with significantly higher
insulin indices: higher HOMA-IR, as well as higher 2-h
insulin and insulin secretion response during the OGTT.
These differences were independent of the BMI z-score
or body composition. Furthermore, the ISI was almost
twofold lower, suggesting an increased risk to develop
diabetes. Insulin sensitivity is known to depend of the
amount of oxidative and insulin-sensitive type 1 muscular
fibers, muscular lipid content, as well as fat and/or lipid
droplet size into the muscle cells (25). In our study, lean
tissue did not differ between adolescents with normal
or low CRF, which may explain the trend in ISI between
groups. In fact, this difference was significant when
adjusting for adiposity.
The identification of subjects with normal or low CRF
is essential, as it may predict the development of the
meta-bolic syndrome (26), as well as obesity-related
complica-tions later in life (8). Indeed, Ruiz et al. demonstrated that
healthy children with low CRF (using similar cut-offs) had
higher cluster of metabolic risk factors (19). Forty to
forty-four percent of healthy children did not reach the cut-off,
which mirrors our findings. Ortega et al. suggested that
CRF plays a key role in mortality and morbidity
progno-sis, as they demonstrated that metabolically healthy but
obese phenotype adults had higher fitness and lower
obe-sity-related complications (8). Furthermore, children with
low CRF may beneficiate of exercise training program, as
they are more prone to improve CRF and reduce
cardiovas-cular and metabolic risk factors (27).
Strengths and limitations of the study
The strengths of this study are the sequential
measure-ments of insulin and glucose concentrations performed
during the OGTT, as well as the objective measures of
CRF. Furthermore, no obese adolescents showed
abnor-mal glucose metabolism making the comparison between
groups more reliable.
This study suffers from the following limitations.
First, the sample size is limited and may adversely affect
the power of our analysis and limit the reliability of the
subgroup analysis based on gender and pubertal status.
Second, the cross-sectional nature of the study reduces
our ability to make inferences about temporal link
between CRF and insulin metabolism changes. Third, the
age group studied coincides with pubertal development,
which greatly influences insulin sensitivity.
Our study demonstrated that low CRF in obese
ado-lescents was strongly related to increased insulin
resist-ance and secretion. We suggest that interventions in youth
should focus on the maintenance or improvement of the
CRF level above the 80% of predicted maximal VO
2, as it
is significantly related to better beta-cell function. A CRF
above recognized cut-offs might prevent the development
of insulin resistance. Finally, further studies are needed
to determine if normal CRF during childhood and
adoles-cences may delay or reduce the development of
obesity-related complications later in life.
Acknowledgments: We thank the subjects for
volunteer-ing for the study, Xavier Martin and the staff of the
Pediat-ric Research Platform for their assistance. This study was
supported financially by the “Prim’Enfance Foundation”,
the Geneva University Hospital Research and
Develop-ment Fund. The work was independent of the funding.
Conflicts of interest statement: The authors have no
con-flicts of interest to declare.
References
1. Reilly JJ, Kelly J. Long-term impact of overweight and obesity in childhood and adolescence on morbidity and premature mortality in adulthood: systematic review. Int J Obes (Lond) 2011;35:891–8. 2. Fagot-Campagna A, Pettitt DJ, Engelgau MM, Burrows NR, Geiss
LS, et al. Type 2 diabetes among North American children and adolescents: an epidemiologic review and a public health per-spective. J Pediatr 2000;136:664–72.
3. Dolan LM, Bean J, D’Alessio D, Cohen RM, Morrison JA, et al. Frequency of abnormal carbohydrate metabolism and diabe-tes in a population-based screening of adolescents. J Pediatr 2005;146:751–8.
4. Weiss R, Dziura J, Burgert TS, Tamborlane WV, Taksali SE, et al. Obesity and the metabolic syndrome in children and adoles-cents. N Engl J Med 2004;350:2362–74.
5. Schwimmer JB, Pardee PE, Lavine JE, Blumkin AK, Cook S. Cardio-vascular risk factors and the metabolic syndrome in pediatric nonalcoholic fatty liver disease. Circulation 2008;118:277–83. 6. Reaven GM. Role of insulin resistance in human disease (syndrome
X): an expanded definition. Annu Rev Med 1993;44:121–31. 7. McAuley PA, Blair SN. Obesity paradoxes. J Sports Sci
2011;29:773–82.
8. Ortega FB, Lee DC, Katzmarzyk PT, Ruiz JR, Sui X, et al. The intrigu-ing metabolically healthy but obese phenotype: cardiovascular prognosis and role of fitness. Eur Heart J 2013;34:389–97. 9. Lee S, Kuk JL, Katzmarzyk PT, Blair SN, Church TS, et al.
Cardi-orespiratory fitness attenuates metabolic risk independent of abdominal subcutaneous and visceral fat in men. Diabetes Care 2005;28:895–901.
10. Messier V, Malita FM, Rabasa-Lhoret R, Brochu M, Karelis AD. Association of cardiorespiratory fitness with insulin sensitivity in overweight and obese postmenopausal women: a Montreal Ottawa New Emerging Team study. Metabolism 2008;57: 1293–8.
11. WHO. WHO Child Growth Standards: length/height-for-age, weight-for-age, weight-for-length, weight-for-height and body mass index-for-age: methods and development. WHO, 2006:312pp.
12. Kamel EG, McNeill G, Han TS, Smith FW, Avenell A, et al. Measurement of abdominal fat by magnetic resonance imag-ing, dual-energy X-ray absorptiometry and anthropometry in non-obese men and women. Int J Obes Relat Metab Disord 1999;23:686–92.
13. Matsuda M, DeFronzo RA. Insulin sensitivity indices obtained from oral glucose tolerance testing: comparison with the eugly-cemic insulin clamp. Diabetes Care 1999;22:1462–70. 14. Allard P, Delvin EE, Paradis G, Hanley JA, O’Loughlin J, et al.
Dis-tribution of fasting plasma insulin, free fatty acids, and glucose concentrations and of homeostasis model assessment of insulin resistance in a representative sample of Quebec children and adolescents. Clin Chem 2003;49:644–9.
15. Pacini G, Mari A. Methods for clinical assessment of insulin sensitivity and beta-cell function. Best Pract Res Clin Endocrinol Metab 2003;17:305–22.
16. Giardini A, Odendaal D, Khambadkone S, Derrick G. Physiologic decrease of ventilatory response to exercise in the second decade of life in healthy children. Am Heart J 2011;161:1214–9.
17. Ruppel GL. Cardiopulmonary exercise testing. In: Ruppel GL, editor. Manual of pulmonary function testing, 9th ed. St. Louis, MO: MOSBY Elsevier, 2008:209–70.
18. Maggio AB, Mueller P, Wacker J, Viallon M, Belli DC, et al. Increased pancreatic fat fraction is present in obese adolescents with meta-bolic syndrome. J Pediatr Gastroenterol Nutr 2012;54:720–6.
19. Ruiz JR, Ortega FB, Rizzo NS, Villa I, Hurtig-Wennlof A, et al. High cardiovascular fitness is associated with low metabolic risk score in children: the European Youth Heart Study. Pediatr Res 2007;61:350–5.
20. Allen DB, Nemeth BA, Clark RR, Peterson SE, Eickhoff J, et al. Fitness is a stronger predictor of fasting insulin levels than fatness in overweight male middle-school children. J Pediatr 2007;150:383–7.
21. Ball GD, Shaibi GQ, Cruz ML, Watkins MP, Weigensberg MJ, et al. Insulin sensitivity, cardiorespiratory fitness, and physical activ-ity in overweight Hispanic youth. Obes Res. 2004;12:77–85. 22. Eisenmann JC, DuBose KD, Donnelly JE. Fatness, fitness, and
insulin sensitivity among 7- to 9-year-old children. Obesity (Silver Spring) 2007;15:2135–44.
23. Shulman GI, Rothman DL, Jue T, Stein P, DeFronzo RA, et al. Quantitation of muscle glycogen synthesis in normal sub-jects and subsub-jects with non-insulin-dependent diabetes by 13C nuclear magnetic resonance spectroscopy. N Engl J Med 1990;322:223–8.
24. Bell RD, Macek M, Rutenfranz J, Saris WH. Health indicators and risk factors of cardiovascular diseases during childhood and adolescence. In: Rutenfranz J, Mocelin R, Klimt F, editors. Children and exercise XII. Champaign, IL: Human Kinetics, 1986:19–27.
25. Bruce CR, Hawley JA. Improvements in insulin resistance with aerobic exercise training: a lipocentric approach. Med Sci Sports Exerc 2004;36:1196–201.
26. Laaksonen DE, Lakka HM, Salonen JT, Niskanen LK, Rauramaa R, et al. Low levels of leisure-time physical activity and cardiores-piratory fitness predict development of the metabolic syndrome. Diabetes Care 2002;25:1612–8.
27. Calcaterra V, Larizza D, Codrons E, De Silvestri A, Brambilla P, et al. Improved metabolic and cardiorespiratory fitness during a recreational training program in obese children. J Pediatr Endocrinol Metab 2013;26:271–6.