ORIGINAL ARTICLE
Prevalence and determinants of the cleanliness of shared
toilets in Kampala slums, Uganda
Innocent Kamara Tumwebaze
Received: 1 April 2013 / Accepted: 26 August 2013 / Published online: 7 September 2013 # Springer-Verlag Berlin Heidelberg 2013
Abstract
Aim Keeping shared toilets clean is a key public health chal-lenge household users face in urban slum settlements of most developing countries. This paper provides insights on the cleanliness of households’ shared toilets and the factors that influence their cleanliness, as well as influencing the inclina-tion of the users to keep them clean.
Subjects and methods This analysis is part of a cross-sectional study conducted in 50 randomly selected slums in Kampala, Uganda between October and November 2010. A total of 1,500 respondents were interviewed, using a semi-structured questionnaire.
Results Out of 1,019 respondents using shared toilets, less than 12 % reported having very clean toilets. Some of the significant factors influencing the cleanliness of shared toilets are: the ease or difficulty in keeping shared toilets clean, the number of households sharing a toilet room, effortful cleaning behaviour and cleaning intention on the part of the users. Conclusion The findings show that most slum dwellers use toilets that are not hygienic.
Keywords Cleanliness . Shared toilets . Slums . Kampala . Uganda
Introduction
The question of whether shared toilets in urban slums can be considered improved, safe or hygienic to use is subject to
international debate. Shared toilets are classified as unim-proved according to the United Nations Joint Monitoring Programme (JMP) for Safe Water and Sanitation mainly due to the challenges associated with their accessibility, safety and cleanliness (Unicef/WHO2012). Using clean toilets contrib-utes to a reduction of many diseases such as diarrhoea, dys-entery, worm infections and cholera that are prevalent in dense urban slums.
While some researchers contend that shared or public toilets (as opposed to individual household toilets) are the best option for densely populated urban slums be-cause of space constraints (Schouten and Mathenge
2010; Katukiza et al. 2012), their cleanliness is an important factor to take into account and needs to be emphasized. Over the last two decades, the numbers of people using shared sanitation facilities in Uganda in-creased from 16 % in 1990 to 20 % in 2010 (Unicef/ WHO 2012). With the current rapid urbanization, the numbers of people using shared sanitation facilities is likely to continue increasing. However, if the increase in shared toilet use is not matched with appropriate hy-giene such as keeping the facilities clean, their contri-bution as a preventive health indicator is compromised. In Kampala, the capital city of Uganda, which has an estimate of 188 slums, the numbers of users of shared sanitation (68 %) is much higher than those using private toilets (20 %) (Tumwebaze et al. 2012).
Accordingly, JMP now seeks to acknowledge the impor-tance of shared toilets and its task force is exploring the issues of shared toilets in order to determine whether they should be considered as a category of improved sanitation in the post-2015 Sustainable Development Goals. The basis for categorising shared toilets as improved is likely to depend on, among one of the most defining factors, the possibility of keeping them clean. This paper, thus, provides an assessment on the cleanliness of shared toilets in Kampala’s slums.
I. K. Tumwebaze (*)
Department of Psychology, University of Zurich, Binzmühlestrasse 14, P.O. Box 1, 8050 Zürich, Switzerland
e-mail: [email protected] I. K. Tumwebaze
Methods
In this paper, a toilet is considered shared if most of its users know each other. This is different from public toilets that are open to everyone and whose users might not necessarily know each other. Quantitative data to assess the cleanliness of shared toilets and its determinant factors was collected using a semi-structured questionnaire. An interviewer checklist was used to verify the cleanliness of the toilets that were accessible to the interviewed household respondents. This had the same measurement as in the household semi-structured questionnaire. The cleanliness variable was measured using a scale of five responses (very clean to not usable/very dirty). Clean toilets are defined as those where there is no urine, solid faecal matter, dirty paper or any other refuse on the slab or squat hole.
This paper is based on data from a sanitation survey conducted between October and November 2010 to assess the sanitation situation in Kampala’s slums. A study group, consisting of 1,500 respondents, were interviewed in 50 ran-domly selected slums in five divisions of Kampala City. Systematic sampling was used to enrol respondents; one re-spondent was interviewed at every third housing block. The targeted respondents were household heads, spouses, or other persons in charge as long as they were not younger than 18 years of age. At households in which potential household respondents did not consent to participate or no one was at home during data collection, the interviewer would move on to the next household. Out of the 1,500 respondents interviewed, only data from shared toilet users (1,019) was analysed for this paper, accounting for 68 %l of the users. Private and public toilet users were excluded from this analysis.
The variables analysed included: the respondents percep-tion of the cleanliness of the shared toilets and interviewers observation of their cleanliness, the relationships among the families sharing a facility, the responsible individuals who did the cleaning, the number of families sharing a toilet room and behavioural factors such as cleaning intention, cleaning habit, the importance of using a clean toilet, whether people talked to each other about keeping the shared toilet clean, whether cleaning the toilet was effortful, the ease or difficulty of keeping the toilet clean, the sense of disgust from using a dirty toilet and the reasons people had to leave the toilet dirty. In this paper, SPSS (version 17), statistical analysis soft-ware, was used. The correlations and associations concerning the cleanliness determinants of the shared toilets were deter-mined using linear regression, and descriptive statistics were used to determine the prevalence of cleanliness and other frequencies and percentages.
The likely bias types in this study related to the selection of the study population, those held by the respondents that influ-ence their responses, and the bias of the interviewers. In this
study, the slum data such as the total number of slums in Kampala Capital City Authority and their demarcation were derived from the 2005 census data for Kampala. The demar-cation of the slums was further verified through discussions with the division leaders of the slums. Random sampling with STATA software, version 11, was used to select the 50 slums of the study group, which minimised the possible effects that could be associated with any selection bias of the studied slums. Females were the majority of the respondents interviewed. Most males in the households were not at home when the data was collected. Secondly, the reporting bias of the respondents about the perceived cleanliness of the shared toilets was cross checked by the use of interviewer observa-tion quesobserva-tions. During or after the compleobserva-tion of household interviews, interviewers visited the toilets that the respondents reported that they used. Lastly, interviewer bias was mini-mized by recruiting interviewers who had expertise in the local language (Luganda) that is commonly spoken in the slums of Kampala. The interviewers were also given training on good data collection techniques and on how to pre-test the questionnaires before actual data collection.
Results
Out of 1,019 cases analysed in this study, only 24.2 % of them were male respondents. However, most household heads (69.5 %) were men. Less than a quarter (11.1 %) of the respondents perceived their toilets as very clean, while 45.8 % of the respondents reported that they found them clean enough to use, 20.1 % dirty but usable, 1.3 % very dirty and not usable, and 21.7 % neither dirty, nor clean. On the other hand, interviewers observed that only 3.2 % of the shared toilet rooms were very clean, while 38.9 % were clean enough to use, 29 % dirty but usable, 3.2 % very dirty and not usable and 21.5 % neither dirty nor clean.
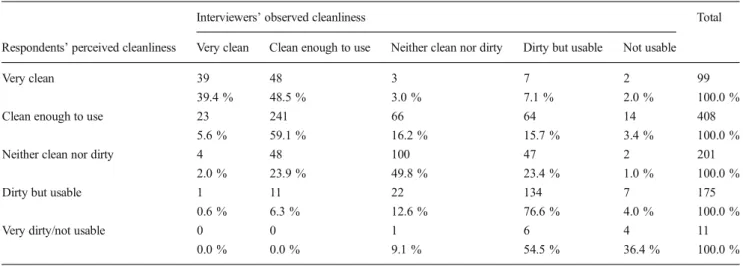
Table 1 shows the levels of agreement concerning the perceived cleanliness of the shared toilets as reported by the respondents and observed by the interviewers.There was a moderate agreement (0.41) between the respondents and the interviewers about cleanliness (Table 1). Kappa agreement statistics range from negative one to positive one, with posi-tive one rated as almost perfect (Munoz and Bangdiwala
1997). There was a positive Pearson correlation of 0.57 which was also significant ( P-value <0.05).
Regarding who is mainly responsible for the cleaning of the shared toilets, over half of the respondents mentioned that all user households were responsible for their cleaning (Table2).The cleanliness of shared toilets related as well to the frequency of their being cleaned. The toilet rooms cleaned everyday were about four times (76.6 %) more clean (clean-liness classified as facilities very clean or clean enough to use) than those cleaned once a week (20.2 %).
The relations among the users also influenced the cleanli-ness of the shared toilets. Half of the toilets clean enough to use were shared among relatives, followed by 44.9 % among direct neighbour users, 41.9 % well-known neighbours (not next door), 37.7 % not well-known neighbours and 36.5 % friends outside the neighbourhood.
The cleanliness of shared toilet rooms also varied depending on the number of user households as shown in Fig.1. As the number of households sharing a toilet room increased, cleanliness decreased.The shared toilets were more likely to be reported clean if users perceived themselves as having no problems with cleaning them. The main problems respondents reported on that affected their willingness to clean the shared toilet rooms included: the lack of cleaning materials or detergents (21.1 %), the feeling that nobody was responsi-ble for cleaning them (20.8 %) and the ever dirty state of the shared toilets (19.2 %). Only a third of the respondents (34.2 %) reported having no problem with the cleaning of the shared toilets. The determinants that were significantly associated with the cleanliness of the shared toilets are shown in Table3.
In the first step of the hierarchical linear regression, signif-icant factors with P <0.05 were; close family sharing a toilet (β =0.09), direct neighbours sharing a toilet (β =−0.09), shar-ing toilet with friends outside the neighbourhood (β =−0.18), all household members engaged in cleaning (β =0.38), paid cleaners doing the cleaning (β =0.25), all sharing households engaged in cleaning (β =0.46), landlord doing the cleaning (β =0.22) and the number of families sharing a toilet room (β =−0.24).
However, with the inclusion of behavioural factors into the model, significant factors associated with respondents’ per-ceived cleanliness of their shared toilets by order of impor-tance were; ease of keeping shared toilet clean (β =0.36), number of families sharing toilet room (β =−0.20), effortful to clean shared toilet (β =−0.12), perceived as liking to use a clean toilet (β =0.11), sharing toilet with a close family (β = 0.11), cleaning intention for shared toilet (β =0.10) and using a toilet with direct neighbours (β =−0.09). The negative beta values mean that the more the factor such as number of families sharing a toilet or effort to clean, the less likelihood the toilet was clean. On the other hand, positive beta values mean that the more for example respondents perceived it as easy to keep shared toilets clean or liked to use clean toilets, the more likelihood that the shared toilets were clean.
Discussion
According to the findings, the majority of the slum dwellers in Kampala use shared toilets that are not clean. Both study respondents and interviewers report that less than a quarter of the shared toilet rooms are very clean. The agreement between respondents and interviewers is high on shared toilets that are dirty but usable and with those considered clean
Table 1 Kappa agreement between respondents’ perceived and interviewers’ observed cleanliness of shared toilets in Kampala slums
Interviewers’ observed cleanliness Total
Respondents’ perceived cleanliness Very clean Clean enough to use Neither clean nor dirty Dirty but usable Not usable
Very clean 39 48 3 7 2 99
39.4 % 48.5 % 3.0 % 7.1 % 2.0 % 100.0 %
Clean enough to use 23 241 66 64 14 408
5.6 % 59.1 % 16.2 % 15.7 % 3.4 % 100.0 %
Neither clean nor dirty 4 48 100 47 2 201
2.0 % 23.9 % 49.8 % 23.4 % 1.0 % 100.0 %
Dirty but usable 1 11 22 134 7 175
0.6 % 6.3 % 12.6 % 76.6 % 4.0 % 100.0 %
Very dirty/not usable 0 0 1 6 4 11
0.0 % 0.0 % 9.1 % 54.5 % 36.4 % 100.0 %
Table1shows cross tabulation results of respondents’ perceived and interviewer observed cleanliness. N =924. Measure of agreement by Kappa static=0.41
Table 2 Main cleaners of shared toilets in Kampala slums
Variables Frequency Percentage
All household members 236 24.4
Paid cleaner 63 6.5
All sharing households 559 57.7
Landlord 110 11.4
Total 968 100.0
Table2is about respondents’ feedback on who cleans their shared toilets. N =968. 51 respondents whose responses were; ‘I do not know’ and ‘nobody cleans’ were excluded from this analysis
enough to use (Table1). However, variations exist between respondents and interviewers in regard to the actual cleanli-ness of the shared toilets. Respondents overestimated the perceived cleanliness (very clean and clean enough to use) of the shared toilets relative to the observations of the inter-viewers. On the other hand, respondents underestimated the facilities reported as dirty but usable, or very dirty and not usable. The dirty state of the shared toilets could be a reason why some slum dwellers resort to open defecation or to using polyethylene bags commonly referred to as ‘flying toilets’ (Tumwebaze et al.2012). A study on sanitation in Mumbai’s informal settlements reports that many women preferred using open spaces to using dirty toilets for their sanitation needs (McFarlane2008). The general gap in the cleanliness of the shared toilets in Kampala’s slums is comparable to most research findings conducted in similar settings that report on the dirty state of shared toilets (Grimason et al.2000; Bartlett
2003; Dana 2011). Using dirty toilets is as much a health threat as open defecation and inadequate personal hygiene. Although cleanliness is an important attribute for a toilet, as reported in many studies (Jenkins and Scott2007; Schouten and Mathenge2010; Tumwebaze et al.2012), most shared toilet users in Kampala’s slums and probably in most slums in other developing countries continue to use dirty toilets.
This study found that the management and cleaning re-sponsibility of shared toilets in Kampala’s slums rely largely on all user households. Out of every 10 household respon-dents, about 6 mentioned that all households sharing a toilet room were responsible for its cleaning (Table2). While in some slums, the users of the shared toilets pay for their cleaning and maintenance (Roma et al.2010), only 6.5 % of the respondents in the surveyed slums had their facilities cleaned by a caretaker. The factors influencing respondents’ perceived cleanliness of shared toilets can be seen in Table3. The ease or difficulty perceived by the shared toilet users about keeping the toilets clean positively related with their
perceived cleanliness. The easier respondents perceived the cleaning of the shared toilet rooms to be, the greater the likelihood was that it would actually be kept clean. In this study, perceived cleanliness (defined as a shared toilet room that is very clean or clean enough to use) was greatest in instances where respondents mentioned having no problem with cleaning their shared toilet. The ease at keeping a shared toilet clean could be attributed to the cooperation among the users to ensure proper use and maintenance of the toilet, as well as their inclination to participate in its cleaning when the need arises. In this study, a toilet was more likely to be reported clean if it was used by close family members. The difficulty in keeping a shared toilet clean might be related to the lack of cooperation and diminished feelings of mutual responsibility among households that use it. This study and other studies on slums found that the main reason why many tenants do not clean the shared toilet facilities is because they feel that the landlords should keep them clean because they pay rent (Wegelin-Schuringa and Kodo1997).
The number of families sharing a toilet room directly affected its level of cleanliness. The greater the number of households sharing a toilet room, the less the toilet was found to be clean. For both observed and perceived cleanliness, the toilet rooms shared by two households were three times clean-er than those shared among five or more households (Fig.1). This is comparable to findings from studies across different slum settings of most developing countries (Karn et al.2003; Bartlett2003; Gulyani and Talukdar2008). The deteriorating levels of cleanliness may be due to the fact that there are not enough toilet facilities for the ever-increasing population in slums (Swaminathan1995; Omambia2010; Dana2011). The lack of enough toilets is the reason why many families have to share them (Chaplin1999).
Another factor influencing respondents perceived cleanli-ness of the shared toilet was the perception of the effort involved to keep them clean. People reported that the more effortful it was to clean the shared toilet, the less likely they were to be cleaned. In this study, 7 out of every 10 household respondents reported that it was very effortful to clean a shared toilet. This explains the negative relationship of the beta value in the regression model (Table 3). Only 1 out of every 10 household respondents found it not effortful at all to clean a shared toilet.
Due to limited access to private toilets in urban slums (Katukiza et al.2010; Schouten and Mathenge 2010; Dana
2011; Tumwebaze et al.2012), most inhabitants share avail-able toilets with different families of varying relationships. This study found that most toilet rooms were being shared with direct neighbouring households (people living next door) and that there was a relationship between its perceived clean-liness and whether it was shared only with close family users, direct neighbours or with friends outside the neighbourhood. The reason why sharing a toilet with friends outside the
0 5 10 15 20 25 30 35 C l e a n l i n e s s ( %)
Number of households sharing toilet room Dirty
Neither clean nor dirty Clean
Fig. 1 Comparison of respondents’ perceived cleanliness with the num-ber of households sharing a toilet room (scale: 1=dirty to 3=clean). Notes: Figure shows that the less the number of households sharing a toilet room, the more likely it will be clean
neighbourhood is significant is because some slum dwellers have joint economic activities with each other. When these
economic activities, such as making brooms or brushes, are hosted by a given family, the group involved uses the toilet
Table 3 Linear regression on factors influencing respondents’ perceived cleanliness of shared toilets (scale: 1=very dirty/not usable to 5=very clean). SE standard error Variables Unstandardized coefficients Standardized Coefficients t Sig. Scale B SE Beta Step 1
(Constant) Relations among households sharing a toilet
3.138 0.190 16.504 0.000
Close family 0=No, 1=Yes 0.202 0.076 0.085 2.651 0.008
Extended family 0=No, 1=Yes 0.036 0.110 0.013 0.331 0.741
Direct neighbours 0=No, 1=Yes −0.198 0.085 −0.093 −2.319 0.021
Known neighbours 0=No, 1=Yes −0.037 0.096 −0.014 −0.383 0.702
Not known neighbours 0=No, 1=Yes −0.175 0.126 −0.048 −1.389 0.165
Friends outside neighbourhood 0=No, 1=Yes −0.538 0.110 −0.179 −4.877 0.000
Who mainly cleans shared toilets
All household members 0=No, 1=Yes 0.875 0.173 0.376 5.069 0.000
Paid cleaner 0=No, 1=Yes 0.994 0.198 0.252 5.014 0.000
All sharing households 0=No, 1=Yes 0.894 0.162 0.456 5.521 0.000
Landlord 0=No, 1=Yes 0.701 0.184 0.220 3.801 0.000
Number of families sharing toilet room Continuous (from 2 to 12 and above households)
−0.073 0.010 −0.242 −7.035 0.000
Step 2
(Constant) Relationship among toilet user households
2.281 0.618 3.690 0.000
Close family 0=No, 1=Yes 0.255 0.095 0.106 2.666 0.008
Direct neighbours 0=No, 1=Yes −0.181 0.088 −0.088 −2.048 0.041
Friends outside neighbourhood 0=No, 1=Yes −0.334 0.170 −0.106 −1.966 0.050
All household members 0=No, 1=Yes −0.320 0.484 −0.140 −0.661 0.509
Who mainly cleans shared toilets
Paid cleaner 0=No, 1=Yes 0.233 0.584 0.026 0.399 0.690
All sharing households 0=No, 1=Yes −0.055 0.478 −0.026 −0.115 0.908
Landlord 0=No, 1=Yes 0.021 0.516 0.004 0.040 0.968
Number of families sharing toilet room
Continuous (from 2 to 12 and above households)
−0.063 0.013 −0.197 −4.879 0.000
Behavioural factors
Cleaning habit 1=Not a habit at all to 5=Very strong habit 0.012 0.041 0.015 0.288 0.773
Cleaning intention 1=Not at all to 5=very strongly 0.122 0.060 0.101 2.056 0.040
Importance to use clean toilet 1=Very unimportant to 9=very important 0.055 0.037 0.062 1.461 0.145 Talking to other toilet users to maintain
cleanliness
1=almost never to 5=almost always −0.007 0.029 −0.010 −0.239 0.811 Like or dislike to use clean toilet 1=I dislike it very much to 9=I like it
very much
0.045 0.017 0.107 2.701 0.007
Effortful to clean shared toilet 1=Not effortful at all to 5=very effortful −0.090 0.030 −0.123 −2.964 0.003 Other users view of one leaving a toilet dirty 1=Very negatively to 9=very positively −0.016 0.020 −0.031 −0.782 0.434 Easy or difficulty to keep toilet clean 1=Very difficult to 9=very easy 0.126 0.015 0.363 8.598 0.000 Perceived disgust to use dirty toilet 1=Not at all to 5=very much 0.030 0.058 0.021 0.524 0.600 Table shows a two-step hierarchical linear regression of respondents’ perceived cleanliness of their shared toilets as the dependent variable. Level of significant is indicated by P <0.05. Beta (β) values show the weights of coefficients of the variables. The variance is indicated by R2. In the first step of the regression, non-behavioural factors are entered in the linear regression model; N =864, R2=0.15, adjusted R2=0.14. In the second step of the linear regression, behavioural factors are added. N =508, R2=0.32, Adjusted R2=0.29
accessible to the host household. Some studies report that the effect of how close the users of shared toilets are to each other can be a cause for difficulties in the sharing of responsibilities concerning their cleaning and maintenance (Okot-Okumu and Oosterveer2010; Isunju et al.2011). This could be due to a lack of social cohesion among users that would influence the feelings of responsible use and user households’ active en-gagement towards the management and cleaning of the shared toilets. A high degree of social or interpersonal relationships among users of shared toilets could be an important factor in promoting toilet hygiene (Goldman et al.2001).
Furthermore, respondents’ perceived cleanliness of shared toilets significantly impacted their cleaning intention. The more respondents intended to clean the shared toilets, the more their toilets were clean. Low cleaning intention among respondents may be influenced by: tenancy, the large number of sharing households, and a lack of concern among some sharing households. In the study done by Wegelin-Schuringa and Kodo (1997) on tenancy and sanitation provision in informal settlements in Nairobi, they found that tenants did not feel responsible for maintaining or keeping their shared toilets clean. They felt that landlords should be the responsible persons to clean or maintain their toilets since they pay them rent (Wegelin-Schuringa and Kodo1997).
Lastly, respondents’ perceived as liking to use a clean toilet had a significant influence on how they perceived the state of cleanliness of the shared toilets. In this study, about 6 of every 10 household respondents expressed a strong preference to use a clean toilet. These results are comparable to most sani-tation and hygiene studies on the perceived importance slum dwellers give concerning the use of clean toilets (Burra et al.
2003; McFarlane2008; Tumwebaze et al.2012).
Conclusion and recommendation
The findings in this study provide important insights into the conditions and cleanliness of shared toilets, the most accessi-ble toilets in urban slums of developing countries. Keeping shared toilets clean has ramifications for the sustainable de-velopment goals—as there is empirical evidence that other-wise people will resort to open defecation in urban settings. The majority of slum dwellers in Kampala who participated in this survey used toilets that were not clean enough to be considered safe from disease-exposing agents. While this study found that a toilet is likely to be kept clean if shared by fewer households such as four or less, it is necessary to conduct more evidence-based research. Important areas to further investigate are: the actual number of families who share a toilet room without compromising its cleanliness, and how to influence behaviour change and cooperation among the users of shared toilets in order to increase collective action in keeping them clean and their knowledge of proper
toilet use. These investigations can be best done through randomized controlled trials (Montgomery et al.2011).
Acknowledgements The author would like to acknowledge the support received from the Swiss National Centre of Competence in Research (NCCR) North–South: Research Partnerships for Mitigating Syndromes of Global Change, co-funded by the Swiss National Science Foundation (SNSF) and the Swiss Agency for Development and Cooperation (SDC), as well as the support of his PhD mentors; Prof. Dr. Hans-Joachim Mosler and Dr. Christoph Lüthi (The Swiss Federal Institute of Aquatic Science and Techonology) and Dr. Charles Niwagaba (Makerere University). Conflicts of interest There is no conflict of interest.
References
Bartlett S (2003) Water, sanitation and urban children: the need to go beyond“improved” provision. Environ Urban 15:57–70
Burra S, Patel S, Kerr T (2003) Community-designed, built and managed toilet blocks in Indian cities. Environ Urban 15:11–32
Chaplin SE (1999) Cities, sewers and poverty: India’s politics of sanita-tion. Environ Urban 11:145–158
Dana T (2011) Unhygienic living conditions and health problems: a study in selected slums of Dhaka City. OIDA Int J Sustain Dev 2:27–34 Goldman N, Pebley AR, Beckett M (2001) Diffusion of ideas about
personal hygiene and contamination in poor countries: evidence from Guatemala. Soc Sci Med 52:53–69
Grimason AM, Davison K, Tembo KC, Jabu GC, Jackson MH (2000) Problems associated with the use of pit latrines in Blantyre, Republic of Malawi. J R Soc Promot Heal 120:175–182
Gulyani S, Talukdar D (2008) Slum real estate: the low-quality high-price puzzle in Nairobi’s slum rental market and its implications for theory and practice. World Dev 36:1916–1937
Isunju JB, Schwartz K, Schouten MA, Johnson WP, Van Dijk WP (2011) Socio-economic aspects of improved sanitation in slums: a review. Public Health 125:368–376
Jenkins MW, Scott B (2007) Behavioral indicators of household decision-making and demand for sanitation and potential gains from social marketing in Ghana. Soc Sci Med 64:2427–2442
Karn SK, Shikura S, Harada H (2003) Living environment and health of urban poor: a study in Mumbai. Econ Polit Weekly 38:3575–3586 Katukiza AY, Ronteltap M, Oleja A, Niwagaba CB, Kansiime F, Lens
PNL (2010) Selection of sustainable sanitation technologies for urban slums: a case of Bwaise III in Kampala, Uganda. Sci Total Environ 409:52–62
Katukiza AY, Ronteltap M, Niwagaba CB, Foppen JWA, Kansiime F, Lens PNL (2012) Sustainable sanitation technology options for urban slums. Biotechnol Adv 30:964–978
Mcfarlane C (2008) Sanitation in Mumbai’s informal settlements: state, ‘slum’ and infrastructure. Environ Planning A 40:88–107 Montgomery MA, Desai MM, Groce NE, Elimelech M (2011)
Relation-ship between distance to social gathering facilities and risk of trachoma for households in rural Tanzanian communities. Soc Sci Med 73:1–5
Munoz SR, Bangdiwala SI (1997) Interpretation of Kappa and B statistics measures of agreement. J Appl Stat 24:105–112
Okot-Okumu J, Oosterveer P (2010) Providing sanitation for the urban poor in Uganda. In: Vliet BV, Spaargaren G, Oosterveer P (eds) Social perspectives on the sanitation challenge. Springer, New York Omambia AN (2010) Sanitation in urban slums: perception, attitude and behavior—the case of Kibera, Nairobi-Kenya. J Environ Sci Eng 4: 74–84
Roma E, Buckley C, Jefferson B, Jeffrey P (2010) Assessing users’ experience of shared sanitation facilities: a case study of community ablution blocks in Durban, South Africa. Wa-ter SA 36:1–6
Schouten MAC, Mathenge RW (2010) Communal sanitation alternatives for slums: a case study of Kibera, Kenya. Phys Chem Earth, Parts A/ B/C 35:815–822
Swaminathan M (1995) Aspects of urban poverty in Bombay. Environ Urban 7:133–144
Tumwebaze IK, Orach CG, Niwagaba C, Luthi C, Mosler HJ (2012) Sanitation facilities in Kampala slums, Uganda: users’ satisfaction and determinant factors. Int J Environ Heal R 1–14
Unicef/WHO (2012) Progress on drinking water and sanitation: 2012 update. United Nations Children’s Fund and World Health Organi-sation, New York and Geneva
Wegelin-Schuringa M, Kodo T (1997) Tenancy and sanitation provision in informal settlements in Nairobi: revisiting the public latrine option. Environ Urban 9:181–190