HAL Id: hal-00299167
https://hal.archives-ouvertes.fr/hal-00299167
Submitted on 4 Mar 2005
HAL is a multi-disciplinary open access
archive for the deposit and dissemination of
sci-entific research documents, whether they are
pub-lished or not. The documents may come from
teaching and research institutions in France or
abroad, or from public or private research centers.
L’archive ouverte pluridisciplinaire HAL, est
destinée au dépôt et à la diffusion de documents
scientifiques de niveau recherche, publiés ou non,
émanant des établissements d’enseignement et de
recherche français ou étrangers, des laboratoires
publics ou privés.
A preliminary investigation of radar rainfall estimation
in the Ardennes region and a first hydrological
application for the Ourthe catchment
A. Berne, M. ten Heggeler, R. Uijlenhoet, L. Delobbe, Ph. Dierickx, M. de
Wit
To cite this version:
A. Berne, M. ten Heggeler, R. Uijlenhoet, L. Delobbe, Ph. Dierickx, et al.. A preliminary investigation
of radar rainfall estimation in the Ardennes region and a first hydrological application for the Ourthe
catchment. Natural Hazards and Earth System Science, Copernicus Publications on behalf of the
European Geosciences Union, 2005, 5 (2), pp.267-274. �hal-00299167�
European Geosciences Union
© 2005 Author(s). This work is licensed under a Creative Commons License.
and Earth
System Sciences
A preliminary investigation of radar rainfall estimation in the
Ardennes region and a first hydrological application for the
Ourthe catchment
A. Berne1, M. ten Heggeler1, R. Uijlenhoet1, L. Delobbe2, Ph. Dierickx3, and M. de Wit4
1Wageningen University, Environmental Sciences Group, Chair of Hydrology and Quantitative Water Management, The
Netherlands
2Royal Meteorological Institute, Brussels, Belgium
3Minist`ere de l’ ´Equipement et des Transports, Service d’ ´Etudes Hydrologiques, Namur, Belgium
4Ministry of Transport, Public Works and Water Management, Institute for Inland Water Management and Waste Water
Treatment (RIZA), Arnhem, The Netherlands
Received: 12 October 2004 – Revised: 20 January 2005 – Accepted: 2 February 2005 – Published: 4 March 2005
Abstract. This paper presents a first assessment of the hy-drometeorological potential of a C-band doppler weather radar recently installed by the Royal Meteorological Insti-tute of Belgium near the village of Wideumont in the south-ern Ardennes region. An analysis of the vertical profile of reflectivity for two contrasting rainfall events confirms the expected differences between stratiform and convective pre-cipitation. The mean areal rainfall over the Ourthe catchment upstream of Tabreux estimated from the Wideumont weather radar using the standard Marshall-Palmer reflectivity-rain rate relation shows biases between +128% and −42% for six selected precipitation events. For two rainfall events the radar-estimated mean areal rainfall is applied to the gauge-calibrated (lumped) HBV-model for the Ourthe upstream of Tabreux, resulting in a significant underestimation with re-spect to the observed discharge for one event and a closer match for another. A bootstrap analysis using the radar data reveals that the uncertainty in the hourly discharge from the ∼1600 km2catchment associated with the sampling un-certainty of the mean areal rainfall estimated from 10 rain gauges evenly spread over the catchment amounts to ±25% for the two events analyzed. This uncertainty is shown to be of the same order of magnitude as that associated with the model variables describing the initial state of the model.
1 Introduction
The Ardennes, an undulating area of moderate relief (max-imum elevation ∼700 m), is an important natural laboratory to study the hydrometeorology of mountainous catchments.
Correspondence to: R. Uijlenhoet
The western part of the Ardennes (France, Belgium, Nether-lands) mainly drains to the river Meuse, whereas the east-ern part of the region (Luxemburg, Germany) mainly drains to the river Rhine (via the Mosel). Both the Meuse (e.g. Berger, 1992) and the Rhine (e.g. Kwadijk, 1993) fulfill im-portant functions in the water supply of The Netherlands. These rivers supply water for domestic, industrial and agri-cultural use and also fulfill important navigational, ecological and recreational functions. It is therefore of significant soci-etal relevance to develop strategies to mitigate the impact of floods and droughts associated with the discharge regimes of the rivers Meuse and Rhine. To achieve this objective, the hydrometeorology of the (mostly mountainous) upstream ar-eas, such as the Ardennes, needs to be better understood.
Hydrologists have traditionally paid much more atten-tion to the development of more sophisticated rainfall-runoff modeling approaches than to the development of improved techniques for the measurement and prediction of the space-time variability of precipitation. This is to be deplored, since rainfall is the driving source of water behind most terrestrial hydrological processes. All previous hydrologi-cal modeling efforts in the Ardennes have relied on lumped or (semi-)distributed rainfall-runoff models with conceptual representations of the relevant hydrological processes (in-filtration, surface runoff, changes in soil moisture storage, groundwater recharge, etc.) in combination with rainfall input obtained from networks of raingauges (e.g. Velner, 2000; Groot Zwaaftink, 2003). The aim of a recently es-tablished research collaboration between Wageningen Uni-versity (WU), the Royal Meteorological Institute of Belgium (RMI) and the Hydrological Service of the Walloon Region of Belgium (MET-SETHY) is to investigate whether an im-proved assessment of the space-time structure of precipita-tion, as can be obtained with a newly installed weather radar
268 A. Berne et al.: A preliminary investigation of radar rainfall estimation
Table 1. Some characteristics of the Wideumont weather radar.
Property Value
Location Wideumont, Luxembourg Province, Walloon Region, Belgium Operational since October 2001
Type of radar Gematronik pulse doppler Frequency/wavelength C-band (5.64 GHz/5.32 cm) Mean transmit power 250 W
Height of tower base 535 m Height of tower 50 m Height of antenna 585 m Antenna diameter 4.2 m Radome diameter 6.7 m
Elevations 0.5◦, 1.2◦, 1.9◦, 2.6◦, 3.3◦, 4.0◦, 4.9◦, 6.5◦, 9.4◦, 17.5◦ Maximum range reflectivity processing 240 km
Maximum range doppler processing 120 km Typical range resolution 0.5 km Time interval precipitation products∗ 5 min. Time interval volume reflectivity scans 15 min. Time interval doppler scans 15 min.
∗The Wideumont radar performs a 5-elevation scan every 5 min, from which the precipitation products are derived. The doppler and full volume scans are performed alternatively every 15 min.
17
Figure 1. Location of the RMI C-band doppler weather radar in the southern Ardennes. The
circles represent 80 and 240 km range markers. The area of interest (Ourthe catchment
upstream of Tabreux, see Fig. 4) is located entirely inside the inner circle (source: RMI).
Fig. 1. Location of the RMI C-band doppler weather radar in the southern Ardennes. The circles represent 80 and 240 km range markers. The area of interest (Ourthe catchment upstream of Tabreux, see Fig. 4) is located entirely inside the inner circle (source: RMI).
in the Ardennes (RMI, 2001), in combination with an innova-tive approach towards modeling the rainfall-runoff process, will lead to an improved understanding of the hydrometeo-rology of Ardennes catchments.
An improved knowledge of the hydrometeorology of the mountainous Ardennes catchments will ultimately lead to improved real-time flood forecasts, in particular for the rivers Meuse and Mosel (hence the Rhine). It is also relevant for achieving improved process representations (and therefore improved assimilation) of land surface hydrology in numeri-cal weather prediction models and climate models (e.g. Van den Hurk et al., 2001). Global climate change may affect the hydrological behavior of rivers and streams and conse-quently the availability of water for a variety of purposes, as identified above (Brandsma, 1995). The possible impacts of global climatic change on the discharge regime of the river systems of the Meuse and the Rhine have been studied ex-tensively during recent years (Kwadijk, 1993; Pfister et al., 2000; W´ojcik and Buishand, 2003; Uijlenhoet et al., 2001; De Wit et al., 2001). However, all of these studies have been based on simplified representations of the space-time precip-itation fields as obtained from networks of raingauges and conceptual representations of the relevant hydrological pro-cesses where individual catchments are subdivided into ar-bitrary grid squares. This paper presents a first assessment of the hydrometeorological potential of a recently installed weather radar in the Ardennes.
2 The RMI weather radar near Wideumont
The Royal Meteorological Institute of Belgium (RMI) re-cently installed a new Gematronik C-band doppler weather radar near the village of Wideumont (535 m), in the south-ern Ardennes (Province of Luxembourg), close to the border with the Grand Duchy of Luxembourg (RMI, 2001). This is in fact the first and only weather radar covering nearly the
18
Figure 2. Height (km) of the radar beam axis above mean sea level as a function of range from the radar (km) for each of the 10 elevation angles of the Wideumont weather radar volume reflectivity scan (assuming normal propagation through a standard atmosphere).
Fig. 2. Height (km) of the radar beam axis above mean sea level
as a function of range from the radar (km) for each of the 10 eleva-tion angles of the Wideumont weather radar volume reflectivity scan (assuming normal propagation through a standard atmosphere).
entire Ardennes area and at the same time the first weather radar owned and operated by the RMI. The mean transmit power of the radar amounts 250 W, it has a 4.2 m diameter parabolic antenna (covered by a radome) and is installed on a 50 m high tower. The radar performs every 15 min. a 10-elevation volume scan of the 3D structure of the rainfall field out to a distance of 240 km and similarly a doppler scan to a range of 120 km. Figure 1 shows the location and cover-age of the weather radar and Table 1 provides some relevant characteristics.
Figure 2 shows the dependence of the height of the radar beam axis as a function of the distance from the radar (“range”) for each of the 10 elevation angles which consti-tute a complete volume reflectivity scan of the Wideumont weather radar (0.5◦, 1.2◦, 1.9◦, 2.6◦, 3.3◦, 4.0◦, 4.9◦, 6.5◦, 9.4◦, and 17.5◦, respectively). The exact dependence is deter-mined both by the curvature of the earth and by the amount of refraction the radar beam is experiencing. Figure 2 is based on the assumption of normal propagation through a standard atmosphere. It is our ambition to employ and expand exist-ing methods for the processexist-ing of radar data (e.g. Sanchez-Diezma et al., 2001) and apply it to the volume scan reflec-tivity data from the new weather radar. This will lead to an operational correction procedure for known error sources rel-evant to radar rainfall estimation, such as the adverse effects of attenuation, the vertical profile of reflectivity and ground clutter (Andrieu et al., 1997; Creutin et al., 1997).
Due to the moderate rainfall intensities which are to be ex-pected in this region from a climatological perspective, atten-uation of the radar signal due to rainfall present on the path between the radar antenna and the region of interest is likely going to be less of a problem than for instance in Mediter-ranean areas (e.g. Corral et al., 2000). On the other hand, operational C-band weather radars such as the Wideumont radar are known to be prone to attenuation even at moder-ate rain rmoder-ates (as compared to S-band radars which are
vir-19
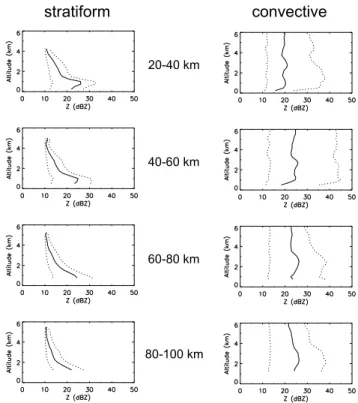
Figure 3. Mean vertical reflectivity profiles (bold lines) and 20%-80% quantiles (dashed lines) for four different 20 km range intervals at increasing distances from the Wideumont weather radar. Left panel: typical stratiform event (1 March 2003). Right panel: typical convective event (19 August 2002).
stratiform convective
20-40 km
40-60 km
60-80 km
80-100 km
Fig. 3. Mean vertical reflectivity profiles (bold lines) and 20%–
80% quantiles (dashed lines) for four different 20 km range intervals at increasing distances from the Wideumont weather radar. Left panel: typical stratiform event (1 March 2003). Right panel: typical convective event (19 August 2002).
tually insensitive to rain-induced attenuation). In addition, the attenuation caused by rain water present on the radome (the protective dome covering the radar antenna) during and shortly after rainfall events has been shown to pose a serious problem (e.g. Germann, 1999). Therefore, the development of accurate and robust attenuation correction procedures is still the topic of ongoing research. Berne and Uijlenhoet (2004) present a theoretical study to quantify the effects of attenuation on radar-rainfall estimation and to assess the per-formance of different attenuation compensation schemes in a stochastic framework.
The significant height of the radar antenna (close to 600 m) is also expected to produce appreciable bright band effects, particularly in the winter half year, which makes a correction for the vertical profile of reflectivity of prime importance (see Sect. 3.1). Similarly, in mountainous areas such as the Ar-dennes, ground clutter as a result of interception of the radar beam by surrounding relief will generally be a major con-cern, even though the Wideumont radar is located on one of the highest hills in the region. Procedures to correct for these error sources exist in principle and have shown their effec-tiveness in other areas (southern France, Catalunya). It will be a challenge to investigate their reliability in the Ardennes. Ultimately, application of these correction procedures to the data collected with the new weather radar will lead to reliable maps of the spatially varying rainfall field at a 1 km resolu-tion and a 5 min time step.
270 A. Berne et al.: A preliminary investigation of radar rainfall estimation
Table 2. Characteristic precipitation events selected by the RMI, the corresponding total mean areal rainfall accumulations over the Ourthe
catchment upstream of Tabreux as derived from radar and raingauges, and the resulting bias of the radar rainfall estimates with respect to the gauge estimates (note that on 30 July 2002 the radar stopped functioning at 19:20 UTC, when most thunderstorms had passed but it was still raining over the Ourthe catchment).
Date Type of event Radar (mm) Gauges (mm) Bias (%) 4 May 2002 convective 19.1 32.7 −42 30 July 2002 convective 10.2 9.8 +4 19 August 2002 convective 7.3 3.2 +128 24 November 2002 stratiform 9.1 7.6 +20 30 January 2003 stratiform 4.2 2.4 +75 1 March 2003 stratiform 9.1 10.3 −12 20
Figure 4. Ourthe catchment upstream of Tabreux (1597 km2) with the location of the 10
MET-SETHY rain gauges and the Wideumont radar (∆). The black circles indicate the distance to the radar, with an increment of 20 km.
Tabreux
Fig. 4. Ourthe catchment upstream of Tabreux (1597 km2) with the location of the 10 MET-SETHY rain gauges and the Wideumont radar (1). The black circles indicate the distance to the radar, with an increment of 20 km.
3 Results and discussion
3.1 Analysis of the vertical structure of precipitation
The first radar data set that was analyzed in the framework of the collaboration between WU and RMI consisted of vol-ume scan radar reflectivity data for a selection of six trasting precipitation events (Table 2) which the RMI con-sidered characteristic for the first two years since the Wideu-mont weather radar became operational (2001–2003). The employed volume scans consist of 10 elevations and were collected every 15 min (Table 1). Figure 3 presents an anal-ysis of those data in terms of the range dependence of the so-called vertical profile of reflectivity (VPR), an important source of error when it comes to radar-rainfall estimation (Andrieu et al., 1997; Creutin et al., 1997). The figure shows that, as would be expected, events which can be defined as “stratiform” (such as 1 March 2003) are characterized by ver-tical profiles of reflectivity with a pronounced maximum just below the zero degree isotherm (the so-called radar bright
band), which seems to gradually disappear at longer ranges due to the increased height and averaging volume of the radar at those ranges (see Fig. 2). The bright band is caused by an increased reflectivity from relatively large melting precipita-tion particles with a frozen interior and a liquid exterior. The “convective” events (such as 19 August 2002) do not display such a feature and exhibit much more uniform vertical reflec-tivity profiles. The smoothing of the profiles at longer ranges and the loss of information at low elevations remain appar-ent, however. This demonstrates the importance of accurate and robust VPR correction procedures for radar rainfall esti-mation, particularly at longer ranges.
Figure 3 shows both the mean vertical reflectivity pro-files and the 20% and 80% quantiles for 4 different 20 km range intervals at increasing distances from the Wideumont weather radar. The quantiles provide a measure of the spa-tial and temporal variability of the retrieved vertical pro-files. Clearly, the variability associated with the convective event is much stronger than that associated with the strati-form event. This confirms the well-established fact that strat-iform precipitation is characterized by a pronounced variabil-ity in the vertical direction and a more homogeneous appear-ance in the horizontal direction (i.e. a stratified or layered structure), whereas the opposite is true for convective pre-cipitation. These properties also form the basis of stratiform-convective separation techniques that have been proposed in the literature (e.g. Steiner et al., 1995; Sanchez-Diezma et al., 2000). Further research on this topic will ultimately con-tribute to the development of an operational VPR identifica-tion and correcidentifica-tion algorithm, which has a high priority for the RMI. The smoothing of the profiles at longer ranges and the loss of information at low elevations mentioned earlier show that it will be a particular challenge to develop accu-rate and robust “local” VPR correction procedures based on volume reflectivity scan data from the Wideumont weather radar.
3.2 Hydrological application of radar rainfall estimates for the Ourthe basin
To perform a first assessment of the hydrological potential of the Wideumont weather radar, the Ourthe catchment
up-21 0 50 100 150 200 250 300 350 01/04/02 01/05/02 01/06/02 01/07/02 01/08/02 01/09/02 01/10/02 01/11/02 01/12/02 01/01/03 01/02/03 01/03/03 01/04/03 01/05/03 Time (months) D isch a rge ( m 3/ s)
Figure 5. Daily averaged discharge from the upper Ourthe catchment at Tabreux for the period April 2002-May 2003. The vertical lines indicate the periods 4-10 May 2002 (left) and 1-7 March 2003 (right), which have been analyzed as part of the research project presented in this paper (source: MET-SETHY).
Time (months)
Discharge (m
3 s -1)
Fig. 5. Daily averaged discharge from the upper Ourthe catchment
at Tabreux for the period April 2002–May 2003. The vertical lines indicate the periods 4–10 May 2002 (left) and 1–7 March 2003 (right), which have been analyzed as part of the research project presented in this paper (source: MET-SETHY).
stream of Tabreux was selected as study area. Figure 4 shows the topography of the 1597 km2catchment with the location of the 10 MET-SETHY rain gauges covering the area. Be-cause the radar is located near the highest part of the catch-ment, radar beam blocking by the relief is limited. From the six events for which radar data were provided by the RMI, two were selected for their hydrological significance, namely the rainfall-runoff events of 4–10 May 2002 and 1–7 March 2003. It should be noted that both events are minor with re-spect to the flood peaks that occurred during the 2002–2003 winter season (Fig. 5), which will be studied as part of a fu-ture collaborative research project. MET-SETHY kindly pro-vided hourly raingauge and discharge data for the Ourthe at Tabreux for these events. For the hydrological simulations the model (Lindstr¨om et al., 1997) was used. An HBV-schematization for the Ourthe catchment has been calibrated (1969–1984) and validated (1985–1998) in a previous study by Groot Zwaaftink (2003).
The determination of the initial state of the model, i.e. the contents of the moisture reservoirs (Fig. 6) at the start of a simulation, is always a difficult issue when it comes to run-ning a hydrological model on an event basis. The 30-year (1968–1998) HBV model run derived from Groot Zwaaftink (2003) was employed to choose “optimal” initial conditions for both selected events by searching in the database for anal-ogous hydrographs during the month preceding the discharge events, employing the Nash-Sutcliffe parameter as an error criterion (Ten Heggeler, 2004).
3.2.1 Comparison of radar estimates with rain gauge mea-surements
The mean areal rainfall estimated from the second eleva-tion of the Wideumont weather radar volume scan reflectivity data using the standard Marshall-Palmer reflectivity-rain rate relation (without adjustment to rain gauges) showed a 42% underestimation with respect to the gauge average rainfall
22
Figure 6. The structure of the precipitation runoff model HBV (Lindström et al., 1997). Four reservoirs can be identified, the precipitation reservoir (SP), the soil moisture reservoir (SM), the fast runoff reservoir (UZ), and the base flow reservoir (LZ), respectively. The transformation routine transforms the fast runoff and base flow into the total runoff.
Fig. 6. The structure of the precipitation runoff model HBV
(Lind-str¨om et al., 1997). Four reservoirs can be identified, the precipita-tion reservoir (SP), the soil moisture reservoir (SM), the fast runoff reservoir (UZ), and the base flow reservoir (LZ), respectively. The transformation routine transforms the fast runoff and base flow into the total runoff.
23 0 10 20 30 40 50 60 70 0 24 48 72 96 120 144 Time (h) D ischarg e (m3/s)
Figure 7. Observed hourly discharge (solid line) at Tabreux for the period 4-10 May 2002 (source: MET-SETHY) and calculated discharge using the (lumped) HBV-model based on mean areal rainfall from rain gauge measurements (dashed line) and uncorrected radar measurements (dotted line).
Time (h) Discharg e (m 3 s -1)
Fig. 7. Observed hourly discharge (solid line) at Tabreux for the
period 4–10 May 2002 (source: MET-SETHY) and calculated dis-charge using the (lumped) HBV-model based on mean areal rainfall from rain gauge measurements (dashed line) and uncorrected radar measurements (dotted line).
for 4–5 May 2002 and a 12% underestimation for 1 March 2003 (the stratiform event of Fig. 3). Table 2 lists the biases associated with the other four selected precipitation events as well. The second rather than the first elevation was employed to minimize the possible adverse effects of ground clutter. It is the subject of ongoing research whether the underestima-tion for 4–5 May 2002 may be attributed to an erroneous reflectivity-rain rate relation and/or to rain-induced attenua-tion.
3.2.2 Hydrological application
Although the temporal dynamics is correctly reproduced, the application of the radar-estimated mean areal rainfall to the gauge-calibrated HBV-model for the Ourthe upstream of
272 A. Berne et al.: A preliminary investigation of radar rainfall estimation
Table 3. Mean values of the ratio between the 20% and 80%
quan-tiles and the “true” mean areal rainfall (R20/<R>and R80/<R>)
for the two studied events.
R20/<R> R80/<R>
4–5 May 2002 0.66 1.31 1 March 2003 0.76 1.22
24
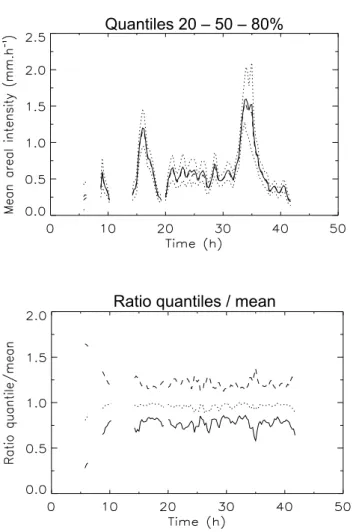
Figure 8. Top panel: 20% (dotted line), 50% (bold line), and 80% (dotted line) quantiles of the mean areal rainfall for 4-5 May 2002 obtained from 1000 bootstrap samples of 10 radar pixels (“rain gauges”) sampled at random (without replication) from ~1600 pixels, indicating a nearly symmetrical sampling distribution of the mean areal rainfall. Bottom panel: Nearly constant ratio of the 20% (dashed line), 50% (dotted line), and 80% quantiles (solid line) to the “true” mean areal rainfall estimated from all radar pixels.
Quantiles 20 – 50 – 80%
Ratio quantiles / mean
Fig. 8. Top panel: 20% (dotted line), 50% (bold line), and 80%
(dotted line) quantiles of the mean areal rainfall for 4–5 May 2002 obtained from 1000 bootstrap samples of 10 radar pixels (“rain gauges”) sampled at random (without replication) from ∼1600 pix-els, indicating a nearly symmetrical sampling distribution of the mean areal rainfall. Bottom panel: Nearly constant ratio of the 20% (dashed line), 50% (dotted line), and 80% quantiles (solid line) to the “true” mean areal rainfall estimated from all radar pixels.
Tabreux obviously produced an underestimation of the pre-dicted with respect to the measured discharge for the event of 4–10 May 2002 (Fig. 7). The uncertainty affecting the quantitative radar rainfall estimates can have a significant im-pact on rainfall runoff modelling (e.g. Borga, 2002). A simi-lar analysis for 1–7 March 2003 was impossible because the available radar data covered only one day.
25 0 10 20 30 40 50 60 70 0 24 48 72 96 120 144 Time (h) Dis c harge (m3/s)
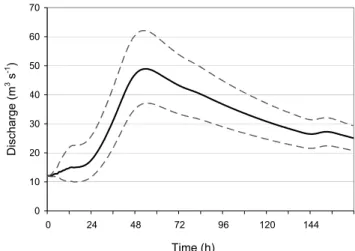
Figure 9. Uncertainty in the discharge at Tabreux for the period 4-10 May 2002 calculated using the (lumped) HBV-model due to uncertainty in the mean areal rainfall. The solid line indicates the discharge calculated using the mean areal rainfall from the 10 rain gauges (corresponding to the dashed line in Fig. 7), the dashed lines correspond to the discharges calculated using the 20% and 80% uncertainty limits (Fig. 8) on the mean areal gauge-derived rainfall over the 1597 km2 catchment area (Fig. 4).
Time (h)
Discharge (m
3 s -1)
Fig. 9. Uncertainty in the discharge at Tabreux for the period 4–10
May 2002 calculated using the (lumped) HBV-model due to un-certainty in the mean areal rainfall. The solid line indicates the discharge calculated using the mean areal rainfall from the 10 rain gauges (corresponding to the dashed line in Fig. 7), the dashed lines correspond to the discharges calculated using the 20% and 80% un-certainty limits (Fig. 8) on the mean areal gauge-derived rainfall over the 1597 km2catchment area (Fig. 4).
3.2.3 Quantification of the rain gauge network sampling er-ror
Recall that HBV is a lumped rainfall-runoff model, in prin-ciple not ideal to assess the hydrological impact of spa-tial rainfall variability. Nevertheless, in this limited set-ting there is still an interesset-ting application of the power of weather radar, namely its spatial coverage. Approximately 1600 1 km×1 km radar pixels cover the Ourthe basin up-stream of Tabreux. Choosing a similar approach as Bradley et al. (2002), one can assume, in a Monte Carlo simulation framework, the radar data to represent the actual rainfall field (1600 “rain gauges”) from which a “true” areal average rain-fall can be calculated. Also, one can randomly pick (without replication) 10 “gauges” from the 1600 pixels and compute the arithmetic mean of those 10 numbers (obviously, more sophisticated geostatistical interpolation techniques such as Kriging could also be employed to compute this areal av-erage rainfall). This random drawing can be repeated say 1000 times to assess (in a very simple fashion since gauge locations are chosen independently without imposing for in-stance a minimum inter-gauge diin-stance) the uncertainty in estimating the areal average rainfall over a 1600 km2 catch-ment from only 10 hourly gauge observations.
To quantify the sampling error affecting the mean areal rainfall derived from the rain gauge network, the 20%, 50% and 80% quantiles have been determined (see Fig. 8 for an example). In order to associate an uncertainty to the esti-mated mean areal rainfall, we also calculated the ratios be-tween the quantiles and the “true” mean areal rainfall. These ratios remain remarkably constant as illustrated in Fig. 8 for 4–5 May 2002. Moreover, they are similar for the two stud-ied events (see Table 3).
26 20 30 40 50 60 70 80 90 0 24 48 72 96 120 144 Time (h) Discharge (m3/s)
Figure 10. Same as Fig. 9, but for the period 1-7 March 2003.
Time (h)
Discharge (m
3 s -1)
Fig. 10. Same as Fig. 9, but for the period 1-7 March 2003.
The 30-year (1968–1998) HBV run enables us to estimate the standard deviation of the contents of the four model reser-voirs (Fig. 6) for every day of the year (Ten Heggeler, 2004). We assume that this standard deviation provides an estimate of the order of magnitude of the uncertainty associated with the initial conditions. It turns out that the hydrological un-certainty associated with the rainfall sampling unun-certainty (±25% on an hourly basis for the two events presented, see Figs. 9–10) is of the same order of magnitude as the uncer-tainty associated with the initial conditions. As an illustra-tion, the sensitivity of the simulated discharge at Tabreux due to an uncertainty of ±5 mm in the initial content of the fast runoff reservoir (UZ in Fig. 6) is shown in Fig. 11 for the period of 4–10 May 2002 and Fig. 12 for the period of 1–7 March 2003.
4 Conclusions and recommendations
The conclusions of this preliminary investigation can be sum-marized as follows:
– An analysis of the vertical profile of reflectivity for two contrasting rainfall events shows that the strati-form event is characterized by a pronounced maximum just below the zero degree isotherm (the radar “bright band”), wheras the convective event exhibits much more uniform vertical reflectivity profiles. Also, the spatial and temporal variability of the vertical profiles associ-ated with the convective event is much stronger than that associated with the stratiform event.
– An analysis of the apparent vertical reflectivity struc-ture as a function of the distance from the radar (range) shows a smoothing of the profiles at longer ranges and a loss of information at low elevations, which will have an adverse effect on radar-rainfall estimates if left un-corrected.
– The mean areal rainfall over the ∼1600 km2 Ourthe catchment upstream of Tabreux estimated from the
27 0 10 20 30 40 50 60 70 0 24 48 72 96 120 144 Time (hours) Ca lcu lat ed di sch arg e ( m 3 /s )
Figure 11. Sensitivity of the simulated discharge at Tabreux for the period 4-10 May 2002 due to an uncertainty of ±5 mm in the initial content of the fast runoff reservoir of the HBV model. The solid line indicates the discharge calculated using the mean areal rainfall from the 10 rain gauges (identical to the black line in Fig. 9), the dashed lines correspond to the discharges calculated using a 5 mm increase and a 5 mm decrease in the initial content of the fast runoff reservoir (UZ in Fig. 6).
Discharge (m
3 s -1)
Time (h)
Fig. 11. Sensitivity of the simulated discharge at Tabreux for the
period 4–10 May 2002 due to an uncertainty of ±5 mm in the initial content of the fast runoff reservoir of the HBV model. The solid line indicates the discharge calculated using the mean areal rainfall from the 10 rain gauges (identical to the black line in Fig. 9), the dashed lines correspond to the discharges calculated using a 5 mm increase and a 5 mm decrease in the initial content of the fast runoff reservoir (UZ in Fig. 6).
28 10 20 30 40 50 60 70 80 0 24 48 72 96 120 144 Time (hours) Ca lc ul at ed discharge (m3/ s)
Figure 12. Same as Fig. 11, but for the period 1-7 March 2003.
Discharge (m
3 s -1)
Time (h)
Fig. 12. Same as Fig. 11, but for the period 1–7 March 2003.
Wideumont weather radar using the standard Marshall-Palmer reflectivity-rain rate relation (without adjust-ment to rain gauges) shows biases between +128% and
−42% with respect to the corresponding gauge esti-mates for six selected precipitation events. For two rain-fall events the radar-estimated mean areal rainrain-fall is ap-plied to the gauge-calibrated (lumped) HBV-model for the Ourthe upstream of Tabreux, resulting in a signifi-cant underestimation with respect to the observed dis-charge for one event and a closer match for another.
– The uncertainty in the hourly discharge from the
∼1600 km2Ourthe catchment upstream of Tabreux as-sociated with the sampling uncertainty of the mean areal rainfall estimated from 10 rain gauges evenly spread over the catchment amounts to ±25% for the two events
274 A. Berne et al.: A preliminary investigation of radar rainfall estimation
analyzed. This uncertainty is of the same order of mag-nitude as that associated with the initial conditions.
The development of accurate and robust procedures for cor-recting for rain-induced attenuation and the vertical profile of reflectivity is the topic of ongoing investigations. It is envis-aged that the major floods which occurred during the 2002– 2003 winter season (Fig. 5) will be studied as part of a future collaborative research project. We also foresee a comparison of HBV with runoff estimates from the Hydromax river flow forecasting model, which is currently used operationally at MET-SETHY (see http://www.auto.ucl.ac.be/hydromax/).
Acknowledgements. The first author acknowledges financial
support from the European Commission through a Marie Curie Postdoctoral Fellowship (Contract EVK1-CT-2002-50016). The third author acknowledges financial support from the Nether-lands Organization for Scientific Research (NWO) through a Vernieuwingsimpuls/VIDI grant (Project 016.021.003). The collaboration between WU, RMI and MET-SETHY is sup-ported by the European Commission as part of Integrated Project FLOODsite (Contract GOCE-CT-2004-505420, see also http://www.floodsite.net/). Finally, we thank M. Borga for his constructive comments.
Edited by: F. Castelli Reviewed by: M. Borga
References
Andrieu, H., Creutin, J.-D., Delrieu, G., and Faure, D.: Use of a weather radar for the hydrology of a mountainous area, Part I: Radar measurement interpretation, J. Hydrol., 193, 1–25, 1997. Berger, H. E. J.: Flow Forecasting for the River Meuse, PhD
The-sis, Faculty of Civil Engineering, Delft University of Technology, The Netherlands, 1992.
Berne, A. and Uijlenhoet, R.: Analysis of the influence of the stochastic variability of the raindrop size distribution on radar attenuation correction, Proc. ERAD, 341–346, 2004.
Borga, M.: Accuracy of radar rainfall estimates for streamflow sim-ulation, J. Hydrol., 267, 26–39, 2002.
Bradley, A. A., Peters-Lidard, C., Nelson, B. R., Smith, J. A., and Young, C. B.: Raingage network design using NEXRAD precip-itation estimates, J. Amer. Water Resour. As, 38, 5, 1393–1407, 2002.
Brandsma, T.: Hydrological Impact of Climate Change, PhD The-sis, Faculty of Civil Engineering, Delft University of Technology, The Netherlands, 1995.
Corral, C., Sempere-Torres, D., Revilla, M., and Berenguer, M.: A semi-distributed hydrological model using rainfall estimates by radar, Application to a Mediterranean basin, Phys. Chem. Earth, 25, 1133–1136, 2000.
Creutin, J.-D., Andrieu, H., and Faure, D.: Use of a weather radar for the hydrology of a mountainous area, Part II: Radar measure-ment interpretation, J. Hydrol., 193, 26–44, 1997.
De Wit, M. J. M., Warmerdam, P. M. M., Torfs, P. J. J. F., Uijlen-hoet, R., Roulin, E., Cheymol, A., Van Deursen, W. P. A., Van Walsum, P. E. V., Ververs, M., Kwadijk, J. C. J., and Buiteveld, H.: Effect of Climate Change on the Hydrology of the River Meuse, Report 104, Hydrology and Quantitative Water
Manage-ment Group, DepartManage-ment of EnvironManage-mental Sciences, Wagenin-gen University, The Netherlands, 2001.
Germann, U.: Radome attenuation – a serious limiting factor for quantitative radar measurements?, Meteorol. Z., 8, 85–90, 1999. Groot Zwaaftink, M. E.: Hydrological Modeling of the Ourthe, A comparison of Rainfall-Runoff Models, MSc Thesis, Hydrology and Quantitative Water Management Group, Department of En-vironmental Sciences, Wageningen University, The Netherlands, 2003.
Kwadijk, J. C. J.: The Impact of Climate Change on the Discharge of the River Rhine, PhD Thesis, Department of Physical Geogra-phy, Utrecht University, The Netherlands, KNAG/NGS Publica-tion 171, 1993.
Lindstr¨om, G., Johansson, B., Persson, M., Gardelin, M., and Bergstr¨om, S.: Development and test of the distributed HBV-96 hydrological model, J. Hydrol., 201, 272–288, 1997.
Pfister, L., Humbert, J., and Hoffmann, L.: Recent trends in rainfall-runoff characteristics in the Alzette river basin, Luxembourg, Clim. Change, 45, 323–337, 2000.
RMI: A Weather Radar at Wideumont. Information brochure, Royal Meteorological Institute, Brussels, Belgium (see also http:// www.kmi.be/), 2001.
Sanchez-Diezma, R., Sempere-Torres, D., Delrieu, G., and Za-wadzki, I.: Factors affecting the precision of radar measurement of rain. An assessment from an hydrological perspective, Proc. 30thInternational Conference on Radar Meteorology, American Meteorological Society, Boston, 573–575, 2001.
Sanchez-Diezma, R., Zawadzki, I., and Sempere-Torres, D.: Iden-tification of the bright band through the analysis of volumetric radar data, J. Geophys. Res. – Atm., 105, D, 2225–2236, 2000. Steiner, M., Houze, R. A., and Yuter, S. E.: Climatological
char-acterization of 3-dimensional storm structure from operational radar and rain-gauge data, J. Appl. Meteorol., 34, 1978–2007, 1995.
Ten Heggeler, M.: Hydrological Modelling and Areal Average Rainfall Estimates of the Ourthe Catchment Derived From the Wideumont Weather Radar and Precipitation Gauges, MSc The-sis, Hydrology and Quantitative Water Management Group, De-partment of Environmental Sciences, Wageningen University, The Netherlands, 2004.
Uijlenhoet, R., De Wit, M. J. M., Warmerdam, P. M. M., and Torfs, P. J. J. F.: Statistical Analysis of Discharge Data of the River Meuse and its Tributaries (1968-1998): Assessment of Drought Sensitivity, Report 100, Hydrology and Quantitative Water Man-agement Group, Department of Environmental Sciences, Wa-geningen University, The Netherlands, 2001.
Van den Hurk, B.: Development of a European Land Data Assimila-tion System to Predict Floods and Droughts (ELDAS), Descrip-tion of Work of EU RTD Project EVG1-CT-2001-00050, 2001. Velner, R. G. J.: Rainfall-runoff Modeling of the Ourthe
Catch-ment Using the HBV Model – A Study Towards Increasing the Leadtime of Flood Forecasts on the River Meuse, MSc Thesis, Hydrology and Quantitative Water Management Group, Depart-ment of EnvironDepart-mental Sciences, Wageningen University, The Netherlands, 2000.
W´ojcik, R. and Buishand, T. A.: Simulation of 6-hourly rainfall and temperature by two resampling schemes, J. Hydrol., 273, 69–80, 2003.