HAL Id: hal-00147590
https://hal.archives-ouvertes.fr/hal-00147590
Submitted on 2 Dec 2020
HAL is a multi-disciplinary open access
archive for the deposit and dissemination of
sci-entific research documents, whether they are
pub-lished or not. The documents may come from
teaching and research institutions in France or
abroad, or from public or private research centers.
L’archive ouverte pluridisciplinaire HAL, est
destinée au dépôt et à la diffusion de documents
scientifiques de niveau recherche, publiés ou non,
émanant des établissements d’enseignement et de
recherche français ou étrangers, des laboratoires
publics ou privés.
Measurements using a PR-based Database.
Nicolas Viltard, Corinne Burlaud, Christian Kummerow
To cite this version:
Nicolas Viltard, Corinne Burlaud, Christian Kummerow. Rain Retrieval from TMI Brightness
Temper-ature Measurements using a PR-based Database.. Journal of Applied Meteorology and Climatology,
American Meteorological Society, 2006, 45 (3), pp.455-466. �hal-00147590�
Rain Retrieval from TMI Brightness Temperature Measurements Using a TRMM
PR–Based Database
NICOLASVILTARD ANDCORINNEBURLAUD
Centre d’Études des Environnements Terrestre et Planétaires, Vélizy, France
CHRISTIAND. KUMMEROW
Department of Atmospheric Science, Colorado State University, Fort Collins, Colorado
(Manuscript received 28 October 2004, in final form 3 June 2005)
ABSTRACT
This study focuses on improving the retrieval of rain from measured microwave brightness temperatures and the capability of the retrieved field to represent the mesoscale structure of a small intense hurricane. For this study, a database is constructed from collocated Tropical Rainfall Measuring Mission (TRMM) precipitation radar (PR) and the TRMM Microwave Imager (TMI) data resulting in about 50 000 brightness temperature vectors associated with their corresponding rain-rate profiles. The database is then divided in two: a retrieval database of about 35 000 rain profiles and a test database of about 25 000 rain profiles. Although in principle this approach is used to build a database over both land and ocean, the results presented here are only given for ocean surfaces, for which the conditions for the retrieval are optimal. An algorithm is built using the retrieval database. This algorithm is then used on the test database, and results show that the error can be constrained to reasonable levels for most of the observed rain ranges. The relative error is nonetheless sensitive to the rain rate, with maximum errors at the low and high ends of the rain intensities (⫹60% and ⫺30%, respectively) and a minimum error between 1 and 7 mm h⫺1. The retrieval method is optimized to exhibit a low total bias for climatological purposes and thus shows a high standard deviation on point-to-point comparisons. The algorithm is applied to the case of Hurricane Bret (1999). The retrieved rain field is analyzed in terms of structure and intensity and is then compared with the TRMM PR original rain field. The results show that the mesoscale structures are indeed well reproduced even if the retrieved rain misses the highest peaks of precipitation. Nevertheless, the mesoscale asymmetries are well reproduced and the maximum rain is found in the correct quadrant. Once again, the total bias is low, which allows for future calculation of the heat sources/sinks associated with precipitation production and evaporation.
1. Introduction
The Tropical Rainfall Measuring Mission (TRMM) offers a unique instrumental design with a 220-km-wide common swath for the TRMM Microwave Imager (TMI) and the precipitation radar (PR). On the one hand, the TMI measures nine brightness temperatures (TB) at five different frequencies: 10.65, 19.35, 21.3,
37.0, and 85.5 GHz (hereinafter referred to as 10, 19, 21, 37, and 85 GHz). The measurements are made at both horizontal (H ) and vertical (V ) polarizations for all but
the 21-GHz channel, which is the only vertical channel. On the other hand, the TRMM PR operates at 13.8 GHz and provides vertical profiles of reflectivity (Z, dBZ ) that can be converted into rain-rate profiles (R, mm h⫺1). Viltard et al. (2000) performed a series of TB
simulations from TRMM PR–derived profiles and com-pared these simulated brightness temperatures with those observed. The first study demonstrated good con-sistency between the TRMM PR and the TMI obser-vations. This allowed them also to test the quality of the radiative transfer simulation and its sensitivity to rain-drop size distribution. The study showed that the rain-drop size distribution (DSD) has an impact on the simulated brightness temperatures that is comparable in magni-tude to effects of the melting layer and subgrid-scale effects.
Corresponding author address: Dr. Nicolas Viltard, CETP,
CNRS-IPSL, 10-12 Avenue de l’Europe, 78140 Vélizy, France. E-mail: [email protected]
© 2006 American Meteorological Society
The melting layer is addressed in some studies using forward radiative transfer in the presence of melting particles to quantify the impact of neglecting these par-ticles in the stratiform regions (Bauer et al. 2000, Olson et al. 2001). These studies showed the complexity of a proper description of the melting phase due both to the lack of knowledge on the melting processes themselves as well as poorly known ice-phase microphysics. The second issue was addressed by Harris and Foufoula-Georgiou (2001). They showed that a radiative transfer calculation performed at 3-km resolution, like most cloud-resolving model simulations, could lead to impor-tant biases resulting from the improper representation of subgrid contribution.
Nevertheless, from Viltard et al. (2000), it appeared possible to achieve good consistency between TRMM PR–observed rain parameters (rain rate or water con-tent) and the corresponding observed brightness tem-peratures. Consistency between TMI and TRMM PR measurements is a very important issue allowing for new approaches in building and validating rain retrieval algorithms. Because the retrieval problem is ill posed, most retrieval methods rely on an a priori database that reduces the space of possible solutions to only those that are physically plausible. The retrieval algorithm itself either looks for the most probable rain rate inside the database from the measured brightness tempera-ture vector, or it works as an interpolation function from the space of measured brightness temperatures to the space of possible surface rain rates. The first type of approach is used in Bayesian algorithms such as the Goddard profiling algorithm (GPROF) (Kummerow et al. 1996; Olson et al. 1996), or its operational version known as the 2A12 algorithm (Kummerow et al. 2000, 2001). It is also used in the PR-adjusted TMI estimation of rainfall (PATER) algorithm (Bauer 2001a,b) and the algorithm described in Panegrossi et al. (1998), now known as the Bayesian algorithm for microwave pre-cipitation (BAMPR). The second type of technique is an application of artificial neural network techniques as in the work of Moreau et al. (2002).
The original idea in this paper is to use the data from the TRMM instrument package to build a database from collocated observation of surface rain rate and brightness temperatures. The TRMM PR measures the reflectivity profiles while the TMI measures the emerg-ing brightness temperatures nearly simultaneously for the same region of atmosphere. The reflectivity profile is converted into rain rate and averaged spatially to match the location and spatial resolution of the 37-GHz pixels. This allows us to build an arbitrarily large data-base for which all the channels can be used in the re-trieval process. This primary database is then split in
two subdatabases. The first one is the retrieval data-base, used for the retrieval itself. The second one is the test database used for the assessment of the algorithm performance.
The algorithm presented here can provide a rain es-timate above both land and ocean because the principle used to build the databases is not dependent on the type of surface. Nevertheless, the land surfaces offer a much more complex situation where only 85-GHz brightness temperatures can be used, leading to the de-velopment of a very specific retrieval scheme. For the sake of simplicity we will only present and discuss the performances of the algorithm in the “simple” case of ocean surfaces.
Section 2 is dedicated to the TRMM PR and TMI data processing. It details the steps necessary to per-form the collocation and scaling of the TRMM PR data into the TMI field of view to go from TRMM PR–mea-sured reflectivity to surface rain rate. Section 3 details the database built from the collocated data and the principles of the associated Bayesian-based algorithm. This section also gives an estimate of the algorithm performance. Section 4 presents the results obtained for Hurricane Bret observed in 1999. Section 5 presents the conclusion and perspectives of this work.
2. TMI–PR data processing
a. Collocation of TRMM PR and TMI data
The TRMM PR is a cross-track scanning radar (⫾17° off nadir), projecting an almost- regular grid at the earth’s surface with a pixel roughly every 4.5 km in both the cross- and along-track directions. The TMI is a coni-cal scanning instrument with a constant incident angle at the surface (52.8° for the beam centers), but the pixel size depends dramatically on the frequency. The dis-tance between two pixel centers in the same scan is 9.1 km at the low frequencies while the distance between two scans is about 13.9 km. Both instruments are ex-tensively described in Kummerow et al. (1998). The matchup is performed in latitude–longitude space rather than pixel scan positions in order to account for subtle variations in the relative pixel positions associ-ated with the satellite attitude.
Only the 29 TRMM PR pixels from the center of the swath are kept, minimizing the risks of erroneous rain rates resulting from poorly corrected surface echoes and the bias resulting from the shadow zone at the edges. The resulting swath where TMI and TRMM PR data are collocated is reduced to about 125 km. The chosen final resolution for the algorithm is similar to the GPROF or 2A12 algorithms (Kummerow et al. (1996, 2001) which is about 12.5 km. Within such a
circle, there are about 10 TRMM PR pixels. The rain rate associated with these 10 TRMM PR pixels is sim-ply averaged, and this represents the rain rate at the 37-GHz pixel resolution. The conversion of TRMM PR–measured reflectivity into surface rain rate requires a detailed explanation and is described in the next sec-tion.
b. Conversion of TRMM PR reflectivity to surface rain rate
Conversion of the reflectivity factor (Z ) measured by the TRMM PR to rain rate (R), taking into account the attenuation (k), is a key issue for our approach. Be-cause the relationship between R, k, and Z are power laws and depend on the drop size distribution charac-teristics, a small change in the coefficients might have an important impact on the results. The standard 2A25 algorithm (version 5) provides a high-quality rain esti-mate (Iguchi et al. 2000). In this study, we decided nev-ertheless to use an alternate estimate for the TRMM PR rain rate based on Ferreira et al. (2001) and to use the normalized approach for the DSD as proposed by Testud et al. (2001). Such a combination of approaches was already used in Viltard et al. (2000) and proved to be very convenient and robust.
Using the normalized DSD, the number of drops of a given diameter D of any Gamma-type of distribution is given by N共D兲⫽ N*0共D,兲exp
冋
⫺共3.67⫹兲 D D0册
, 共1兲 with 共D,兲⫽ ⌫共4兲 3.674 共3.67⫹兲4⫹ ⌫共4⫹兲冉
D D0冊
, 共2兲where is the shape coefficient of the distribution. The parameter is set to 3 in the present study to be con-sistent with the DSD hypothesis used in the 2A25 stan-dard algorithm (Iguchi et al. 2000). Here, D0 is the median drop diameter defined as D0⫽ (3.67 ⫹)/⌳. Note that N0* identifies with the classical Marshall– Palmer exponential-type distribution intercept N0 for ⫽ 0.
Using N0* allows us to write the power laws that link
R, Z, and k as k⫽␣N*0共1⫺兲Z, 共3兲 R⫽ aN*0共1⫺b兲Z b, and 共4兲 R⫽ cN*0 共1⫺d兲kd , 共5兲
with d ⫽ b/ and a ⫽ c␣d. The a, b, c, d, ␣, and  coefficients are set according to the chosen drop size
distribution. Numerical values for a, b, c, N*0, and d are given in Table 1. The given coefficients are based on data collected around the globe and during the Tropical Ocean and Global Atmosphere Coupled Ocean–Atmo-sphere Response Experiment (TOGA COARE) as presented in Kozu et al. (1999) and Ferreira et al. (2001). Because of the normalized approach, a, c, and␣ are independent from , and b, d, and  are only weakly dependent on.
A study was conducted by Ferreira et al. (2001) on the sensitivity of the set of power-law equations [Eqs. (3)–(5)] to the uncertainties of␣, a, and c and on the radar calibration. They showed that given a well-calibrated radar, the more stable relationship would be Eq. (5), provided that local variations of N*0 in Eq. (3) could be accounted for through the use of the relation ␦ ⬅ ␦N*0
(1⫺)⫽⑀
f. The⑀fcoefficient is generated by the
surface reference technique as proposed by Meneghini and Nakamura (1990) and is used in the 2A25 algo-rithm (Kozu et al. 1999, Iguchi et al. 2000). This as-sumption is valid for rain situations in which attenua-tion is strong enough for the surface reference tech-nique to apply. Combining the above elements and the set of Eqs. (3)–(5), Ferreira et al. (2001) showed that the best estimate for R would then be
R⫽⑀f d
cN*0共1⫺d兲k
d
, 共6兲
provided that⑀fis indeed close in average to unity. If d
and c in Eq. (6) are set in the algorithm only once (depending on the radar bin altitude and the type of precipitation),⑀fvaries and is computed for each of the
radar pixels. The set of coefficients of Table 1 are used accordingly for convective and stratiform situations as given by the rain type provided in the TRMM standard products.
The TRMM PR data exhibit a region with no useful reflectivities below 1.5 km on the edges of the swath because of ground clutter. Below this level, the rain is assumed to increase linearly to the surface. The surface rain is set at 1.1 times the 2-km rainfall. This procedure reasonably replicates rainfall profiles in the operational TRMM algorithm. One notices that the set of relations in Eqs. (3)–(6) are self-consistent and the difference between the “best” R estimator in Eq. (6) and the R from straight use of Eq. (5) only depends on how close
TABLE1. Values of power-law coefficients of Eqs. (5), (4), and (3); N*0: 106m⫺4.
aN*0(1⫺b) b N*0 c d
Convective 0.040 24 0.6434 15.66 26.5440 0.8342 Stratiform 0.022 82 0.6727 7.42 23.3358 0.8490
to unity the parameters d and⑀f are in Eq. (6). In an
ideal situation, the power-law relationship set in the 2A25 algorithm would be valid everywhere around the globe and⑀fwould be equal to unity at all times. In the
2A25 algorithm, two main DSDs are used: one for con-vective cells and one for stratiform regions.
The convective and stratiform (C/S) classification is given as a standard product in 2A25. The classification (actually issued in the 2A23 algorithm) is presented in Awaka (1998) and uses both a horizontal texture indi-cator (Steiner et al. 1995) and a brightband detection criterion. The definition might therefore slightly differ from what is currently accepted as “convective” and “stratiform” rain, based on dynamic criterion.
c. Processing of the TMI channels
The spatial resolution of the TMI channels varies from 7 km⫻ 5 km at 85 GHz to 37 km ⫻ 63 km at 10 GHz. This raises a problem in terms of field-of-view characteristics: the average rain rates within an 85-GHz pixel and the corresponding 10-GHz pixel can be com-pletely uncorrelated. Also, it was observed that the 85-GHz channel is substantially nosier than the lower channels, either because of the geometry of the instru-ment having a lower beam efficiency at 85 GHz (Kum-merow et al. 1998) or because of this channel’s sensi-tivity to the highly irregular ice field. Thus, we arbi-trarily decided to substitute each 85-GHz pixel with the distance-weighted average of its 15 closest neighbors. This smoothing of the 85-GHz horizontal field naturally reduces the spatial resolution of this channel, bringing it closer to the resolution of the 37-GHz channels.
At the other end of the resolution problem is the coarse spatial resolution of the low-frequency channels. Various authors performed a series of studies on de-convolution techniques to enhance the spatial resolu-tion of lower channels (Farrar and Smith 1992, Bauer and Bennartz 1998). The present study does not use such techniques in order to work with original TMI data as much as possible.
3. Retrieval method description
a. Database characteristics
The database of this first version of the algorithm is made of rainy pixels (as detected by the TRMM PR) observed around the globe during randomly selected periods in February and August 1998, and January and August of 1999 and 2000. The types of rain systems used in the database were neither filtered nor selected, but a few cases of tropical cyclone situations were added. Most of the systems represented in the database
are oceanic mesoscale convective systems (MCSs) and midlatitude (30°–40°) oceanic frontal bands. The data-base contains about 50 000 points distributed over 200 different orbits. Within this database, about 36 000 points are randomly extracted to become the retrieval database, while the remaining points are kept for test-ing purpose. A histogram of surface rain rates included in the retrieval database is presented Fig. 1. The histo-gram shape does not evolve when additional profiles are included. The representativeness of the 35 000 pro-files is therefore deemed adequate.
Rain rates below 1 mm h⫺1represent 44.9% of the points and account for 8.8% of the total rain in the database. Rates between 1 and 10 mm h⫺1 represent 51.8% of the data and account for 68.2% of the total rain. Rain rates above 10 mm h⫺1represent 3.3% of the occurrences and account for 23% of the total rain. Rain rates with only one occurrence are recorded above 52, up to the maximum observed rain rate of 78 mm h⫺1. Although the minimum detectable rain rate by the TRMM PR is fixed by the TRMM PR sensitivity (about 17 dBZ, or 0.5 mm h⫺1), rain rates below this threshold are present in the database because of the spatial av-eraging from the TRMM PR resolution to 37-GHz TMI resolution.
b. Retrieval algorithm principles
The retrieval algorithm is based on Bayes’s theorem. This type of technique is extensively described in Kum-merow et al. (1996, 2001) and Olson et al. (1996). Fur-thermore, to minimize the influence of the surface
ability we followed the suggestion of Petty (1994) using the scattering indices Sj, where j stands for 37 and 85
GHz, and the emissivity indices Pi, where i stands for
10, 19, 37, and 85 GHz. These variables are defined as
Pi⫽
⌬Ti
⌬Ti
Clr, 共7兲
where⌬Tiis the brightness temperatures difference TiV
⫺ TiH, and Ti
Clr
is the corresponding TBof the nearest
precipitation-free pixel. The scattering index Sj is
de-fined by
Sj⫽ PjTjV
Clr⫹共1⫺ P
j兲Tc⫺ TjV, 共8兲
where Tc⫽ 273 K.
Substituting the vector of measured brightness tem-peratures TObsby the corresponding vector of indices
XObs(X standing for the two Sjs and the four Pis), the
expected value for rain rate R may be expressed as
E共R兲⫽ 1
A
冕冕冕
· · ·冕
RDbase exp兵⫺0.5关XObs⫺ XDbase共RDbase兲兴 T共O⫹ M兲⫺1关XObs⫺ XDbase共RDbase兲兴其
⫻ Pa共RDbase兲dR, 共9兲
where XDbase(RDbase) is the vector of P and S indices in the database associated with the surface rain rate RDbase; [ ]Tstands for the transpose of a vector, O is the obser-vation error covariance matrix, and M is the error co-variance matrix associated with other sources of errors.
In Eq. (9) the a priori probability that RDbaseis the true rain rate Pa(RDbase) is substituted by the number of its occurrences in the database. A normalization factor A is defined as
A⫽
冕冕冕
· · ·冕
exp兵⫺0.5关XObs⫺ XDbase共RDbase兲兴T共O⫹ M兲⫺1关
XObs⫺ XDbase共RDbase兲兴其dR. 共10兲
This expression is reduced using the Monte Carlo method in which the integral in Eq. (9) is evaluated over a large number of realizations of the retrieval pa-rameters. It is also assumed that O and M are diagonal, that is, the errors are uncorrelated. Hence,
R⫽
兺
k∈Dbase Rk A exp冋
l⫽1,6兺
⫺ 0.5 1 l 2共Xl,Obs⫺ Xl,k兲 2册
, 共11兲 where l varies from 1 to 6 to account for the two Sjs andthe four Pis.
In the present case in which there are no model-related errors, the M matrix vanishes and thel
2s are the diagonal elements of the O matrix, assuming that the observation errors between two channels are un-correlated. Kummerow et al. (1998) give the values of the calibration and sensitivity for the different instru-ments that can be used as a basis to assign values for the ls. L’Écuyer and Stephens (2002, hereinafter LE02)
provide estimates for this variance/covariance matrix based on objective error calculations. In our case, it was possible to calculate these elements directly from the data. Values are reproduced in Table 2. These errors were found to depend slightly on rain rates. A simple polynomial interpolation was therefore used to avoid discontinuity between the different rain regimes. These polynomials are plotted against the rain rates in Fig. 2. Because of the lack of occurrence of the highest rain rates, the polynomial coefficients became spurious for rain rates above 25–30 mm h⫺1, leading us to threshold the for rain above 25 mm h⫺1to the value at 25 mm h⫺1.
The(R) for P10and P19are found to be decreasing functions of R, while the P37and P85appear to be best fit with a parabolic shape. The P10 and P19 seem to contain the most information, while P37and P85contain the least. This is not unexpected because the latter two channels are dominated by scattering effects most of
TABLE2. Empirical variances–covariance error matrix elements as a polynomial function of rain rate R:⫽ a0⫹ a1R⫹ a2R2.
P10 P19 P37 P85 S37(K) S85(K)
a0 0.075 00 0.180 00 0.230 00 0.200 00 2.000 10.000
a1 ⫺0.001 50 ⫺0.004 00 ⫺0.010 90 ⫺0.010 00 0.300 0.500
a2 — — 0.000 40 ⫺0.000 50 — —
the time. The two scattering indices Sjincrease slowly
with rain rate. On the lowest end of the rain range, their correlation with rain is quite good, but diminishes as the rain intensity increases. It seems that the scattering sig-nature is not well correlated with surface rain. While this makes sense, it is also contrary to what is usually accepted as a good signature for intense rain. Horizon-tal transport of ice crysHorizon-tals and the instrument geom-etry (52° incidence angle) might contribute to this ef-fect. The level of the S37remains close to the P10and
P19 at the higher end of the rain intensity, which is probably because of the chosen spatial resolution of reference at 37 GHz.
The values of P10 and S37 estimated from the data (Table 2 and Fig. 2) are close to the coefficients sug-gested by LE02. The uncertainty in the remaining indi-ces, particularly those for P37and P85, are substantially higher. The estimated and calculated S85 are nearly equal for rain rates around 1 mm h⫺1.
c. Quality of retrieval
The test database is used to infer the quality of the retrieval error and the total bias. Figure 3 shows the total scatterplot of the retrieved rain versus the initial (expected) rain. The match is globally good but shows considerable scatter at the pixel level. The algorithm tends to underestimate the higher rain rates and slightly overestimate the lower end of the scale. Table 3 shows the quality of the retrieval as a function of the surface rain rate. The low-bias nature of the developed algo-rithm is clearly visible in these results. For each surface
rain interval, the mean retrieved rain and the bias with respect to the so-called TRMM PR reference rain is given. For comparison purposes, the last column shows the results obtained using the coefficients from LE02.
The underestimate of high rainfall rates can be as-cribed to the saturation regime leading to ambiguous solutions where the same TBvector can represent very
different rain rates. These rain rates, having the same probability, are averaged, which leads to an intermedi-ate value not representing the true rain situation.
TABLE3. Global performances of the retrieval algorithm (unit: mm h⫺1, except for the number of pixels).
Rain interval
No. of
pixels Reference Retrieved Bias LE02 bias 0–1 13 551 0.377 0.570 0.194 0.129 1–2 3761 1.419 1.545 0.127 0.169 2–3 1746 2.454 2.347 ⫺0.107 0.068 3–4 982 3.450 3.049 ⫺0.401 ⫺0.114 4–5 632 4.465 3.951 ⫺0.514 ⫺0.148 5–6 452 5.481 4.729 –0.752 ⫺0.358 6–7 295 6.464 5.428 ⫺1.036 ⫺0.657 7–8 205 7.471 6.064 ⫺1.407 ⫺1.078 8–9 140 8.425 6.383 ⫺2.043 ⫺1.807 9–11 149 9.847 7.103 ⫺2.744 ⫺2.673 11–14 142 12.347 8.843 ⫺3.50 ⫺3.557 14–21 139 16.836 12.301 ⫺4.53 ⫺5.576 21–50 52 29.005 21.280 ⫺7.724 ⫺11.41 Total bias R: ⫺4.32 ⫻ 10⫺2 ⫺3.58 ⫻ 10⫺2 FIG. 2. Variation of theias a function of the rain rate. Notice
that the values for S37and P85are scaled by a factor of 100.
FIG. 3. Two-dimensional histogram of retrieved rain vs TRMM
PR–computed rain. The contours represent the number of points in the considered rain interval. The unlabeled solid contour is the 1-point contour; other contours are labeled. The dotted line is the
x ⫽ y line. The total number of points in the test database is
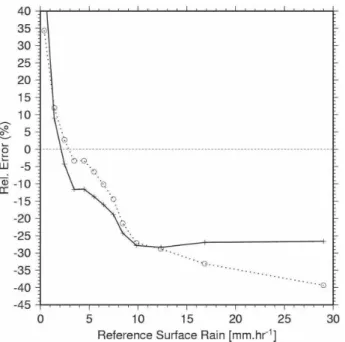
The evolution of the relative error of the algorithm with respect to the reference TRMM PR rain is also shown in Fig. 4. The high uncertainties associated with the low rain rates is because of the sensitivity of TBto
external effects like sea surface temperature, cloud presence, the water vapor profile, or the temperature profile. The relative error drops when the TB signal
reaches its maximum correlation with rain between 1.5 and 7 mm h⫺1. Within this range of rain intensity, the relative error remains below 15%. It then begins to increase again to reach an average of 30% underesti-mate for 20 mm h⫺1 and above. The same graph also shows the evolution of the relative error when using the coefficients from LE02. When compared with the first set of coefficients, the relative error for LE02 is smaller for rain rates less than 10 mm h⫺1, is nearly the same rain rates between 10 and 13 mm h⫺1, and then be-comes greater for rain rates higher than 13 mm h⫺1.
4. Case study: Bret 1999
a. TRMM PR–related variables
The algorithm is applied to the case of a small intense hurricane to illustrate the structure of the resulting rain field. Hurricanes offer both a series of well-defined characteristic structures and a large range of rain inten-sities and rain types to help verify the quality of an algorithm. Hurricane Bret was a small intense hurri-cane that formed on 18 August and dissipated on 25 August 1999 (Lawrence et al. 2001). On 21 August, a
very good overpass of TRMM (orbit 9967) took place while the system was still out of the influence of the Texas shore. The hurricane was experiencing an impor-tant strengthening event at this time. Both the TRMM PR and TMI data were available during this overpass of the hurricane.
Figure 5 shows the horizontal cross section of the TRMM PR–measured effective reflectivity as given by the 2A25 product. The eye of the storm is clearly vis-ible, free of precipitation, and surrounded by an eye-wall that contains the maximum activity with signatures of reflectivities above 45 dBZ located in the western-to-northwestern quadrant. The actual maximum reflec-tivity of the scene is 54.2 dBZ. A series of rainbands can be observed in the western and southern sectors that seem to surround the intense eyewall. Their reflectivi-ties are between 35 and 45 dBZ. Cells and bands of reflectivities above 35 dBZ are scattered over the whole system, embedded in the 25-dBZ contour. This last re-flectivity contour shows two spiraling bands in the northwestern and southeastern quadrants, the former being just on the edge of the swath. On the eastern quadrant, a cell of 35–45 dBZ is embedded in a thin line of 25–35-dBZ reflectivities. This is probably a spiraling band only partially within the field of view. The 15-dBZ contour shows the TRMM PR detection threshold, and as such the boundaries of the rain region, as seen by the radar. Scattered rain is detected on the northwestern part of the domain, next to the shore, with maximum reflectivities of the order of 30 dBZ.
The C/S classification of the TRMM PR pixels is
FIG. 4. Evolution of the relative error as a function of rain-rate intensity for the database, based on the set of heuristic coefficients from Table 2 (solid line) and those from LE02 (dotted line).
FIG. 5. Horizontal cross section of TRMM PR reflectivity at 2.5-km altitude. Shades of gray stand for 15, 25, 35, and 45 dBZ, respectively, from lighter to darker.
shown in Fig. 6. As mentioned in section 2b, this clas-sification is based both on the vertical and horizontal structure of the reflectivity field. The vertical texture indicator relies on the presence of a brightband sig-nature, indicating a stratiform region. The horizontal texture indicator relies on the heterogeneity of the re-flectivity field in the convective zones. The C/S pat-tern exhibits a broad convective region in the wespat-tern part of the eyewall, nearly surrounding the eye. Apart from this large region, the rest of the convection is spread among convective cells predominantly on the northeastern quadrant of the system. This configura-tion is classic for hurricanes, where most of the precipi-tation is stratiform except in the eyewall and spiraling bands.
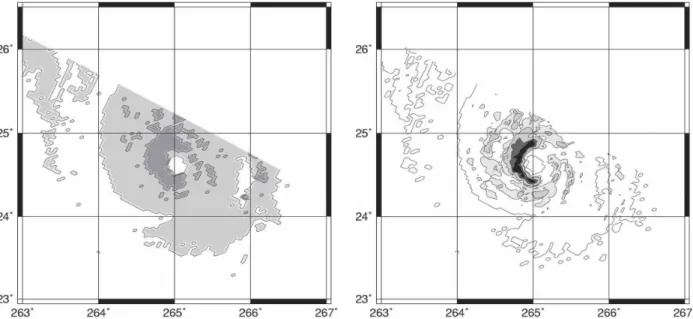
Figure 7 shows the horizontal cross section of the rain rate as calculated using Eq. (6) and the C/S classifica-tion needed to assign the proper coefficients provided in Table 1. The rain field shows a structure similar to the reflectivity field, but with a somewhat different em-phasis because of both the logarithmic scale of the re-flectivity decibels (dBZ) and the use of a power law to convert reflectivity decibels to millimeters per hour. The 30 mm h⫺1contour corresponds to the active re-gion of the eyewall, plus three cells in the southeastern band close to the eyewall. All of these regions corre-spond to convective pixels in the C/S classification. The maximum measured rain rate is 97.3 mm h⫺1, which at 4.4-km resolution is questionable, yet plausible in a very intense hurricane environment. The sea surface might be extremely rough and it is possible that the
surface reference technique (Meneghini et al. 2000, Igu-chi et al. 2000) is not properly correcting the attenua-tion in such condiattenua-tions. Light rain rates between 0 and 5 mm h⫺1extend over most parts of the system. These light rain rates correspond mostly to stratiform precipi-tation as shown on the C/S classification. Some more intense rain (5 mm h⫺1contour and cells of 10 mm h⫺1 contour) is present in stratiform regions in the south-western part of the outer band.
FIG. 6. Horizontal cross section of TRMM PR–based convec-tive/stratiform classification; light gray: unclassified or nonraining, intermediate gray: stratiform, and dark gray: convective.
FIG. 7. Horizontal cross section of TRMM PR 2.5-km rain rate using Eq. (6). Increasing shades of gray stand for 0, 5, 10, 30, and 50 mm h⫺1, respectively.
FIG. 8. Horizontal cross section of TRMM PR rain rate at 37-GHz resolution. Increasing shades of gray stand for 0, 5, 10, and 30 mm h⫺1, respectively.
Figure 8 shows the rain estimated from the TRMM PR computed at the resolution of the 37-GHz channel (⬇12 km ⫻ 12 km). The loss of structure definition is obvious and the dynamic range is also affected because the maximum is now close to 50 mm h⫺1. The main features are kept, with the maximum rain region lo-cated in the western quadrant of the eyewall, which corresponds very clearly to the region identified as be-ing convective in Fig. 6. The weaker-rain region in the eastern part of the eyewall is still very visible but the small spiraling rainband on the southwest is averaged within the rest of the eyewall.
b. TMI brightness temperatures
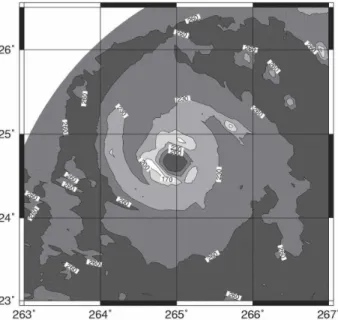
The brightness temperatures also show the same asymmetric structure for the system. The 10-GHz hori-zontal (Fig. 9) shows (over the ocean) a maximum emis-sion on the northwestern quadrant and a moderate asymmetry of the 190-K contour with a more round-shaped western part. The poor resolution of this chan-nel does not help to resolve the thin structures of Bret: neither the eyewall nor the eye can be seen in Fig. 9 and the hurricane itself appears only as a warm rounded shape on the cold oceanic background. The 85-GHz horizontal TB(Fig. 10) shows more detailed structures,
with strong scattering inside the eyewall and lighter scattering in the surroundings. This scattering is prob-ably because of dense ice particles lifted in the updrafts. One can notice that the large region of intense
scatter-ing in the southwestern part of the eyewall is shifted with respect to the maximum rain detected by the ra-dar. This is an effect of the strong azimuthal advection of ice particles by the tangential wind. Light ice par-ticles like snow parpar-ticles are transported to the region surrounding the eyewall.
One can also notice in Fig. 10 that the warmest TBs
(260-K contour and above) are found surrounding the rainy region and inside the eye. This increase of emis-sion when compared with the far western and northern edges of the domain is probably because of the increase of water vapor near the regions of updrafts. Embedded in the 260-K contour one can also observe the three cold cores in the northeastern quadrant corresponding to active convective cells.
The other temperatures are not represented because the content does not change much—as the frequency increases, the spatial resolution increases and the satu-ration regime extends over larger areas.
c. TMI-retrieved rain and comparison
Figure 11 presents the TMI-retrieved surface rain rate that can be compared directly with Fig. 8, keeping in mind the limited swath of the TRMM PR. The re-trieved rain shows good agreement with the TRMM PR–computed rain. The maximum rain intensity is 34 mm h⫺1(48 mm h⫺1for averaged TRMM PR), located very close to the detected TRMM PR maximum. The retrieved 20 mm h⫺1contour has an extension close to the 30 mm h⫺1 contour of the TRMM PR. The re-trieved 30 mm h⫺1 contour corresponds somewhat to
FIG. 9. The 10-GHz horizontal (10H) channel over Hurricane Bret. Increasing shades of gray stand for 100, 130, 160, and 190 K, respectively. The white triangles are the best estimate of trajec-tory.
FIG. 10. Same as Fig. 9, but for 85-GHz horizontal (85H) chan-nel. Increasing shades of gray stand for 170, 200, 230, 260, and 290 K, respectively.
the 35 mm h⫺1 contour of the TRMM PR (not dis-played). Extension of the 10 and 5 mm h⫺1contours are similar for both the TRMM PR and the retrieved field. The rain/no-rain limit defined by the 0.1 mm h⫺1 con-tour line is in excellent agreement, even for most of the regions near the coastline.
The eye itself is very slightly shifted to the west and shows some light rain rate that is an obvious artifact. In the case of Bret, the eye is well marked but rather small and thus is poorly resolved by most channels except for those at 37 and 85 GHz. This residual rain in the eye is because of the lower-resolution channels showing some emission signal originating from the eyewall region.
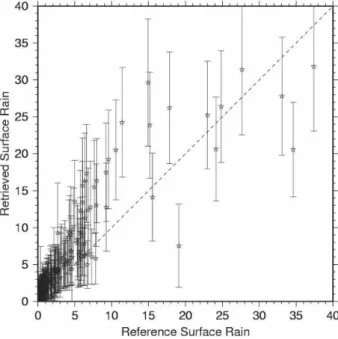
In terms of rain structures, the retrieved and TRMM PR rain are in good agreement, even if there are some local differences. Figure 12 presents the pixel-to-pixel comparison between TMI- and TRMM PR–averaged surface rain. The displayed error bars correspond to 1 (standard deviation of the matching profiles in the da-tabase). The agreement is once again quite good, but the local errors can be important. These come from the personal choice of emphasizing a low total bias that increases the bias standard deviation and gives more structure to the retrieved horizontal field. From 5 to 20 mm h⫺1, there is a clear overestimation of the rain (e.g., 10 mm h⫺1retrieved for 7 mm h⫺1expected). Above 20 mm h⫺1, there is a slight tendency for underestimation. This is consistent with Table 4, which shows the bias between the TRMM PR and the retrieved rain rates as a function of rain class. The total bias is less than 10%, while it is close to⫺26% for the high end of the rain intensity and is close to 326% at the low end. This might
be the effect of the very specific surface conditions that affect the low-rain-rate estimate even when using the emissivity and scattering indices. The minimum bias is reached for rain regimes around 5–6 mm h⫺1when all channels contain the maximum information.
Figure 13 shows the same results as Fig. 12, except for the set of coefficients given by LE02. Both figures ex-hibit very similar trends and features. The same differ-ences that were observed on the test database can be observed here, particularly for the highest rain rates. In Hurricane Bret, the total bias from LE02 is a little smaller. On a horizontal cross section (not presented), the difference is hardly noticeable. The results for the specific case of Bret, a small intense hurricane, remain
TABLE4. Same as Table 3, but for the case of Hurricane Bret.
Rain range
No. of
pixels Retrieved Expected Bias 30.0–15.0 11 16.918 22.774 ⫺5.856 15.0–10.0 10 11.949 12.837 ⫺0.888 10.0–8.0 5 8.531 9.146 ⫺0.615 8.0–6.0 32 8.182 6.768 1.414 6.0–5.0 20 5.759 5.537 0.223 5.0–4.0 22 5.750 4.461 1.288 4.0–3.0 24 4.751 3.437 1.314 3.0–2.0 40 3.311 2.483 0.828 2.0–1.0 44 2.420 1.460 0.960 1.0–0.5 42 1.413 0.743 0.670 0.5–0.0 108 0.689 0.162 0.528 Total surface R Total bias
0.205
Std dev 4.082 FIG. 11. Same as Fig. 8, but for the rain rate as retrieved by the
algorithm from the TMI brightness temperatures.
FIG. 12. Comparison of the TMI-retrieved rain rate (retrieved rain) and the TRMM PR–based rain rate (reference surface rain). Error bars are provided for the 1a priori database error.
quite close from the results obtained for the test data-base and presented in Table 3. It is interesting to note that in their comparison between the rain estimated with an airborne radar on the National Oceanic and Atmospheric Administration (NOAA) P3 and those from TRMM PR, Ferreira et al. (2001) found an over-estimate of the TRMM PR rain on the order of 14.2 mm h⫺1for the heavy convective rain and an overestimate of about 0.2 mm h⫺1for the stratiform rain. This would bring the current algorithms into close agreement with the results of the P3 rain estimate, especially for the higher rain rates. Because the algorithm is predicated upon the TRMM PR–generated database, the interpre-tation of the above results is not straightforward.
5. Conclusions and perspectives
The present study focuses on the problem of data-base representativeness for a TMI-data-based rain retrieval algorithm. Using an approach derived from GPROF, we implemented a database made of collocated TMI brightness temperatures and TRMM PR surface rain estimates to construct a comprehensive database. This database was split in two and we kept one of the pieces for the retrieval process and the other one for reference and error estimates.
The collocated data are processed so that the coher-ence between the radar and the radiometer are pre-served in terms of geometry, resolution, and hypoth-esized drop size distribution characteristics. The radar data are processed so that their final resolution is down-graded to the 37-GHz channel of the TMI. A variety of
randomly selected rain situations is used, covering all ranges of oceanic latitude and longitude from a 2-month period: February and May 1998. Some other cases (hurricanes from August 1998 or 2000) are added to complete the representativeness.
The 85-GHz pixels are averaged to downgrade their resolution to the 37-GHz channel. The brightness tem-peratures are converted into emissivity and scattering indices to reduce the undesired sensitivity to secondary variables such as surface emissivity and water vapor profiles, especially for the lowest rain rates. The error variance relevant for the Bayesian/Monte Carlo type of retrieval is then estimated from the database itself and reduces to the observation errors for both instruments and some secondary errors because of collocation.
The test part of the database is used to assess the performances of the algorithm and to optimize the size of the a priori database used by the retrieval. A size of about 35 000 profiles appears to be the best compro-mise between representativeness and convenience. Big-ger databases do not seem to improve the quality of the results, which remains very dependent on the error variance used. The total bias remains low but there are compensating effects between the slightly overesti-mated low rain rates and the underestioveresti-mated high ones. The error varies from⫹60% for 0.1 mm h⫺1to⫺30% for 20 mm h⫺1with a minimum around 2 mm h⫺1. The standard deviation of the error increases almost linearly with the rain rate because we chose to have the lowest possible total bias even if very intense rain rates might be underestimated.
We also tested the sensitivity of the algorithm to the weights assigned to the individual emission and scatter-ing indices used in the Bayes approach. Hence, a set of heuristic values was compared with the theoretical val-ues based on objective calculation. There are some dif-ferences on the point-to-point basis, but the global bi-ases appear to be close. Heuristic values seem to per-form better for higher rain rates while the objective ones are better for low and intermediate rain rates.
The case of Hurricane Bret (1999) is then used to test the retrieval on a hurricane situation with very intense rainfall. Hurricane Bret has been extensively studied with coincident airborne radar data that can eventually be used for independent validation at a later stage. It was also a small intense hurricane with a marked asym-metry in its structure when observed by TRMM on 21 August. The retrieval algorithm was shown to repro-duce a coherent rain field with a well-marked asymme-try. The maximum rain intensity was retrieved close to the right location if not exactly on the same pixel as the TRMM PR. The heavy rains are underestimated as ex-pected, but the total bias is low even in this specific
FIG. 13. Same as Fig. 12, but for thecoefficients given in LE02.
hurricane situation (some hurricane situations are in-cluded in the retrieval database). This bodes well for future applications involving the calculation of derived products such as energy budgets.
Acknowledgments. The authors thank Drs. Paul
Amayenc and Frank Ferreira who greatly helped to sort out the TRMM PR–related microphysics myster-ies. We also thank the NASA TSDIS and the Distrib-uted Active Archive Center for providing us with TRMM data. The figures were produced with the open-source software Generic Mapping Tool developed and maintained by Paul Wessel and Walter H. F. Smith under the GNU General Public License. The authors also thank the two anonymous reviewers and Dr. D. Cecil at MSFC for their great help in improving the manuscript.
REFERENCES
Awaka, J., 1998: Algorithm 2a23-rain type classification. Symp. on
the Precipitation Observation from Non-Sun Synchronous Orbit, Nagoya, Japan, Nagoya University and Earth and
Sci-ence Technology Organization, 215–220.
Bauer, P., 2001a: Including a melting layer in microwave radiative transfer simulation for clouds. Atmos. Res., 57, 9–30. ——, 2001b: Over-ocean rainfall retrieval from multisensor data
of the Tropical Rainfall Measuring Mission. Part I: Design and evaluation of inversion databases. J. Atmos. Oceanic
Technol., 18, 1315–1330.
——, and R. Bennartz, 1998: Tropical Rainfall Measuring Mission imaging capabilities for the observation of rainclouds. Radio
Sci., 33, 335–349.
——, A. Klein, A. Pokrovsky, R. Meneghini, C. Kummerow, F. Marzano, and J. P. V. P. Baptista, 2000: Combined cloud-microwave radiative transfer modeling of stratiform rainfall.
J. Atmos. Sci., 57, 1082–1104.
Farrar, M. R., and E. A. Smith, 1992: Spatial resolution enhance-ment of terrestrial features using deconvolved SSM/I micro-wave brightness temperatures. IEEE Trans. Geosci. Remote
Sens., 30, 349–355.
Ferreira, F., P. Amayenc, S. Oury, and J. Testud, 2001: Study and tests of improved rain estimates from the TRMM precipita-tion radar. J. Appl. Meteor., 40, 1879–1899.
Harris, D., and E. Foufoula-Georgiou, 2001: Subgrid variability and stochastic downscaling of modeled clouds: Effects on radiative transfer computations for rainfall retrieval. J.
Geo-phys. Res., 106, 10 349–10 362.
Iguchi, T., T. Kozu, R. Meneghini, J. Awaka, and K. Okamoto, 2000: Rain-profiling algorithm for the TRMM precipitation radar. J. Appl. Meteor., 39, 2038–2052.
Kozu, T., T. Iguchi, K. Shimizu, and N. Kashiwagi, 1999: Estima-tion of raindrop size distribuEstima-tion parameter using statistical relations between multi-parameter rainfall remote sensing data. Preprints, 29th Conf. on Radar Meteorology, Montreal, QC, Canada, Amer. Meteor. Soc., 689–692.
Kummerow, C., W. S. Olson, and L. Giglio, 1996: A simplified scheme for obtaining precipitation and vertical hydrometeor profiles from passive microwave sensors. IEEE Trans.
Geosci. Remote Sens., 34, 1213–1232.
——, W. Barnes, T. Kozu, J. Shiue, and J. Simpson, 1998: The Tropical Rainfall Measuring Mission (TRMM) sensor pack-age. J. Atmos. Oceanic Technol., 15, 809–817.
——, and Coauthors, 2000: The status of the Tropical Rainfall Measurement Mission (TRMM) after two years in orbit. J.
Appl. Meteor., 39, 1965–1982.
——, and Coauthors, 2001: The evolution of the Goddard profil-ing algorithm (GPROF) for rainfall estimation from passive microwave sensors. J. Appl. Meteor., 39, 1801–1820. Lawrence, M. B., L. Avila, J. Franklin, J. Guiney, and R. Pasch,
2001: Atlantic hurricane season of 1999. Mon. Wea. Rev., 129, 3057–3084.
L’Écuyer, T. S., and G. Stephens, 2002: An uncertainty model for Bayesian Monte-Carlo retrieval algorithms. Quart. J. Roy.
Meteor. Soc., 128, 1713–1737.
Meneghini, R., and K. Nakamura, 1990: Range profiling of the rain rate by an airborne weather radar. Remote Sens.
Envi-ron., 31, 193–200.
——, T. Iguchi, T. Kozu, L. Liao, K. Okamoto, J. A. Jones, and J. Kwiatkowski, 2000: Use of the surface reference technique for path attenuation estimates from the TRMM precipitation radar. J. Appl. Meteor., 39, 2053–2070.
Moreau, E., C. Mallet, S. Thiria, B. Mabboux, F. Badran, and C. Klapisz, 2002: Atmospheric liquid water retrieval using gated expert neural network. J. Atmos. Oceanic Technol., 19, 457– 467.
Olson, W. S., C. D. Kummerow, G. M. Heymsfield, and L. Giglio, 1996: A method for combined passive–active microwave re-trievals of clouds and precipitation profiles. J. Appl. Meteor.,
35, 1763–1789.
——, P. Bauer, N. F. Viltard, D. E. Johnson, W. Tao, R. Me-neghini, and L. Liao, 2001: A melting-layer model for passive/ active microwave remote sensing applications. Part I: Model formulation and comparison with observations. J. Appl.
Me-teor., 40, 1145–1163.
Panegrossi, G., and Coauthors, 1998: Use of cloud model micro-physics for passive microwave-based precipitation retrieval: Significance of consistency between model and measurement manifolds. J. Atmos. Sci., 55, 1644–1673.
Petty, G. W., 1994: Physical retrievals of over-ocean rain rate from multichannel microwave imager. Part I: Theoretical charac-teristics of normalized polarization and scattering indices.
Meteor. Atmos. Phys., 54, 79–99.
Steiner, M., R. A. Houze Jr., and S. E. Yuter, 1995: Climatological characterization of three-dimensional storm structure from operational radar and rain gauge data. J. Appl. Meteor., 34, 1978–2007.
Testud, J., S. Oury, A. Black, P. Amayenc, and X. K. Dou, 2001: The concept of “normalized” distribution to describe rain-drop spectra: A tool for cloud physics and cloud remote sens-ing. J. Appl. Meteor., 40, 1118–1140.
Viltard, N., C. Kummerow, W. S. Olson, and Y. Hong, 2000: Com-bined use of the radar and radiometer of TRMM to estimate the influence of drop size distribution on rain retrievals. J.