HAL Id: hal-00817640
https://hal.archives-ouvertes.fr/hal-00817640
Submitted on 23 Apr 2015
HAL is a multi-disciplinary open access
archive for the deposit and dissemination of
sci-entific research documents, whether they are
pub-lished or not. The documents may come from
teaching and research institutions in France or
abroad, or from public or private research centers.
L’archive ouverte pluridisciplinaire HAL, est
destinée au dépôt et à la diffusion de documents
scientifiques de niveau recherche, publiés ou non,
émanant des établissements d’enseignement et de
recherche français ou étrangers, des laboratoires
publics ou privés.
plume over eastern Canada during BORTAS 2011 using
ground- and satellite-based observations, and model
simulations
D. Griffin, K. A. Walker, J. E. Franklin, M. Parrington, C. Whaley, J.
Hopper, J. R. Drummond, P. I. Palmer, K. Strong, T. J. Duck, et al.
To cite this version:
D. Griffin, K. A. Walker, J. E. Franklin, M. Parrington, C. Whaley, et al.. Investigation of CO, C2H6
and aerosols in a boreal fire plume over eastern Canada during BORTAS 2011 using ground- and
satellite-based observations, and model simulations. Atmospheric Chemistry and Physics, European
Geosciences Union, 2013, 13 (20), pp.10227-10241. �10.5194/acp-13-10227-2013�. �hal-00817640�
www.atmos-chem-phys.net/13/10227/2013/ doi:10.5194/acp-13-10227-2013
© Author(s) 2013. CC Attribution 3.0 License.
Atmospheric
Chemistry
and Physics
Investigation of CO, C
2
H
6
and aerosols in a boreal fire plume over
eastern Canada during BORTAS 2011 using ground- and
satellite-based observations and model simulations
D. Griffin1, K. A. Walker1,2, J. E. Franklin3, M. Parrington4,*, C. Whaley1, J. Hopper3, J. R. Drummond3, P. I. Palmer4, K. Strong1, T. J. Duck3, I. Abboud5, P. F. Bernath6,7, C. Clerbaux8,9, P.-F. Coheur9, K. R. Curry3, L. Dan1, E. Hyer10, J. Kliever1, G. Lesins3, M. Maurice1, A. Saha11, K. Tereszchuk7, and D. Weaver1
1Department of Physics, University of Toronto, Toronto, Ontario M5S 1A7, Canada 2Department of Chemistry, University of Waterloo, Waterloo, Ontario N2L 3G1, Canada
3Department of Physics and Atmospheric Science, Dalhousie University, Halifax, Nova Scotia B3H 1Z9, Canada 4School of GeoSciences, The University of Edinburgh, Edinburgh EH9 3JN, UK
5AEROCAN, Environment Canada, Egbert, Ontario L0L 1N0, Canada
6Department of Chemistry and Biochemistry, Old Dominion University, Norfolk, Virginia 23529, USA 7Department of Chemistry, University of York, Heslington, York YO10 5DD, UK
8UPMC Univ. Paris 06, Université Versailles St.-Quentin, CNRS/INSU, LATMOS-IPSL, Paris, France
9Spectroscopie de l’atmosphère, Chimie Quantique et Photophysique, Université Libre de Bruxelles, Brussels, Belgium 10Marine Meteorology Division, Naval Research Laboratory, Monterey, California 93943, USA
11CARTEL, Université de Sherbrooke, 2500, boulevard de l’Université, Sherbrooke, Québec J1K 2R1, Canada *now at: European Centre for Medium-Range Weather Forecasts, Shinfield Park, Reading, RG2 9AX, UK
Correspondence to: K. A. Walker ([email protected])
Received: 28 March 2013 – Published in Atmos. Chem. Phys. Discuss.: 24 April 2013 Revised: 19 August 2013 – Accepted: 27 August 2013 – Published: 18 October 2013
Abstract. We present the results of total column
measure-ments of CO, C2H6 and fine-mode aerosol optical depth
(AOD) during the “Quantifying the impact of BOReal for-est fires on Tropospheric oxidants over the Atlantic using
Aircraft and Satellites” (BORTAS-B) campaign over eastern
Canada. Ground-based observations, using Fourier transform spectrometers (FTSs) and sun photometers, were carried out in July and August 2011. These measurements were taken in Halifax, Nova Scotia, which is an ideal location to moni-tor the outflow of boreal fires from North America, and also in Toronto, Ontario. Measurements of fine-mode AOD en-hancements were highly correlated with enen-hancements in co-incident trace gas (CO and C2H6) observations between 19
and 21 July 2011, which is typical for a smoke plume event. In this paper, we focus on the identification of the origin and the transport of this smoke plume. We use back trajectories calculated by the Canadian Meteorological Centre as well as FLEXPART forward trajectories to demonstrate that the
enhanced CO, C2H6and fine-mode AOD seen near Halifax
and Toronto originated from forest fires in northwestern On-tario that occurred between 17 and 19 July 2011. In addi-tion, total column measurements of CO from the satellite-borne Infrared Atmospheric Sounding Interferometer (IASI) have been used to trace the smoke plume and to confirm the origin of the CO enhancement. Furthermore, the enhance-ment ratio – that is, in this case equivalent to the emis-sion ratio (ERC2H6/CO) – was estimated from these
ground-based observations. These C2H6emission results from boreal
fires in northwestern Ontario agree well with C2H6
emis-sion measurements from other boreal regions, and are rel-atively high compared to fires from other geographical re-gions. The ground-based CO and C2H6 observations were
compared with outputs from the 3-D global chemical trans-port model GEOS-Chem, using the Fire Locating And Mod-eling of Burning Emissions (FLAMBE) inventory. Agree-ment within the stated measureAgree-ment uncertainty (∼ 3 % for
CO and ∼ 8 % for C2H6) was found for the magnitude of
the enhancement of the CO and C2H6total columns between
the measured and modelled results. However, there is a small shift in time (of approximately 6 h) of arrival of the plume over Halifax between the results.
1 Introduction
Large amounts of trace gases as well as aerosols are released from biomass burning. These emissions affect air quality and tropospheric and stratospheric chemistry, which has an im-portant impact on the radiative transfer in the atmosphere (Crutzen and Andreae, 1990). The emissions from biomass burning can be transported thousands of miles downwind, and thus boreal fires in North America can affect the air quality in Europe (Derwent et al., 2004). It has been found that the North American emissions, both natural and anthro-pogenic (Li et al., 2002), have a significant impact on the air quality in Europe. While the impact of anthropogenic emis-sions have been studied previously (Li et al., 2002; Stohl and Trickl, 1999), the impact from North American boreal fires is not as well known.
There are several species of interest which are present in boreal fire plumes and are indicators of smoke plumes (Tereszchuk et al., 2011); however, we will focus in our study on carbon monoxide (CO) and ethane (C2H6) as well as
fine-mode aerosols. All of these species have a relatively long lifetime in the troposphere and can, therefore, be detected up to several thousand kilometres away from the fire source. CO and C2H6generally have a lifetime between 1 and 3 months,
which is primarily limited by oxidation by the hydroxyl radi-cal (OH) (Volz et al., 1981; Rudolph and Ehhalt, 1981). Fine-mode (sub-micron) aerosols have a shorter lifetime that is dependent upon their size, latitudinal location and altitude in the atmosphere. In the troposphere, fine-mode aerosols of a medium size (approximately 0.15 µm) are removed from the troposphere by wet deposition, and thus their lifetime is limited by precipitation. The average lifetime is approx-imately 3–5 days at mid-latitudes (Edwards et al., 2006). Smaller aerosols, with sizes of the order of 0.01 µm, coag-ulate first to larger particles, and are then removed by wet deposition. The different trace gases, as well as aerosols, are emitted simultaneously during a biomass burning event; therefore, the enhancements in the total columns of the emit-ted gases will correlate quite well until the various lifetimes of the gases or aerosols cause the correlation to break down (Paton-Walsh et al., 2008). Therefore, trace gases (CO and C2H6) and the fine-mode aerosol optical depth (AOD) should
be highly correlated within fire plumes that are less than 3–5 days old (where this is limited by the lifetime of the aerosols). A number of previous studies have focused on the emis-sion factors (EFs) and emisemis-sion ratios (ERs) of several trace gases during biomass burning events. Emission ratios are
used in model simulations, and have a significant influence on the output of atmospheric models. The work of An-dreae and Merlet (2001) identifies emission factors and ra-tios for almost 100 species for different geographical regions, which are commonly used for model simulations. Akagi et al. (2011) published an update to this paper, which has a finer categorization of fire regions, and combines laboratory ex-periments with field measurements from aircraft and ground-based instruments. Significant differences in the emission ra-tio and therefore in the emission factor of C2H6have been
found for biomass burning for different geographical regions. As an example, the emissions of C2H6from Australian and
African bush fires are comparatively low (Paton-Walsh et al., 2005; Sinha et al., 2003), whereas C2H6emissions from
bo-real and temperate fires seem to be comparatively high (Ak-agi et al., 2011). The variability and the uncertainty of these emission ratios is quite high, even within a precisely defined area. Differences can occur for the same fire events, which are likely due to different emissions into different altitudes; as such, aircraft and satellite measurements can differ from ground-based in situ observations (Akagi et al., 2011).
In this work, we use ground-based Fourier transform spec-trometer (FTS) and sun photometer measurements to inves-tigate in a case study of a boreal fire plume in July 2011. These measurements have been taken as part of the “Quanti-fying the impact of BOReal forest fires on Tropospheric ox-idants over the Atlantic using Aircraft and Satellites” (BOR-TAS) project. BORTAS was a 4 yr project, including a 2 yr measurement phase which was carried out during July and August of 2010 and 2011 (phases A and B, respectively). It is currently the most recent campaign that focussed on the impact of North American boreal fires on tropospheric com-position and their influence on European air quality. Further details on the campaign can be found in Palmer et al. (2013). Ground-based measurements during this campaign were pri-marily taken at the Dalhousie Ground Station (DGS). This facility was located on the roof of the Sir James Dunn build-ing at Dalhousie University (44.64◦N, 63.59◦W, 65 m a.s.l.) in Halifax, Nova Scotia, Canada. As part of the DGS, two FTSs and a CIMEL sun photometer were operated simulta-neously. Having these co-located instruments facilitates the comparison and evaluation of the correlation between CO, C2H6and AOD. During the BORTAS-B campaign in 2011,
enhancements of CO, C2H6and the fine-mode AOD could be
detected on three days: 19, 20 and 21 July 2011. On the same days, enhancements in C2H6 were detected over Toronto
by the FTS located at the University of Toronto Atmo-spheric Observatory (TAO: 43.66◦N, 79.40◦W, 174 m a.s.l.)
in Toronto, Ontario, Canada.
This paper investigates the boreal fire plume which passed over Halifax and Toronto between 19 and 21 July 2011. We use back trajectories calculated by the Canadian Meteoro-logical Centre (CMC) and FLEXPART forward trajectories, as well as CO total column measurements from the satellite-borne Infrared Atmospheric Sounding Interferometer (IASI),
to show that these enhancements originated from boreal fires in northwestern Ontario between 17 and 19 July 2011. In this study, the emission ratio and emission factor of C2H6 are
calculated from ground-based FTS measurements and com-pared to two recent studies (within the BORTAS project) of the emission ratio and emission factor from airborne and satellite observations (Lewis et al., 2013; Tereszchuk et al., 2013). Furthermore, this paper compares results from the chemical transport model GEOS-Chem to the ground-based FTS observations.
This paper is organized as follows. Subsequent to this troduction, the second section introduces the different in-struments and measurement sites used in the campaign, data analysis and the retrieval methods. In the third section, the measurement time series are presented, and the retrievals are compared with the other instruments. The fourth sec-tion discusses the results of this study. Here, the transport and origin of the smoke plume are identified using model simulations (CMC, FLEXPART). Furthermore, the correla-tion between the trace gases and the fine-mode AOD as well as the emission factors from our ground-based observations and the comparison between these observations and GEOS-Chem simulations are discussed. This is followed by a sum-mary of our results in the last section.
2 Methodology and datasets
For the analysis of the smoke plume observed during the BORTAS-B campaign in July 2011, we use measurements taken in Halifax and Toronto. This section focuses on the in-struments, retrieval processes and the methods used for the instrument comparisons, as well as on the chemical trans-port model GEOS-Chem, to which the observations are com-pared.
The observations were taken at DGS using two FTSs (the Portable Atmospheric Research Interferometric Spec-trometer for the Infrared (PARIS-IR) and the Dalhousie At-mospheric Observatory DA8; herein the DAO-DA8) and a CIMEL sun photometer. Additionally, observations from a second DA8 (TAO-DA8) and a second CIMEL sun pho-tometer were used, both of which are located in Toronto. However, these two instruments are not co-located. The TAO-DA8 is operated at the University of Toronto, while the sun photometer is located at Environment Canada (43.97◦N, 79.47◦W, 300 m a.s.l.). These ground-based FTSs are
dedi-cated to infrared solar absorption measurements from direct sunlight. For these observations, a solar beam is directed into each instrument using a suntracking mirror system located on the roof of the building. Details of each of the instruments and the data analysis technique are given below.
2.1 The Portable Atmospheric Research Interferometric Spectrometer for the Infrared (PARIS-IR)
PARIS-IR is a ground-based FTS which is based on the design of the Atmospheric Chemistry Experiment Fourier Transform Spectrometer (ACE-FTS) (Fu et al., 2007). It measures atmospheric solar absorption spectra between 750 and 4400 cm−1, and operates at a maximum spectral res-olution of 0.02 cm−1 (at a maximum optical path differ-ence (MOPD) of ±25 cm). Interferograms are recorded using liquid-nitrogen-cooled mercury cadmium telluride (HgCdTe) and indium antimonide (InSb) detectors config-ured in a sandwich arrangement. The beam splitter is made from zinc selenide (ZnSe). No filters are used, which means that the entire spectral range (750–4400 cm−1) is measured simultaneously for each observation. No apodization is ap-plied to the spectra. Each measurement, which is comprised of 20 co-added spectra, is taken approximately every 7 min (Sung et al., 2007). Therefore, CO is measured every 7 min throughout the campaign whenever weather conditions are favourable. Due to the high water vapour absorption over Halifax and the spectral resolution of 0.02 cm−1, it is not pos-sible to retrieve C2H6total columns reliably from the
PARIS-IR spectra taken at DGS.
2.2 ABB Bomem DA8 FTSs
The DAO-DA8 FTS at DGS is a vertically aligned Michel-son interferometer (Franklin et al., 2013). It is equipped with InSb and HgCdTe detectors and a potassium bromide (KBr) beam splitter to provide spectral coverage between 750 and 4500 cm−1. Its maximum spectral resolution is 0.004 cm−1 (at a MOPD of 250 cm). Six narrow-band filters (typically 700–1000 cm−1in width) are used to improve the signal-to-noise ratio (SNR) of the spectra. Depending on the filter used, typically four to six spectra are co-added. Measurements us-ing one filter are taken over approximately 6 min. Due to the different narrow band filters, CO (filter 4: 2000–2700 cm−1) and C2H6(filter 3: 2400–3100 cm−1) are measured
approxi-mately every hour, depending on the weather conditions. A second, very similar DA8 is operated at the University of Toronto (TAO-DA8) (Wiacek et al., 2007). For this instru-ment, measurements using one filter require approximately 20 min. Therefore, CO (filter 4) and C2H6(filter 3) are
typi-cally measured every 2–3 h, as weather conditions allow.
2.3 Data analysis for the FTS spectra
For these three FTSs, a similar retrieval technique has been applied to estimate the total column amounts from the recorded solar absorption spectra. This retrieval method is based on an optimal estimation method (OEM) (Rodgers, 1976, 2000), where a calculated spectrum is fitted to the ob-served one by adjusting the target trace gas profile. Multiple
microwindows, typically each with a width between 0.3 and 1.0 cm−1, are employed simultaneously in the retrieval pro-cess. This analysis has been applied to the observed spec-tra from the three FTSs described above using the SFIT2 v3.94c retrieval package (Pougatchev et al., 1995, 1996) and the HITRAN 2008 spectroscopic database (Rothman et al., 2009). Total column amounts were calculated from the re-trieved volume mixing ratio (VMR) profiles by integrating the atmospheric density and the trace gas VMR throughout the altitude range (from the ground to 100 km). Due to the lower resolution of PARIS-IR compared to the DA8 FTSs, two different altitude grids have been used for the retrieval. The retrievals performed with spectra from PARIS-IR use a 29-layer grid, and those for the DA8s use a 48-layer grid. It has been shown that this prevents non-physical oscillations in the retrieved profile for the lower resolution FTS, but only results in a very small difference in the total columns (be-tween 0.1 and 0.6 % depending on the retrieved gas) (Wunch et al., 2007). Daily pressure and temperature profiles, spe-cific to each measurement site, are taken from the National Centers for Environmental Prediction (NCEP) re-analyses available through the NASA Goddard Space Flight Cen-ter automailer (http://hyperion.gsfc.nasa.gov/Data_services/ automailer/index.html) and then are linearly interpolated on the desired altitude grid. The a priori profiles of trace gases, which are used for all retrievals, are the mean of a 40 yr run (1980–2020) of the Whole Atmosphere Community Cli-mate Model (WACCM; Eyring et al., 2007) for Halifax and Toronto (J. Hannigan, NCAR, personal communication, 2012), v6 and v5, respectively. The SNR, for the determi-nation of the measurement covariance matrix, is instrument specific, and values are selected for each gas by applying a trade-off curve method described by Batchelor et al. (2009). The microwindows used and interfering trace gases taken into account for the retrieval are listed in Table 1. These are consistent for all of the FTS retrievals, and are based on the Network for Detection of Atmospheric Composition Change (NDACC) standard microwindows. Furthermore, Ta-ble 1 lists the estimated uncertainties as well as the degrees of freedom of signal (DOFS) of each retrieval. The DOFS are defined as the trace of the averaging kernel matrix. The uncertainties are derived using a method similar to that de-scribed by Batchelor et al. (2009) and Sung et al. (2007). The smoothing error, the measurement error and the uncertainties of the line width and line intensity parameters of the retrieved trace gas from HITRAN 2008 (Rothman et al., 2009) are in-cluded in this calculation. Furthermore, the error caused by the uncertainty of the interfering trace gases and that caused by the retrieval parameters, specifically the error due to the temperature uncertainty (2 K) and the uncertainty of the solar zenith angle SZA (0.125◦), are considered. The total uncer-tainty has been estimated by adding all errors in quadrature.
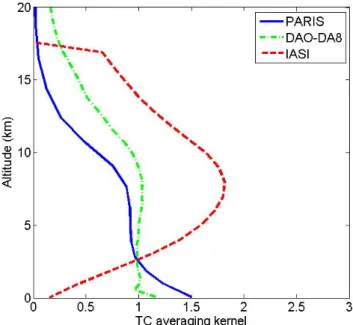
Fig. 1. Typical total column (TC) averaging kernels for CO for
PARIS-IR (solid blue line), DA8 (dot-dashed green line) and IASI during a morning overpass (dashed red line).
2.4 IASI
Launched in October 2006, the IASI instrument onboard the polar-orbiting MetOp-A satellite is a nadir-viewing high-resolution FTS (Clerbaux et al., 2009). It records in-frared emission spectra between 645 and 2760 cm−1 with an apodized spectral resolution of 0.5 cm−1. IASI provides global coverage twice daily.
The IASI CO vertical profiles and total columns are re-trieved with FORLI-CO, which has been developed at the Université Libre de Bruxelles (ULB). Similar to the retrievals for the ground-based FTSs, FORLI-CO uses an OEM based on Rodgers (2000). The spectral range between 2143 and 2181.25 cm−1 is used for the CO retrieval, and it is per-formed on a 19-layer altitude grid (Hurtmans et al., 2012). The CO profiles provide between 1.5 and 2 independent pieces of information (DOFS), for mid-latitudes, for which the uncertainty of the CO retrieval varies between 3 and 9 % (George et al., 2009; Turquety et al., 2009). The IASI CO output has previously been used to detect the CO emission caused by fires (e.g. Krol et al., 2013).
For this study, total column CO from IASI has been used. For the comparisons shown here, all satellite measurements within a longitudinal and latitudinal area of ±0.5◦ (approxi-mately ±55 km) around the ground-based measurement site have been used.
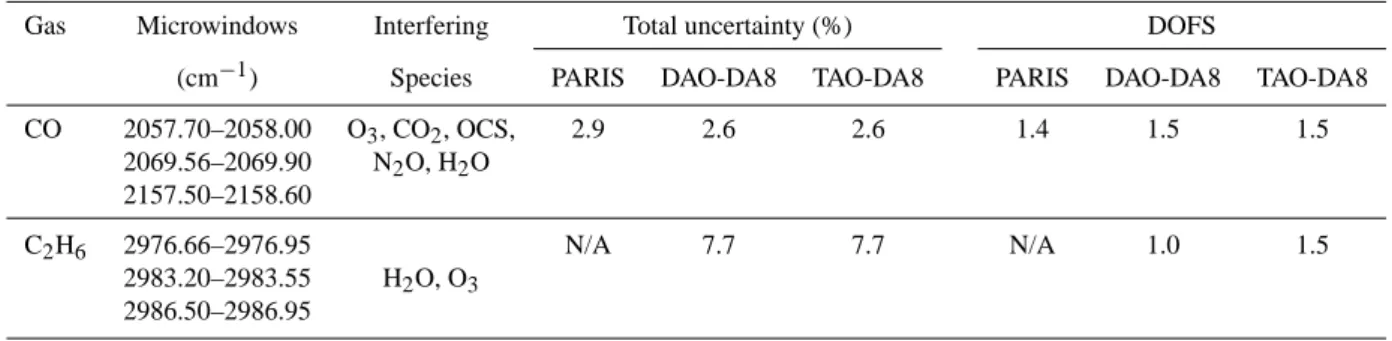
Table 1. Summary of retrieval microwindows and interfering species, with an estimate of the uncertainty of the retrieval and DOFS for each
FTS. In each retrieval, multiple microwindows are fitted simultaneously as listed in the table below. For the calculation of the total uncertainty and contributions, see the description given in the text.
Gas Microwindows Interfering Total uncertainty (%) DOFS
(cm−1) Species PARIS DAO-DA8 TAO-DA8 PARIS DAO-DA8 TAO-DA8
CO 2057.70–2058.00 O3, CO2, OCS, 2.9 2.6 2.6 1.4 1.5 1.5 2069.56–2069.90 N2O, H2O 2157.50–2158.60 C2H6 2976.66–2976.95 N/A 7.7 7.7 N/A 1.0 1.5 2983.20–2983.55 H2O, O3 2986.50–2986.95 2.5 Intercomparison between FTSs
The effect of the different resolutions of the FTSs is ac-counted for in this study. Generally, for lower resolution spectrometers, the retrievals have lower vertical resolution (fewer DOFS), which means the profile typically corre-sponds to a total column. The total column averaging ker-nels of typical PARIS-IR, DAO-DA8 and IASI CO retrievals are shown in Fig. 1. PARIS-IR is sensitive to CO in the low-est layers of the atmosphere between approximately 0 and 10 km, whereas the DAO-DA8 is sensitive between approxi-mately 0 and 15 km. The averaging kernels demonstrate that the ground-based instruments have the highest sensitivity to CO in the layers close to the surface, where IASI has the highest sensitivity towards CO between approximately 5 and 15 km.
The effect of the different averaging kernels on the to-tal columns can be accounted for using a similar method to Rodgers and Connor (2003). The profile xh, retrieved by the
spectrometer, having higher vertical sensitivity (DAO-DA8 and IASI), is linearly interpolated onto the PARIS-IR re-trieval grid and smoothed with its averaging kernel, A, and a priori profile, xa, using
xsmooth=xa+A · (xh−xa). (1)
The total column for these smoothed profiles has been calcu-lated from the smoothed VMR profile xsmoot hand the
atmo-spheric density using the same method as for the unsmoothed profiles (see Sect. 2.3).
2.6 AEROCAN/AERONET
The ground-based AOD measurements were obtained by AEROCAN, a Canadian subnetwork of the AErosol RObotic NETwork (AERONET) (Holben et al., 1998). Data across the network are acquired by a CIMEL Electronique 318A sun photometer. Direct sunlight measurements are taken across eight narrow spectral bands in the ultraviolet, visible and near-infrared spectral region. The typical time interval
be-tween measurements is 3 min for AEROCAN measurements under favourable weather conditions.
The fine- (sub-micron) and coarse- (super-micron) mode AOD are obtained from these measurements using a spec-tral deconvolution algorithm developed by O’Neill et al. (2003), which is applied to a five-wavelength subset of the CIMEL bands (380, 440, 500, 675 and 870 nm). The en-hancement of fine-mode AOD is a signature indicator of smoke events, which makes it possible to study the enhance-ment of aerosols associated with the boreal fire plumes, while excluding AOD enhancements due to super-micron aerosols and clouds (identified by an enhancement of coarse-mode AOD). The errors of the fine-mode AOD were computed using the error model defined in O’Neill et al. (2003), and are based on an average pan-spectral AOD error of 0.01. The estimated total errors for the fine-mode AOD are typi-cally between 15 and 30 %. Level 1.0 (non-cloud-screened) data were employed for this analysis (data which were cor-rected for post-season recalibration). While the issue of cloud screening is less problematic for fine-mode data, use of these retrievals avoids the accidental “cloud screening” of highly variable smoke AODs that can be induced by the standard, temporally based AERONET cloud-screening algorithm.
2.7 GEOS-Chem global 3-D chemistry transport model
GEOS-Chem is a global 3-D chemical transport model that utilizes assimilated meteorological fields from the NASA Goddard Earth Observing System (GEOS) (Bey et al., 2001). As was used by Parrington et al. (2012), we use v8-02-04 of GEOS-Chem with a horizontal resolution of 2◦latitude ×
2.5◦ longitude, 48 vertical levels and hourly output. The
GEOS-5 meteorological fields employed here have a hori-zontal resolution of 0.5◦latitude × 0.67◦ longitude, 72 ver-tical levels (from the surface up to 0.01 hPa) and a tempo-ral resolution of 6 h (3 h for surface variables). The biomass burning emissions are taken from the Fire Locating And Modeling of Burning Emissions (FLAMBE) inventory (Reid et al., 2009). The carbon emissions from FLAMBE have been aggregated to a 1◦×1◦horizontal grid globally, which
are then re-gridded to the resolution of GEOS-Chem. For the model simulation, individual aerosol and trace gases from biomass burning emissions are scaled with the emission fac-tors from Andreae and Merlet (2001).
In this study, we examine the model results in three nearby grid boxes. This is done because Halifax is located in the northwest corner of a GEOS-Chem grid box. Therefore, the results of the grid box including Halifax and the ones to the north and the west are presented below.
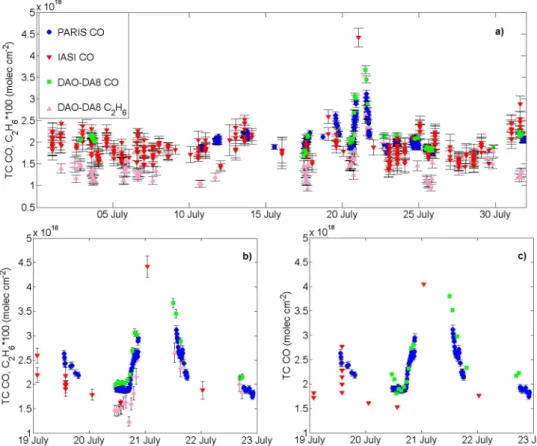
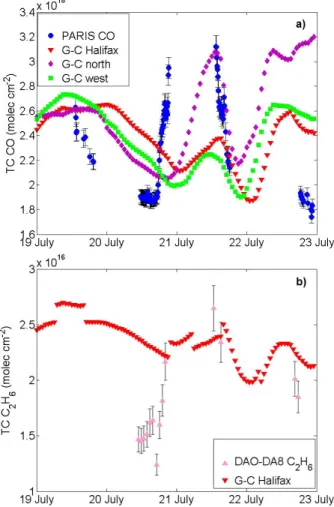
3 FTS measurements of CO and C2H6during July 2011 Figure 2a shows the Halifax time series (for July 2011) of the total column CO observed by PARIS-IR, DAO-DA8 and IASI, and the total column C2H6from DAO-DA8. The
estimated total uncertainties are also shown as black bars (as listed in Table 1 and in Sect. 2.4 for the ground-based FTSs and IASI, respectively). The measurements from the ground and the satellite show a consistent enhancement of CO and C2H6 over Halifax on 19, 20 and 21 July 2011
(shown in Fig. 2b). The columns of CO and C2H6, seen on
20 and 21 July, are significantly enhanced compared to the background values of approximately 1.8 × 10¹⁸molec cm−2 and 1.1 × 10¹⁶molec cm−2, respectively. These background columns are based on average values for July 2011 over Hali-fax from the based FTSs. The majority of the ground-based observations from the two FTSs agree well within the estimated uncertainties. For coincident measurements (1t ≤ 5 min) during July 2011, the mean relative difference between DAO-DA8 and PARIS-IR total column CO mea-surements is −4.9 ± 0.7 %. This difference was calculated as ([PARIS − DAO-DA8]/[0.5 · (PARIS + DAO-DA8)]) us-ing around 150 pairs of measurements. The mean relative difference between PARIS-IR and IASI total column CO is 7.5 ± 1.6 % for July 2011. This was calculated as ([PARIS − IASI]/[0.5 · (PARIS + IASI)]) using about 40 pairs of coinci-dent measurements (1t ≤ 15 min). During the period of the enhanced CO columns, between 19 and 23 July, the mean dif-ference between PARIS-IR and DAO-DA8 is −9.9 ± 0.7 % (using around 25 pairs). For PARIS-IR and IASI measure-ments taken over the same time period, the mean relative difference in total column CO is 19.2 ± 1.6 % (calculated as described above), using seven pairs of measurements of co-incident measurements (1t ≤ 15 min). The uncertainty given is the standard error for each calculation.
A more adequate comparison has been made by “smooth-ing” the retrieved profiles in order to account for the different sensitivities of the spectrometers, as described in Sect. 2.5. The CO total columns from PARIS-IR, DAO-DA8 and IASI, the latter two having been smoothed with PARIS-IR’s aver-aging kernel and a priori profile, are shown in Fig. 2c. This shows an improved agreement between these two ground-based FTSs, as well as IASI, compared to the unsmoothed columns, which is shown in Fig. 2b. The mean relative
dif-ference in the total column CO between DAO-DA8 and PARIS-IR (as calculated above) reduces to −3.5 ± 0.7 % for July and to −4.0 ± 1.2 % during the enhancement period (mean ± standard error), respectively, after the smoothing procedure, using the same pairs of measurements as above. The differences between the total columns measured by two ground-based FTSs are very small and within the combined estimated uncertainties after the smoothing procedure (see Table 1). The mean relative difference between the total col-umn CO results from PARIS-IR and IASI (calculated as above for 19–23 July) decreases to 6.6 ± 1.8 % for July and 11.7 ± 5.1 % during the enhanced period (mean ± standard error) after the smoothing procedure, using the same pairs of measurements as above. After taking the different sensitivi-ties of the instruments into account using the averaging ker-nels, the difference between the total column CO of PARIS-IR and IASI is smaller and within the estimated uncertainty of IASI (3–9 %; see Sect. 2.4). Kerzenmacher et al. (2012) found slightly smaller mean differences (typically between
±2 %) between ground-based FTS measurements and IASI for three different mid-latitude NDACC FTS sites. The rela-tively large mean difference and the high standard deviation (±13 %) for the comparison between PARIS-IR and IASI is possibly due to the small number of pairs which have been used for this calculation; Kerzenmacher et al. (2012) used over 1000 pairs of total and partial columns from each mea-surement site to compare with IASI.
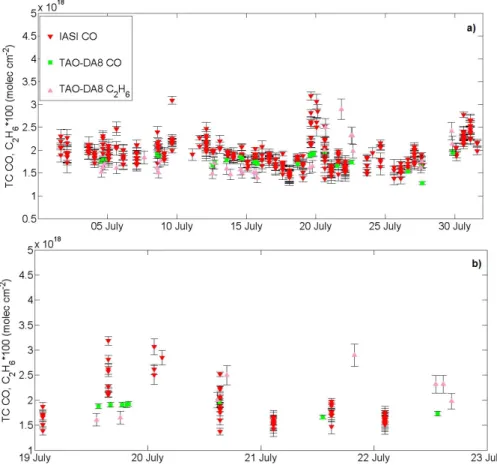
The time series of total column CO and C2H6 from the
TAO-DA8 and IASI total column CO at Toronto are shown in Fig. 3a. Observations made over Toronto show enhance-ments of CO on 19 and 20 July, and enhanceenhance-ments of C2H6
on 21 and 22 July 2011 (shown in Fig. 3b). These are the same days when the columns observed in Halifax were en-hanced. On 21 July, the total column C2H6is almost twice
as much as the typical background amount in Toronto (∼ 1.5×10¹⁶molec cm−2, based on July 2011 average). The CO total columns from the TAO-DA8 do not show a strong en-hancement, which is due to the limited number of observa-tions in this period; only three CO measurements are avail-able between 20 and 22 July 2011. Slightly enhanced CO columns were detected by IASI near Toronto on 19 July and early in the morning on 20 July 2011. The CO enhancement on 19 and 20 July near Toronto is not as large as that detected near Halifax. Very little or no enhancement was seen on the other days in July 2011. The total column CO from IASI agrees with the ground-based observations from TAO-DA8 within the estimated uncertainties (see Table 1 and Sect. 2.4) on 20 and 21 July; however, on 19 July, IASI detects en-hanced CO columns, which are not picked up by the ground-based measurements. However, the lowest detected IASI CO columns at this time are almost within the combined esti-mated uncertainties of the two instruments.
Fig. 2. The total column measurements (TC) in Halifax are shown for CO and C2H6for (a) July 2011, (b) between 19 and 23 July 2011, and (c) CO total columns of DAO-DA8 and IASI smoothed with the PARIS-IR averaging kernel. PARIS-IR (blue dots), IASI (red inverted
triangles), DAO-DA8 (green squares) total columns for CO, and DAO-DA8 total columns for C2H6(pink triangles) are shown. The labels
on the x axes indicate the start of each day at 00:00 UTC. Note that the C2H6columns are scaled by a factor of 100 in panels (a) and (b).
The black bars indicate the estimated uncertainties for each gas and instrument, as described in Table 1 and Sect. 2.4.
4 Results and discussion
Enhancements of CO and C2H6 as seen in the observations
from the ground-based FTSs and IASI over Halifax and Toronto are usually indicators of smoke plumes. To identify where this smoke originated, satellite-based measurements of fire hotspots during this time period, as well as trajectory calculations from CMC and FLEXPART, have been used. This section also includes a regression analysis for CO and C2H6 with respect to the fine-mode AOD, an estimate of
the C2H6 emission ratio and factor, and a comparison with
GEOS-Chem.
4.1 Origin of the enhanced trace gas columns
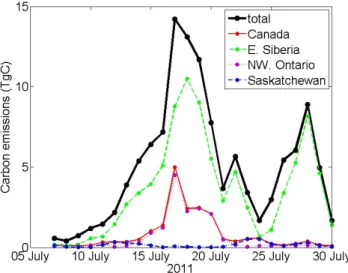
The FLAMBE inventory (Reid et al., 2009) was used to esti-mate the location and the total carbon emissions from boreal fires during the BORTAS-B campaign in 2011. This inven-tory provides hourly estimates of carbon and aerosol emis-sions based on observations from the Geostationary Opera-tional Environmental Satellite (GOES) platforms and the two Moderate Resolution Imaging Spectrometers (MODIS) on the NASA EOS Terra and Aqua satellites. Figure 4 shows the
daily carbon emissions obtained from the combined GOES and MODIS dataset between 7 July and 31 July 2011 from boreal fire regions (≥ 50◦N). The majority of boreal fire emissions from 17 to 20 July originated from fires in eastern Siberia and Canada, where emissions from northwestern On-tario essentially dominate the total Canadian emissions. The carbon emission from boreal fires in northwestern Ontario peaks on 17 July 2011 at a value of approximately 5 Tg C. At the same time, carbon emissions from eastern Siberia reach values of over 10 Tg C. Assuming a wind speed of 10– 15 m s−1, the approximate time it takes for smoke plumes originating from eastern Siberia and northwestern Ontario to reach Halifax is of the order of one week and 1–2 days, re-spectively.
Figure 5 shows an ensemble of back trajectories from Environment Canada’s CMC long-range transport model (D’Amours and Pagé, 2001; D’Amours, 1998). These model outputs are provided in 6 h intervals over a 72 h period, and illustrate the origin of the air parcel overpassing Halifax at 18:00 UTC on 19 to 22 July 2011 at altitudes between 1 and 10 km. Between 19 and 21 July 2011, the air parcels at alti-tudes between 3 and 5 km originate from the area of forest
Fig. 3. The total column (TC) measurements in Toronto are shown for CO and C2H6for (a) July 2011 and (b) between 19 and 22 July 2011.
CO from TAO-DA8 (green squares), CO from IASI (red inverted triangles), and C2H6from TAO-DA8 (pink triangles) are shown. The labels
on the x axes indicate the start of the day at 00:00 UTC. Note that the C2H6columns are scaled by a factor of 100. The black bars indicate
the estimated uncertainties for each gas and instrument, as described in Table 1 and Sect. 2.4.
fires. According to these trajectory calculations, it took ap-proximately 36 h ± 6 h, depending on the altitude of the air parcel, for the air parcel from the fire region in northwestern Ontario (50◦–55◦N, 95◦–80◦W) to arrive over Halifax. On
22 July 2011, the CMC back trajectories show that the tropo-spheric air parcels originated from an area south of the forest fires (Fig. 5d). This is consistent with our observations that no enhancement of CO or C2H6was detected in Halifax in
the evening of 22 July (see Fig. 2).
Further evidence of the origin of the CO and C2H6
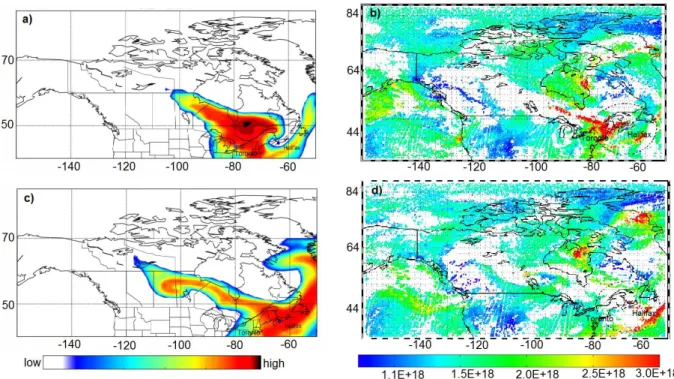
en-hancement between the 19 and 21 July 2011 can be seen in the FLEXPART forward trajectories, as well as IASI CO to-tal columns. FLEXPART is a Lagrangian particle dispersion model, which was developed at the Norwegian Institute for Air Research (Stohl et al., 1998). FLEXPART was used to simulate forward trajectories for a constant particle release starting on 17 July 2011 at 12:00 UTC in northwestern On-tario (a continuous animation is available as supplementary material). Figure 6a and c show the results of this simula-tion at 15:00 UTC on 20 July 2011 and 21 July 2011, respec-tively. The forward trajectories from FLEXPART are con-sistent with the ground-based measurements, where small
enhancements of CO and C2H6 occur on 19 July, followed
by stronger enhancements on 20 (after 18:00 UTC) and 21 July 2011 in Halifax; and enhancements of C2H6are seen in
Toronto on 19 and 20 July 2011. The IASI CO total columns for the morning overpass (approximately 14:00 UTC) are shown in Fig. 6b and d for 20 July and 21 July 2011, re-spectively. The CO enhancements near Halifax seen from IASI show a similar pattern to the simulated trajectories from FLEXPART and support the assertion that these enhance-ments originated from the forest fires in northwestern On-tario.
4.2 Correlation between column amounts of trace gases and fine-mode AOD
As described in Sect. 1, trace gases, such as CO and C2H6
and the fine-mode AOD, emitted from biomass burning, are highly correlated for plumes younger than the lifetime of the aerosols, so approximately 5 days. Figure 7a shows the total column CO from PARIS-IR, the total column C2H6
from DAO-DA8 and measurements of fine-mode AOD, be-tween 19 and 22 July 2011 at DGS. It can be seen that
Fig. 4. Daily distribution of carbon emissions from the FLAMBE
inventory based on fire information from MODIS and GOES. The traces show the daily total carbon emitted from all boreal
fire regions (≥ 50◦N, thick black line), for all of Canada (50◦–
75◦N, 170◦–50◦W, thin red line), northwestern Ontario (50◦–
55◦N, 95◦–80◦W, dotted purple line), Saskatchewan (55◦–65◦N,
120◦–105◦W, dot-dashed blue line), and eastern Siberia (50◦–
75◦N, 110◦–179◦E, dashed green line).
the fine-mode AOD is enhanced during this time period, with a maximum of approximately 1 on 21 July. The typ-ical background fine-mode AOD is approximately 0.05 at the DGS (based on July 2011 average background). Plots of the correlation between total column CO from PARIS-IR and total column C2H6 from DAO-DA8 with
simulta-neous, co-located measurements of the fine-mode AOD are shown in Fig. 7b and c, respectively. For these plots, the maximum temporal difference is less than 5 min between the measurements from the FTSs and the sun photometer. The points in Fig. 7b and c are colour coded to identify each of the days between 17 and 25 July 2011. These cor-relation plots show two different behaviours in the trace gas and fine-mode AOD enhancements. Most of the days show a similar relationship between the trace gases and AOD. However, on 20 July, the CO and C2H6 columns are high
but the AOD is not significantly enhanced. The reason for this is likely a precipitation event (Franklin et al., 2013) in which most aerosols were removed, while the trace gas col-umn stayed enhanced. After excluding data from this day, the simultaneous CO columns and the fine-mode AOD are highly correlated (R2≈0.8), with a slope of (1.22 ± 0.04) × 1018molec cm−2per unit increase in fine-mode AOD and an intercept of (1.76 ± 0.01) × 1018molec cm−2. More than 200 pairs, shown in Fig. 7b, were included in this calculation. Ex-cluding the measurements from 20 July, the C2H6 columns
measured by DAO-DA8 and simultaneous fine-mode AOD measurements are correlated (R2≈0.7) with a slope of
(1.6 ± 0.2) × 1016molec cm−2per unit increase in fine-mode
AOD and an intercept of (1.0 ± 0.1) × 1016molec cm−2, as shown in Fig. 7c. This lower correlation constant is possibly due to the limited number of enhanced C2H6measurements
from DAO-DA8, which makes it more difficult to determine the correlation of C2H6 against the fine-mode AOD. There
are only 27 measurements of C2H6 available, which were
taken between 17 and 25 July 2011. Of these, there are only two measurements which were taken when the smoke plume passed over Halifax on 21 July 2011.
In Toronto, only seven C2H6measurements are available
during this period. The enhancement seen in both the C2H6
total column and the fine-mode AOD is not as strong as in Halifax. The slope, obtained from a correlation plot of these results, suggests a similar trend between the C2H6and
fine-mode AOD as was seen in Halifax. However, there are not enough data available to analyse the correlation quantita-tively.
4.3 Estimation of emission ratio and equivalent emission factor for C2H6
Trace gas concentrations from biomass burning plumes can vary significantly over a short period of time. However, the overall ratio between constituents within the plume is con-stant if no chemical reactions occur. Therefore, the concen-trations of these trace gases are typically converted into rel-ative emission ratios. These emission ratios are relrel-ative to a non-reactive co-emitted tracer, typically either CO or CO2.
Here, we use CO as a reference gas to estimate the emis-sion ratio and emisemis-sion factor of C2H6from the boreal fire in
northwestern Ontario.
The emission ratio is defined as the excess amount of a trace gas, in this case C2H6, over its background level
di-vided by the excess amount of CO over its background level (Andreae and Merlet, 2001). Typically, emission ratios are measured at the fire source. The emission ratio measured fur-ther away from the source is called the enhancement ratio (Hobbs et al., 2003). However, since C2H6 is a long-lived
species, the difference between the emission ratio and the enhancement ratio is negligible for a smoke plume that is ap-proximately 1.5 days old (as estimated in Sect. 3). The emis-sion ratio could also be obtained from the correlation slope between CO and C2H6. Here we calculate the emission
ra-tio from the excess amounts of the trace gases, since there are not enough coincident measurements of CO and C2H6
available to get a reliable correlation coefficient.
For this estimation, the background levels for CO and C2H6are obtained from the regression plots of the trace gas
columns with respect to the fine-mode AOD (Fig. 7b and c) using a similar method to Paton-Walsh et al. (2005). Further-more, we have used CO columns from PARIS-IR rather than from DAO-DA8 to obtain coincident measurements with a temporal difference less than 5 min. If this calculation was done using only results from DAO-DA8, the temporal differ-ence between the CO and C2H6 measurements would need
Fig. 5. Back trajectories from the CMC transport model. The back trajectories correspond to the origin of the air parcel overpassing Halifax
at 18:00 UTC on (a) 19 July, (b) 20 July, (c) 21 July and (d) 22 July 2011 at altitudes of 10 km (orange crosses), 7 km (blue dots), 5 km (purple plus signs), 3 km (green stars) and 1 km (red dots). The markers indicate the location of the air parcel every 6 h over a 72 h period.
to increase to approximately 30 min. In this time, the trace gas columns can change significantly (see Fig. 2). Further-more, we found that the CO columns from PARIS-IR and DAO-DA8 compare within the estimated uncertainties (see Sect. 3).
For the background level of the fine-mode AOD, we have chosen 0.05 (see Sect. 4.2). However, this value is not very critical for the calculation as it is very low. Our esti-mated background levels are 1.8×10¹⁸molec cm−2and 1.1× 10¹⁶molec cm−2for CO and C2H6, respectively. These
esti-mates agree well with the estiesti-mates of the background level obtained by averaging the background total columns for CO and C2H6in July 2011 (see Sect. 3). For each pair of
coin-cident PARIS-IR CO and DAO-DA8 C2H6columns, we say
that measurements were taken inside the boreal fire plume if the CO total column exceeds 2.2 × 10¹⁸molec cm−2. We di-vide the excess C2H6amounts by the excess CO amounts to
determine the emission ratio. The calculated emission ratio of C2H6is (10 ± 6) × 10−3, which has been calculated from
four measurement pairs (which were taken on 20 and 21 July 2011). This emission ratio ERC2H6/COcan be converted into
an emission factor, EFC2H6, using
EFC2H6=ERC2H6/CO·(MWC2H6/MWCO) ·EFCO, (2)
where MW is the molecular weight of each species. The CO emission factor (in units of g CO per kg charcoal made) EFCO
is taken to be 122 ± 45 g kg−1for extra-tropical forest fires (Akagi et al., 2011). Hence, the emission factor EFC2H6is
de-termined to be 1.35 ± 0.51 g kg−1. This value compares rea-sonably well (within the combined estimated uncertainties) to the result reported by Akagi et al. (2011) for boreal fires (EFC2H6 =1.8 ± 1.2 g kg
−1). This emission factor estimated
by Akagi et al. (2011) has been derived from a combination of ground-based in situ (EFC2H6 =3.0 ± 2.3 g kg
−1) and
air-borne (EFC2H6=0.6 ± 0.3 g kg
−1) measurements.
Emission ratios have been derived from airborne mea-surements (Lewis et al., 2013), as well as from satellite-based observations (Tereszchuk et al., 2013), for the same fire plume from northwestern Ontario during BORTAS-B. Their results for the emission ratio of C2H6 with
re-spect to CO (ERC2H6/CO=(5.1 ± 0.4) × 10
−3(Lewis et al.,
2013) and ERC2H6/CO=(6.8±1.1)×10
−3(Tereszchuk et al.,
2013)) agree within the uncertainties with our estimates from ground-based FTS measurements, and are consistent with the emissions of C2H6 from airborne measurements of boreal
fire plumes (Akagi et al., 2011).
4.4 Comparison between ground-based observations and GEOS-Chem
GEOS-Chem is a valuable tool for evaluating the chemistry within the atmosphere, and is often used to analyse the im-pact of biomass burning on tropospheric chemistry (e.g. Par-rington et al., 2012). Here, we analyse the simulated CO and C2H6 columns from biomass burning using this chemical
Fig. 6. FLEXPART forward trajectories at 15:00 UTC on (a) 20 July and (c) 21 July 2011, for a constant particle release starting on 17 July
2011 at 12:00 UTC. The colour contours are on a relative scale from high (red) to low (blue) low concentrations. IASI CO total columns in
molec cm−2on (b) 20 July and (d) 21 July 2011 for the morning overpass (approximately 14:00 UTC).
how these compare with ground-based measurements in Hal-ifax. We validate the model simulations by using our ground-based measurements during the fire plume event. The model simulation for three nearby grid boxes – over Halifax, west of Halifax and north of Halifax – and the results from PARIS-IR in the period between 19 and 22 July 2011 are shown in Fig. 8a. The GEOS-Chem profiles have been smoothed with the PARIS-IR averaging kernel using the method de-scribed in Sect. 2.5 and integrated to obtain total columns. The agreement between PARIS-IR and the smoothed GEOS-Chem total column CO seems to be best for the GEOS-GEOS-Chem grid box to the north of Halifax. An increase in CO after 18:00 UTC on 20 July 2011 and a decrease on 21 July 2011 can be seen in both the measurements and the model out-put. However, the CO enhancement from the model sim-ulation seems to reach Halifax with a delay of approxi-mately 6 h compared to the measurements. The magnitude of the modelled CO enhancement (peak column of approxi-mately 3.2 × 10¹⁸molec cm−2) compares well with the mea-surements within the stated measurement uncertainty (peak column of (3.12±0.09)×1018molec cm−2) . A possible rea-son for the discrepancy between the measured and simu-lated CO columns is the relatively large grid box of GEOS-Chem, since the intensity of a relatively young fire plume (of a few days) can vary significantly over a relatively small area. GEOS-Chem is currently being used to perform simula-tions at a higher horizontal resolution of 0.5◦latitude×0.67◦ longitude, covering the geographical extent of the BORTAS
aircraft and ground-based measurements. This type of dis-crepancy might be reduced with the high-resolution model simulation, which may lead to a better comparison between the model and the ground-based observations.
The measured C2H6 total columns from the DAO-DA8
and simulated total columns of C2H6from GEOS-Chem are
shown in Fig. 8b. As was done for the CO comparisons, the simulated profiles from GEOS-Chem were smoothed with the DAO-DA8 averaging kernel for C2H6 before
cal-culating the total columns (see Sect. 2.5 for details). The C2H6 columns do not differ significantly for the different
grid boxes, and therefore only the simulation over Halifax is shown. The emission ratio of C2H6used in the GEOS-Chem
simulations (ERC2H6/CO=5.6 × 10
−3, Andreae and Merlet,
2001) is similar to the emission ratio obtained in this study for this boreal fire plume (ERC2H6/CO=(10 ± 6) × 10
−3).
The comparison shows that during the enhanced periods on 20 and 21 July 2011, the simulated C2H6 columns agree
well with the observations within the estimated measurement uncertainty of approximately 8 %. However, the simulated columns are also enhanced earlier on 19 and 20 July 2011.
5 Summary and conclusions
We have presented total column measurements of CO and C2H6, as well as fine-mode AOD, obtained using
Fig. 7. Panel (a) shows total columns for CO from PARIS-IR (blue
circles) and C2H6from DAO-DA8 (pink triangles) over Halifax
be-tween 19 and 22 July 2011 (axis on left). The grey dots correspond to the fine-mode AOD (axis on the right) over Halifax. The labels on the x axis indicate the start of each day at 00:00 UTC. Note that
the C2H6columns are scaled by a factor of 100. Panel (b) shows the
correlation between PARIS-IR CO total columns and the fine-mode
AOD. Panel (c) shows the correlation between DAO-DA8 C2H6
to-tal columns and the fine-mode AOD. In panels (b) and (c), the thick black line corresponds to the linear regression fit (see Sect. 4.2). Note that for this calculation, measurements on 20 July 2011 (red inverted triangles) are excluded. Black bars indicate the estimated uncertainties, as described in Table 1 and Sect. 2.6.
Fig. 8. Panel (a) shows the total column CO from PARIS-IR (blue
circles) and GEOS-Chem for the grid box above Halifax (red in-verted triangles), north of Halifax (purple diamonds) and west of Halifax (green squares) between 19 and 22 July 2011 UTC. Panel
(b) shows the total column C2H6from DAO-DA8 (pink triangles),
and the C2H6 total columns of the GEOS-Chem simulation (red
inverted triangles) above Halifax. Note that the difference between
C2H6for the three GEOS-Chem grid boxes is not significant;
there-fore, only the simulation over Halifax is shown. The profiles from the GEOS-Chem simulations have been smoothed with PARIS (for
CO) and DAO-DA8 (for C2H6) averaging kernels before
calculat-ing the total columns; see Sect. 2.5 for details on the smoothcalculat-ing pro-cedure. The black bars indicate the estimated uncertainty for each gas and ground-based instrument, as listed in Table 1.
sun photometers. Enhancements of the total column CO, C2H6 and the fine-mode AOD could be seen over
Hali-fax on 19, 20 and 21 July 2011. On the same days, en-hancements of these trace gases and the fine-mode AOD could be seen over Toronto. The two ground-based FTSs in Halifax agree well within the estimated uncertainties for the CO total columns, for which the mean difference is much improved once the different vertical sensitivities of the measurements have been considered. The difference be-tween ground-based FTS (PARIS-IR) measurements and the
space-based IASI measurements is improved after applying the smoothing procedure using PARIS-IR’s averaging ker-nel. However, the mean difference and standard deviation are quite large, which is possibly due to the limited coincident measurements (seven coincident measurements) between 19 and 22 July 2011.
During this time period, MODIS and GOES detected fire activities in eastern Siberia and northwestern Ontario. Us-ing CMC back trajectories and FLEXPART forward trajecto-ries, we identified the source of the trace gas enhancements over Halifax and Toronto to be boreal fires in northwestern Ontario. Furthermore, the high correlation between the trace gases and the fine-mode AOD is consistent with our argu-ments concerning the effective lifetimes of smoke aerosols and CO and C2H6 trace gases being less than 5 days. The
transportation time between the source – northwestern On-tario – and Halifax was approximately 36 h according to the simulated trajectories from CMC and FLEXPART.
Our estimated emission ratio and emission factor for C2H6
(ERC2H6/CO=(10±6)×10
−3, EF
C2H6=1.35±0.51 g kg
−1)
for the boreal fire in northwestern Ontario are consistent with other studies. Our values agree within the estimated uncer-tainties with the results from Akagi et al. (2011) (EFC2H6=
1.8 ± 1.2 g kg−1) for the C2H6 emission factor from
bo-real fires, but they are significantly higher compared to other geographical regions, e.g. from Australian wildfires (EFC2H6=0.26 ± 0.11 g kg
−1, Paton-Walsh et al., 2005).
Es-timated emission ratios from the same smoke plume based on airborne as well as satellite measurements (ERC2H6/CO=
(5.1 ± 0.4) × 10−3, Lewis et al., 2013, and ERC2H6/CO=
(6.8 ± 1.1) × 10−3, Tereszchuk et al., 2013) are lower than our results, but agree within the estimated uncertainties.
These results are consistent with the comparison between GEOS-Chem simulations and the FTS observations for the C2H6total columns. Employing an emission ratio of C2H6
with respect to CO of 5.6 × 10⁻³for extra-tropical fires (An-dreae and Merlet, 2001) in the GEOS-Chem simulation, the simulated peak C2H6total columns are similar to the
coinci-dent observed peak values on 20 and 21 July 2011. However, the lower C2H6total columns on 20 July 2011 are not as well
simulated. The transport and chemistry of CO emitted by the boreal fire in northwestern Ontario could be simulated rea-sonably well with GEOS-Chem, as the comparisons between the observed and simulated CO total columns show. We found that the GEOS-Chem grid box north of Halifax rep-resents the observations from the DGS the best. The ground-based FTS measurements and GEOS-Chem agree well in the magnitude of the CO total columns. However, there are dif-ferences in the timing of the enhancement, where the model simulation shows CO enhancements approximately 6 h af-ter the measured total columns CO enhancements on 20 July 2011.
Supplementary material related to this article is available online at http://www.atmos-chem-phys.net/13/ 10227/2013/acp-13-10227-2013-supplement..zip.
Acknowledgements. Funding for this work has been provided by a grant from the Natural Sciences and Engineering Research Council of Canada (NSERC). Funding for the DGS measurements has been provided by NSERC, the Canadian Space Agency (CSA) and Environment Canada (EC). The BORTAS project is funded by the Natural Environment Research Council under grant NE/F017391/1. The TAO measurements were made with support from NSERC, CSA and EC. IASI has been developed and built under the responsibility of the Centre National des Etudes Spatiales (CNES, France). P.-F. Coheur is a Research Associate with Fonds de la Recherche Scientifique (FRS-FNRS); his work is also supported by the Belgian Science Policy Office through ESA-Prodex C4000103226 arrangement. We would like to further acknowledge the LATMOS research group for providing the level 2 IASI CO data. We are also very grateful to AEROCAN (Environment Canada and the Université de Sherbrooke) and AERONET (NASA/GSFC) for their support and commitment to their respective networks, as well as to Mike Boschat for operating the CIMEL in Halifax for many years. We also acknowledge the work of David Waugh and Jacinthe Racine, who carried out the analysis of the CMC back trajectories and provided us with these data.
Edited by: S. Matthiesen
References
Akagi, S. K., Yokelson, R. J., Wiedinmyer, C., Alvarado, M. J., Reid, J. S., Karl, T., Crounse, J. D., and Wennberg, P. O.: Emis-sion factors for open and domestic biomass burning for use in atmospheric models, Atmos. Chem. Phys., 11, 4039–4072, doi:10.5194/acp-11-4039-2011, 2011.
Andreae, M. O. and Merlet, P.: Emission of trace gases and aerosols from biomass burning, Global Biogeochem. Cy., 15, 955–966, 2001.
Batchelor, R. L., Strong, K., Lindenmaier, R. L., Mittermaier, R., Fast, H., Drummond, J. R., and Fogal, P. F.: A new Bruker 125HR FTIR spectrometer for the Polar Environment Atmospheric Re-search Laboratory at Eureka, Canada – measurements and com-parison with the existing Bomem DA8 spectrometer, J. Atmos. Ocean. Technol., 26, 1328–1340, 2009.
Bey, I., Jacob, D. J., Yantosca, R. M., Logan, J. A., Field, B. D., Fiore, A. M., Li, Q. B., Liu, H. Y., Mickley, L. J., and Schultz, M. G.: Global modeling of tropospheric chem-istry with assimilated meteorology: model description and evaluation, J. Geophys. Res.-Atmos., 106, 23073–23095, doi:10.1029/2001JD000807, 2001.
Clerbaux, C., Boynard, A., Clarisse, L., George, M., Hadji-Lazaro, J., Herbin, H., Hurtmans, D., Pommier, M., Razavi, A., Turquety, S., Wespes, C., and Coheur, P.-F.: Monitoring of at-mospheric composition using the thermal infrared IASI/MetOp
sounder, Atmos. Chem. Phys., 9, 6041–6054, doi:10.5194/acp-9-6041-2009, 2009.
Crutzen, P. J. and Andreae, M. O.: Biomass burning in the tropics: Impact on atmospheric chemistry and biochemical cycles, Sci-ence, 250, 1669–1678, 1990.
D’Amours, R.: Modeling the ETEX plume dispersion with the Canadian emergency response model, Atmos. Environ., 32, 4335–4341, 1998.
D’Amours, R. and Pagé, P.: Atmospheric transport models for environmental emergencies, Canadian Meteorological Cen-tre, available at: http://collaboration.cmc.ec.gc.ca/cmc/cmoi/ product_guide/docs/lib/model-eco_urgences_e.pdf, last access: 18 April 2013, 2001.
Derwent, R. G., Stevenson, D. S., Collins, W. J., and Johnson, C. E.: Intercontinental transport and the origins of the ozone observed at surface sites in Europe, Atmos. Environ., 38, 1891–1901, 2004.
Edwards, D. P., Emmons, L. K., Gille, J. C., Chu, A.,
Attie, J.-L., Giglio, L., Wood, S. W., Haywood, J.,
Deeter, M. N., Massie, S. T., Ziskin, D. C., and Drum-mond, J. R.: Satellite-observed pollution from Southern Hemisphere biomass burning, J. Geophys. Res., 111, D14312, doi:10.1029/2005JD006655, 2006.
Eyring, V., Waugh, D. W., Bodeker, G. E., Cordero, E., Akiyoshi, H., Austin, J., Beagley, S. R., Boville, B. A., Braesicke, P., Brühl, C., Butchart, N., Chipperfield, M. P., Dameris, M., Deckert, R., Deushi, M., Frith, S. M., Garcia, R. R., Gettelman, A., Giorgetta, M. A., Kinnison, D. E., Mancini, E., Manzini, E., Marsh, D. R., Matthes, S., Nagashima, T., Newman, P. A., Nielsen, J. E., Paw-son, S., Pitari, G., Plummer, D. A., Rozanov, E., Schraner, M., Scinocca, J. F., Semeniuk, K., Shepherd, T. G., Shibata, K., Steil, B., Stolarski, R. S., Tian, W., and Yoshiki, M.: Multimodel pro-jections of stratospheric ozone in the 21st century, J. Geophys. Res., 112, D16303, doi:10.1029/2006JD008332, 2007.
Franklin, J. E., Griffin, D., Pierce, J. R., Drummond, J. R., Waugh, D. L., Palmer, P. I., Chisholm, L., Duck, T. J., Hopper, J. T., Gibson, M., Curry, K. R., Sakamoto, K. M., Lesins, G. L., Walker, K. A., Dan, L., Kliever, J., and O’Neill, N.: A case study of aerosol depletion in a biomass burning plume over Eastern Canada during the 2011 BORTAS field experiment, Atmos. Chem. Phys., to be submitted, 2013.
Fu, D., Walker, K. A., Sung, K., Boone, C. D., Soucy, M.-A., and Bernath, P. F.: The portable atmospheric research interferomet-ric spectrometer for the infrared, PARIS-IR, J. Quant. Spectrosc. Ra., 103, 362–370, 2007.
George, M., Clerbaux, C., Hurtmans, D., Turquety, S., Coheur, P.-F., Pommier, M., Hadji-Lazaro, J., Edwards, D. P., Worden, H., Luo, M., Rinsland, C., and McMillan, W.: Carbon monoxide dis-tributions from the IASI/METOP mission: evaluation with other space-borne remote sensors, Atmos. Chem. Phys., 9, 8317–8330, doi:10.5194/acp-9-8317-2009, 2009.
Hobbs, P. V., Sinha, P., Yokelson, R. J., Christian, T. J., Blake, D. R., Gao, S., Kirchstetter, T. W., Novakov, T., and Pilewskie, P.: Evolution of gases and particles from a sa-vanna fire in South Africa, J. Geophys. Res., 108, D13, 8485, doi:10.1029/2002JD002352, 2003.
Holben, B. N., Eck, T. F., Slutsker, I., Tanré, D., Buis, J. P., Set-zer, A., Vermonte, E., Reagan, J. A., Kaufman, Y. J., Naka-jima, T., Lavenu, F., Jankowiak, I., and Smirnov, A.: AERONET
– a ferderated instrument network and data archive for aerosol characterization, Remote Sens. Environ., 66, 1–16, 1998. Hurtmans, D., Coheur, P.-F., Wespes, C., Clarisse, L., Scharf, O.,
Clerbaux, C., Hadji-Lazaro, J., George, M., and Turquety, S.: FORLI radiative transfer and retrieval code for IASI, J. Quant. Spectrosc. Ra., 113, 1391–1408, 2012.
Kerzenmacher, T., Dils, B., Kumps, N., Blumenstock, T., Cler-baux, C., Coheur, P.-F., Demoulin, P., García, O., George, M., Griffith, D. W. T., Hase, F., Hadji-Lazaro, J., Hurtmans, D., Jones, N., Mahieu, E., Notholt, J., Paton-Walsh, C., Raffalski, U., Ridder, T., Schneider, M., Servais, C., and De Mazière, M.: Validation of IASI FORLI carbon monoxide retrievals using FTIR data from NDACC, Atmos. Meas. Tech., 5, 2751–2761, doi:10.5194/amt-5-2751-2012, 2012.
Krol, M., Peters, W., Hooghiemstra, P., George, M., Cler-baux, C., Hurtmans, D., McInerney, D., Sedano, F., Bergam-aschi, P., El Hajj, M., Kaiser, J. W., Fisher, D., Yershov, V., and Muller, J.-P.: How much CO was emitted by the 2010 fires around Moscow?, Atmos. Chem. Phys., 13, 4737–4747, doi:10.5194/acp-13-4737-2013, 2013.
Lewis, A. C., Evans, M. J., Hopkins, J. R., Punjabi, S., Read, K. A., Purvis, R. M., Andrews, S. J., Moller, S. J., Carpenter, L. J., Lee, J. D., Rickard, A. R., Palmer, P. I., and Parrington, M.: The influence of biomass burning on the global distribution of se-lected non-methane organic compounds, Atmos. Chem. Phys., 13, 851–867, doi:10.5194/acp-13-851-2013, 2013.
Li, Q., Jacob, D. J., Bey, I., Palmer, P. I, Duncan, B. N., Field, B. D., Martin, R. V., Fiore, A. M., Yantosca, R. M., Parrish, D. D., Simmonds P. G., and Oltmans, S. J. : Transat-lantic transport of pollution and its effect on the surface ozone in Europe and North America, J. Geophys. Res., 107, D13, doi:10.1029/2001JD001422, 2002.
O’Neill, N. T., Eck, T. F., Smirnov, A., Holben, B. N., and Thulasir-aman, S.: Spectral discrimination of coarse and fine mode optical depth, J. Geophys. Res., 108, D17, doi:10.1029/2002JD002975, 2003.
Palmer, P. I., Parrington, M., Lee, J. D., Lewis, A. C., Rickard, A. R., Bernath, P. F., Duck, T. J., Waugh, D. L., Tarasick, D. W., An-drews, S., Aruffo, E., Bailey, L. J., Barrett, E., Bauguitte, S. J.-B., Curry, K. R., Di Carlo, P., Chisholm, L., Dan, L., Forster, G., Franklin, J. E., Gibson, M. D., Griffin, D., Helmig, D., Hop-kins, J. R., Hopper, J. T., Jenkin, M. E., Kindred, D., Kliever, J., Le Breton, M., Matthiesen, S., Maurice, M., Moller, S., Moore, D. P., Oram, D. E., O’Shea, S. J., Owen, R. C., Pag-niello, C. M. L. S., Pawson, S., Percival, C. J., Pierce, J. R., Punjabi, S., Purvis, R. M., Remedios, J. J., Rotermund, K. M., Sakamoto, K. M., da Silva, A. M., Strawbridge, K. B., Strong, K., Taylor, J., Trigwell, R., Tereszchuk, K. A., Walker, K. A., Weaver, D., Whaley, C., and Young, J. C.: Quantifying the im-pact of BOReal forest fires on Tropospheric oxidants over the Atlantic using Aircraft and Satellites (BORTAS) experiment: de-sign, execution and science overview, Atmos. Chem. Phys., 13, 6239–6261, doi:10.5194/acp-13-6239-2013, 2013.
Parrington, M., Palmer, P. I., Henze, D. K., Tarasick, D. W., Hyer, E. J., Owen, R. C., Helmig, D., Clerbaux, C., Bow-man, K.W, Deeter, M. N., Barratt, E. M., Coheur, P.-F., Hurts-mans, D., Jiang, Z., George, M., and Worden, J. R.: The influence of boreal biomass burning emissions on the distribution of tropo-spheric ozone over North America and the North Atlantic during
2010, Atmos. Chem. Phys., 12, 2077–2098, doi:10.5194/acp-12-2077-2012, 2012.
Paton-Walsh, C., Jones, N. B., Wilson, S. R., Haverd, V., Meier, A., Griffith, D. W. T., and Rinsland, C. P.: Measurements of trace gas emissions from Australian forest fires and correlation with coincident measurements of aerosol optical depth, J. Geophys. Res., 110, D24305, doi:10.1029/2005JD006202, 2005.
Paton-Walsh, C., Wilson, S. R., Jones, N. B., and Griffith, D. W. T.: Measurements of methanol emissions from Australian wildfires by ground-based solar Fourier transform spectroscopy, Geophys. Res. Lett., 35, L08810, doi:10.1029/2007GL032951, 2008. Pougatchev, N. S., Connor, B. J., and Rinsland, C. P.: Infrared
mea-surements of the ozone vertical distribution above Kitt Peak, J. Geophys. Res., 100, 16689–16697, 1995.
Pougatchev, N. S., Connor, B. J., Jones, N. B., and Rinsland, C. P.: Validation of ozone profile retrievals from infrared ground-based solar spectra, Geophys. Res. Lett., 23, 1637–1640, 1996. Reid, J. S., Hyer, E. J., Prins, E. M., Westphal, D. L., Zhang, J.,
Wang, J., Christopher, S. A., Curtis, C. A., Schmidt, C. C., Eleu-terio, D. P., Richardson, K. A., and Hoffman, J. P.: Global mon-itoring and forecasting of biomass-burning smoke: Description of and lessons from the Fire Locating And Modeling of Burn-ing Emissions (FLAMBE) program, IEEE J. Select. Topics Appl. Earth Obs. Remote Sens., 2, 144–162, 2009.
Rodgers, C. D.: Retrieval of atmospheric temperature and composi-tion from remote measurements of thermal radiacomposi-tion, Rev. Geo-phys. Space Phys., 14, 609–624, 1976.
Rodgers, C. D.: Inverse Methods for Atmospheric Sounding – The-ory and Practice, 2nd edn., World Scientific Publishing Co. Pte. Ltd., Danvers, USA, 2000.
Rodgers, C. D. and Connor, B. J.: Intercomparison of re-mote sounding instruments, J. Geophys. Res., 108, D3, 4116, doi:10.1029/2002JD002299, 2003.
Rothman, L. S., Gordon, I. E., Barbe, A., Benner, D. C., Bernath, P. F., Birk, M., Boudon, V., Brown, L. R., Campar-gue, A., Champion, J.-P., Chance, K., Coudert, L. H., Dana, V., Devi, V. M., Fally, S., Flaud, J.-M., Gamache, R. R., Gold-man, A., Jacquemart, D., Kleiner, I., Lacome, N., Lafferty, W. J., Mandin, J.-Y., Massie, S. T., Mikhailenko, S. N., Miller, C. E., Moazzen-Ahmadi, N., Naumenko, O. V., Nikitin, A. V., Or-phal, J., Perevalov, V. I., Perrin, A., Predoi-Cross, A., Rins-land, C. P., Rotger, M., Šimeˇcková, M., Smith, M. A. H., Sung, K., Tashkun, S. A., Tennyson, J., Toth, R. A., Van-daele, A. C., and Vander Auwera, J.: The HITRAN 2008 molec-ular spectroscopic database, J. Quant. Spectrosc. Ra., 110, 533– 572, 2009.
Rudolph, J. and Ehhalt, D. H.: Measurements of C2-C5
hydro-carbons over the North Atlantic, J. Geophys. Res., 86, 11959– 11964, 1981.
Sinha, P., Hobbs, P. V., Yokelson, R. J., Bertschi, I. T., Blake, D. R., Simpson, I. J., Gao, S., Kirchstetter, T. W., and Novakov, T.: Emissions of trace gases and particles from sa-vanna fires in southern Africa, J. Geophys. Res., 108, D13, 8487, doi:10.1029/2002JD002325, 2003.
Stohl A. and Trickl, T.: A textbook example of long-range transport: Simultaneous observation of ozone maxima of stratospheric and North American origin in the free troposphere over Europe, J. Geophys. Res., 104, D23, 30445–30462, 1999.
Stohl, A., Hittenberger, M., and Wotawa, G.: Validation of the lagrangian particle dispersion model FLEXPART against large scale tracer experiment data, Atmos. Environ. 32, 4245–4264, 1998.
Sung, K., Skelton, R., Walker, K. A., Boone, C. D., Fu, D., and
Bernath, P. F.: N2O and O3arctic column amounts from
PARIS-IR observations: retrievals, characterization and error analysis, J. Quant. Spectrosc. Ra., 107, 385–406, 2007.
Tereszchuk, K. A., González Abad, G., Clerbaux, C., Hurtmans, D., Coheur, P.-F., and Bernath, P. F.: ACE-FTS measurements of trace species in the characterization of biomass burning plumes, Atmos. Chem. Phys., 11, 12169–12179, doi:10.5194/acp-11-12169-2011, 2011.
Tereszchuk, K. A., González Abad, G., Clerbaux, C., Hadji-Lazaro, J., Hurtmans, D., Coheur, P.-F., and Bernath, P. F.: ACE-FTS observations of pyrogenic trace species in boreal biomass burning plumes during BORTAS, Atmos. Chem. Phys., 13, 4529–4541, doi:10.5194/acp-13-4529-2013, 2013.
Turquety, S., Hurtmans, D., Hadji-Lazaro, J., Coheur, P.-F., Cler-baux, C., Josset, D., and Tsamalis, C.: Tracking the emission and transport of pollution from wildfires using the IASI CO re-trievals: analysis of the summer 2007 Greek fires, Atmos. Chem. Phys., 9, 4897–4913, doi:10.5194/acp-9-4897-2009, 2009. Volz, A., Ehhalt, D. H., and Derwent, R. G.: Seasonal and
latitudi-nal variations of14CO and the tropospheric concentration of OH
radicals, J. Geophys. Res., 86, 5163–5171, 1981.
Wiacek, A., Taylor, J. R., Strong, K., Saari, R., Kerzenmacher, T. E., Jones, N. B., and Griffith, D. W. T.: Ground-based solar absorp-tion FTIR spectroscopy: characterizaabsorp-tion of retrievals and first results from a novel optical design instrument at a new NDACC complementary station, J. Atmos. Ocean. Technol., 24, 432–448, 2007.
Wunch, D., Taylor, J. R., Fu, D., Bernath, P., Drummond, J. R., Midwinter, C., Strong, K., and Walker, K. A.:
Simultane-ous ground-based observations of O3, HCl, N2O, and CH4
over Toronto, Canada by three Fourier transform spectrometers with different resolutions, Atmos. Chem. Phys., 7, 1275–1292, doi:10.5194/acp-7-1275-2007, 2007.