HAL Id: hal-02346907
https://hal.archives-ouvertes.fr/hal-02346907
Submitted on 8 Jun 2021
HAL is a multi-disciplinary open access
archive for the deposit and dissemination of
sci-entific research documents, whether they are
pub-lished or not. The documents may come from
teaching and research institutions in France or
abroad, or from public or private research centers.
L’archive ouverte pluridisciplinaire HAL, est
destinée au dépôt et à la diffusion de documents
scientifiques de niveau recherche, publiés ou non,
émanant des établissements d’enseignement et de
recherche français ou étrangers, des laboratoires
publics ou privés.
episodes observed and modelled above Dome C,
Antarctica
Philippe Ricaud, Eric Bazile, Massimo del Guasta, Christian Lanconelli, Paolo
Grigioni, Achraf Mahjoub
To cite this version:
Philippe Ricaud, Eric Bazile, Massimo del Guasta, Christian Lanconelli, Paolo Grigioni, et al..
Gen-esis of diamond dust, ice fog and thick cloud episodes observed and modelled above Dome C,
Antarc-tica. Atmospheric Chemistry and Physics, European Geosciences Union, 2017, 17 (8), pp.5221-5237.
�10.5194/acp-17-5221-2017�. �hal-02346907�
www.atmos-chem-phys.net/17/5221/2017/ doi:10.5194/acp-17-5221-2017
© Author(s) 2017. CC Attribution 3.0 License.
Genesis of diamond dust, ice fog and thick cloud episodes observed
and modelled above Dome C, Antarctica
Philippe Ricaud1, Eric Bazile1, Massimo del Guasta2, Christian Lanconelli3,a, Paolo Grigioni4, and Achraf Mahjoub1
1Météo-France/CNRM, CNRS UMR 3589, 42 avenue Gaspard Coriolis, 31057 Toulouse, France 2INO-CNR, Via Madonna del Piano 10, 50019, Sesto Fiorentino, Italy
3Institute of Atmospheric Sciences and Climate (ISAC), Consiglio Nazionale delle Ricerche, via Gobetti 101,
40129 Bologna, Italy
4ENEA, Lungotevere Thaon di Revel, 76-00196 Roma, Italy
anow at: Joint Research Center, Institute for Environment and Sustainability (IES), Land Resource Management Unit
(H05), via Fermi, 21027 Ispra (VA), Italy
Correspondence to:Philippe Ricaud ([email protected]) Received: 12 September 2016 – Discussion started: 15 September 2016
Revised: 31 March 2017 – Accepted: 31 March 2017 – Published: 21 April 2017
Abstract. Episodes of thick cloud and diamond dust/ice fog were observed during 15 March to 8 April 2011 and 4 to 5 March 2013 in the atmosphere above Dome C (Concor-dia station, Antarctica; 75◦060S, 123◦210E; 3233 m a.m.s.l.). The objectives of the paper are mainly to investigate the processes that cause these episodes based on observations and to verify whether operational models can evaluate them. The measurements were obtained from the following instru-ments: (1) a ground-based microwave radiometer (HAM-STRAD, H2O Antarctica Microwave Stratospheric and
Tro-pospheric Radiometers) installed at Dome C that provided vertical profiles of tropospheric temperature and absolute humidity every 7 min; (2) daily radiosoundings launched at 12:00 UTC at Dome C; (3) a tropospheric aerosol lidar that provides aerosol depolarization ratio along the vertical at Dome C; (4) down- and upward short- and long-wave radi-ations as provided by the Baseline Surface Radiation Net-work (BSRN) facilities; (5) an ICE-CAMERA to detect at an hourly rate the size of the ice crystal grains deposited at the surface of the camera; and (6) space-borne aerosol depolar-ization ratio from the Cloud-Aerosol Lidar with Orthogonal Polarization (CALIOP) lidar aboard the Cloud-Aerosol Li-dar and Infrared Pathfinder Satellite Observation (CALIPSO) platform along orbits close to the Dome C station. The time evolution of the atmosphere has also been evaluated by con-sidering the outputs from the mesoscale AROME and the global-scale ARPEGE meteorological models. Thick clouds
are detected during the warm and wet periods (24–26 March 2011 and 4 March 2013) with high depolarization ratios (greater than 30 %) from the surface to 5–7 km above the ground associated with precipitation of ice particles and the presence of a supercooled liquid water (depolarization less than 10 %) clouds. Diamond dust and/or ice fog are detected during the cold and dry periods (5 April 2011 and 5 March 2013) with high depolarization ratios (greater than 30 %) in the planetary boundary layer to a maximum altitude of 100–300 m above the ground with little trace of precipita-tion. Considering 5-day back trajectories, we show that the thick cloud episodes are attributed to air masses with an oceanic origin whilst the diamond dust/ice fog episodes are attributed to air masses with continental origins. Although operational models can reproduce thick cloud episodes in the free troposphere, they cannot evaluate the diamond dust/ice fog episodes in the planetary boundary layer because they require to use more sophisticated cloud and aerosol micro-physics schemes.
1 Introduction
The impact of global warming has become obvious in high-latitude regions, particularly in the Arctic region, where melt-ing ice and softenmelt-ing tundra are causmelt-ing profound changes. The environmental response of the Arctic is
characteristi-cally different from that of the Antarctic because of differ-ences in planetary geography and energy circulation. Over the past 50 years, the west coast of the Antarctic Peninsula has been one of the most rapidly warming parts of the planet. This warming is not only restricted to the land but can also be noted in the Southern Ocean. For example, the warming of the Antarctic winter troposphere is more important than anywhere on Earth with a rate of 0.5 to 0.7◦C per decade measured over the last 30 years (Turner et al., 2006). In Antarctica, the polar vortex is more intense, is colder and lasts longer than in Arctic. The role of the Antarctic ice is important because it is one of the key parameters in the regu-lation of air temperature near the surface. During the austral winter, in the absence of solar radiation, the surface cools via infrared radiation emitted towards a very cold and very dry atmosphere. In the austral summer, the absorption of solar ra-diation at shorter wavelengths produces a diurnal cycle and warms the surface while heating is limited by a high albedo (Pirazzini, 2004; Hudson et al., 2006).
Changes in the abundance of water vapour (H2O)
influ-ence directly (and indirectly via clouds) the Earth’s radiation budget and therefore affect climate change (Brasseur et al., 1999) because H2O is the main greenhouse gas that emits
and absorbs in the infrared domain. With an average altitude of 2500 m above sea level, the Antarctic Plateau is one of the coldest and driest places of the planet, for instance with temperature less than −80◦C and integrated water vapour (IWV) amount less than 0.5 mm in winter at the Dome C sta-tion (e.g. Tomasi et al., 2012). For these reasons, numerous studies focussed on climate change (e.g. Hines et al., 2004), processes in the atmospheric boundary layer (e.g. Argentini et al., 2005), reactive species interacting with the snow (e.g. Davis et al., 2001) and astronomical site quality (e.g. Trem-blin et al., 2011).
Clouds play an important role in the radiation budget of the Earth. Since they have large spatial, seasonal and diurnal variability and they are poorly represented in climate models, large differences are obtained by climate models when as-sessing the strength and the direction of the cloud feedback on the Earth radiation balance (Dufresne and Bony, 2008). The interconnections between the Antarctic, the middle lat-itudes and the tropics show that Antarctic clouds are an im-portant part of the global climate system (Lubin et al., 1998). Based on observations from CloudSat and Cloud-Aerosol Li-dar and Infrared Pathfinder Satellite Observation (CALIPSO) satellites over the period 2006–2010 (Adhikari et al., 2012), it is found that the Antarctic Plateau has the lowest cloud oc-currence of the Antarctic continent (< 30 %). The continen-tal region of the Antarctic Plateau experiences cloud about 30 % of the time at altitudes below 3 km and less than 10 % of the time above 5 km. Cloud occurrence over the western continental region is about 50 % below 3 km and about 30 % from the surface up to 8 km. Furthermore, whatever the sea-son considered, it is shown that multilayer clouds occur over Antarctica.
The Dome C station (Concordia) in Antarctica (75◦060S, 123◦210E; 3233 m a.m.s.l.) is operated jointly by the French
Polar Institute Paul-Émile Victor (IPEV) and the Italian Insti-tute Programma Nazionale di Ricerche in Antartide (PNRA). The site is located on the Antarctic Plateau with 24 h of day in summer and 24 h of night in winter and a climatological temperature between −40 and −20◦C in summer and −80 and −60 ◦C in winter (Tomasi et al., 2006). Situated on top of a dome, there is no katabatic wind as in the case of the costal station of Dumont d’Urville (66◦S, 140◦E; 0 m a.s.l.) since the average wind rarely exceeds 5 m s−1throughout the year. When the temperature drops, water may precipitate and light ice crystals may be suspended in the air with little trace of precipitation producing a phenomenon referred to as di-amond dust or ice fog depending on the size of the crystals. At the Dome C station, numerous studies already focussed on the diurnal and seasonal variations of the atmospheric bound-ary layer (e.g. Ricaud et al., 2012).
The objectives of the paper are mainly to investigate the processes that cause the presence of thick cloud and dia-mond dust/ice fog episodes above the Dome C station based on observations and verify whether operational models can estimate them. By combining measurements from several in-struments installed at the station, together with space-borne measurements and model outputs, we intend to study the nature of the clouds and the meteorological processes that favoured their formation by using parameters such as tropo-spheric temperature and absolute humidity, integrated water vapour, nebulosity, long- and short-wave up- and downward radiations, together with the vertical distribution of aerosol depolarization ratios.
We concentrate our efforts on two episodes: 15 March to 8 April 2011 and 4 to 5 March 2013. Several instruments have been used: (1) a ground-based microwave radiome-ter (HAMSTRAD, H2O Antarctica Microwave Stratospheric
and Tropospheric Radiometers) installed at Dome C that pro-vided vertical profiles of tropospheric temperature and ab-solute humidity with a 7 min integration time; (2) daily ra-diosoundings launched at 12:00 UTC at Dome C; (3) a tro-pospheric aerosol lidar that provides aerosol depolarization ratio along the vertical at Dome C; (4) down- and upward short- and long-wave radiations as obtained from secondary standard pyranometers and pyrgeometer installed at Dome C and belonging to the Baseline Surface Radiation Network (BSRN); (5) an ICE-CAMERA to detect at an hourly rate the size of the ice crystal grains deposited at the surface of the camera; and (6) space-borne aerosol depolarization ratio from the Cloud-Aerosol Lidar with Orthogonal Polarization (CALIOP) aboard the CALIPSO platform along orbits close to the Dome C station. The time evolution of the atmosphere over the 1-month period in 2011 has also been evaluated by considering the outputs from the mesoscale model AROME (Seity et al., 2011) in three configurations: (1) “operational”, operating mode with a snow albedo of 0.80; (2) “operational with ice tuning”, as in “operational” but with a setting of
snow albedo that can reach up to 0.85; (3) “ARPEGE mi-crophysics”, as in “operational with ice tuning” but includes the physics of ARPEGE and a state-of-the-art scheme to rep-resent the snow pattern taking into account the roughness length. Finally, we will use the global-scale ARPEGE meteo-rological analyses in 2013 selected over the Dome C station. The paper is structured as follows. Section 2 presents all the data sets used in our study. Section 3 investigates episode 1, namely the thick cloud and the diamond dust/ice fog episodes during the 1-month period in 2011 considering the temporal evolution of the different parameters above and in the surroundings of the Dome C station. Section 4 deals with episode 2 in 2013. The genesis of the thick cloud and the di-amond dust/ice fog episodes is discussed in Sect. 5. Finally, Section 6 concludes the study.
2 Data sets
2.1 The HAMSTRAD radiometer
The HAMSTRAD instrument is a state-of-the-art microwave radiometer to probe the troposphere in very cold and very dry environments in order to retrieve temperature and ab-solute humidity vertical profiles and IWV. Temperature pro-files are obtained from the 51–59 GHz spectral range, centred on the oxygen line. Absolute humidity profiles are retrieved from the 169–197 GHz spectral range, centred on the water vapour line. IWV is calculated from the water vapour profile integrated along the vertical. Integration time is 7 min. The radiometer is presented in Ricaud et al. (2010).
The instrument was sent to Dome C in January 2009. It has been running automatically since January 2010. Science and validation studies using HAMSTRAD data are detailed in Ricaud et al. (2012, 2013, 2014a–c, 2015). All the HAM-STRAD data measured since 2009 are freely available at the following address: http://www.cnrm.meteo.fr/spip.php? article961&lang=en. The radiometer sensitivity is very high in the planetary boundary layer, high in the free troposphere and very weak in the upper troposphere–lower stratosphere (Ricaud et al., 2015). The H2O and temperature vertical
resolutions are ∼ 20–50, ∼ 100 and ∼ 500 m in the plane-tary boundary layer, free troposphere and upper troposphere– lower stratosphere, respectively. Statistically, it has been shown that, against radiosondes from 2009 to 2014, there is a 1–5 K cold bias below 4 km and a 5–10 K warm bias above, with a high time correlation (linear Pearson correlation co-efficient r > 0.80). There is a wet bias of 0.1–0.3 g m−3 be-low about 2 km and a dry bias of ∼ 0.1 g m−3above, with a high time correlation below 4 km (r > 0.70). Yearly-averaged vertical profiles of the biases in temperature and absolute hu-midity are also provided from 2009 to date at the same HTTP address. Note we have not debiased HAMSTRAD data in the present study.
2.2 Radiosondes
The programme of radiosoundings developed at Dome C is presented in Ricaud et al. (2014a). Temperature and humidity biases against HAMSTRAD are shown in the previous sec-tion. In the present study, the vertical profiles of temperature and humidity were taken from RS92 radiosondes using the standard Vaisala evaluation routines without any correction of sensor heating or time lag effect. We recall that the cor-rections performed on the radiosonde data measured in 2009 according to Miloshevish et al. (2006) shown a weak impact (with a maximum of +4 % on IWV) on the vertical profiles (Ricaud et al., 2013). Furthermore, considering the updated tools developed in Miloshevich et al. (2009) and Tomasi et al. (2011, 2012) found that, between 630 and 470 hPa, the correction factor for humidity estimated by the radiosonde varied within 1.10–1.15 for daytime and within 0.98–1.00 for night-time. It is important to note that the 630–470 hPa layer is located between the ground and an altitude of ∼ 2 km which maximizes the calculation of IWV. A 1.2 K cold bias is also observed in the RS92 from the surface up to an altitude of ∼ 4 km (Tomasi et al., 2011, 2012).
2.3 The aerosol lidar
The aerosol lidar is an automatic backscatter and depolar-ization system in operation at Dome C in relation with dif-ferent scientific projects (http://lidarmax.altervista.org/lidar/ AntarcticLIDAR.php). Vertical profiles of aerosol and cloud structures are continuously measured together with charac-terization of the physical phase of particles. Lidar data and false colour plots, obtained with an automated procedure, are delivered to Italy on a daily basis.
The lidar system uses a Quantel laser (Brio) at Dome C and operates at 532 nm to get backscattering and depolariza-tion ratio from 30 to 7000 m above ground with a 7.5 m ver-tical resolution. The line of sight is zenith looking through a window, enabling measurements in all-weather conditions. The telescope has a 10 cm diameter, with 30 cm refractive op-tics and 0.15 nm interference filter. It has already been used in several scientific studies, e.g. the radiative properties of H2O and clouds in the far infrared over Antarctica (Palchetti
et al., 2015).
2.4 CALIOP on-board CALIPSO
The CALIPSO satellite has been launched to study the role clouds and aerosols play in the Earth system that includes air quality, weather and climate. CALIPSO was launched on 28 April 2006 with the cloud profiling radar system on the CloudSat satellite. The CALIPSO satellite comprises three instruments, the CALIOP, the Imaging Infrared Radiometer (IIR) and the Wide Field Camera (WFC; Winker et al., 2009). CALIOP is a two-wavelength (532 and 1064 nm) polarization-sensitive lidar that provides high-resolution
ver-tical profiles of aerosols and clouds (https://calipso.cnes.fr/ en/CALIPSO/lidar.htm). CALIOP uses three receiver chan-nels: one measures the 1064 nm backscatter intensity and two channels measure orthogonally polarized components of the 532 nm backscattered signal. The receiver telescope is 1 m in diameter. The full-angle field of view of the tele-scope is 130 µrad, resulting in a footprint at the Earth’s sur-face of about 90 m. Algorithms have been developed to re-trieve aerosols and cloud layers together with optical and mi-crophysical properties (Young and Vaughan, 2009). Depolar-ization ratio estimated with version 3.01 is presented in our study.
2.5 The BSRN
The objective of the World Climate Research Programme (WCRP) BSRN is to provide, using a high sampling rate, observations of the best possible quality for short- and long-wave surface radiation fluxes. These readings are taken from a small number of selected stations, including Dome C, in contrasting climatic zones, together with collocated surface and upper air meteorological data and other supporting ob-servations. The incoming long-wave and short-wave radia-tion components of the surface radiative balance were taken from the Dome C BSRN station and measured with two Kipp & Zonen CM22 secondary standard pyranometers and two Kipp & Zonen CG4 pyrgeometers, all operated according to BSRN guidelines (Lanconelli et al., 2011).
2.6 The ICE-CAMERA
At Dome C in 2013, an ICE-CAMERA was installed on the roof of the shelter where both the HAMSTRAD and the aerosol lidar were set up. This camera was able to take on an hourly rate a picture of the ice crystal grains deposited at the surface of the camera. The ICE-CAMERA (http://lidarmax. altervista.org/englidar/_AntarcticPrecipitation.php) is equiv-alent to a flatbed scanner. It was built in order to operate unattended in polar regions for the study of precipitating ice grains. Precipitation is collected on a glass plate, where it is photographed with 5 µm resolution hourly. After each scan, the glass plate is electrically heated in order to sublimate the ice grains. Image-processing software is used for the auto-matic characterization and counting of grains.
2.7 The AROME model
AROME is a small-scale numerical prediction model, op-erational at Météo-France since December 2008. It was de-signed to improve short-range forecasts of severe events such as intense Mediterranean precipitations (Cévenole events), severe storms, fog and urban heat during heat waves. The physical parameterizations of the model come mostly from the Meso-NH model whereas the dynamic core is the AL-ADIN model. The size of the mesh is 2.5 km against 10 km for ARPEGE over France in 2014. The model is initialized
Figure 1. (a) Aerosol depolarization as measured by the lidar in-stalled at the Dome C station over the period 24–26 March 2011. (b) Aerosol depolarization as measured by the lidar installed at the Dome C station over the period 4–6 April 2011.
from a three-dimensional variational (3DVAR) data assimi-lation system using radar reflectivity and Doppler wind. Five daily forecasts are made with AROME, thus helping to better predict meteorological events of the day and of the morrow (30 h forecast range). AROME was used within the GEWEX Atmospheric Boundary Layer Study 4 (GABLS4) to study the meteorological evolution over the Dome C station (Bazile et al., 2015).
For the study, three experiments at 2.5 km were used. Two based on the AROME configurations: (1) “operational”, op-erating mode with the default snow scheme (Douville et al., 1995; labelled as 79HA); (2) “operational with ice tun-ing”, as in “operational” but with a setting of a minimum snow albedo of 0.8 (labelled as 79YG); (3) “ARPEGE micro-physics”, in which the AROME physics was replaced by the ARPEGE one used in the global model with the state-of-the-art scheme to represent the permanent snow with a minimum snow albedo of 0.8 valid over Dome C and a more accurate roughness length (labelled as 79Z6).
2.8 The ARPEGE model
The ARPEGE model is the global model used for numeri-cal weather prediction at Météo-France. In the present study, the operational configuration has been used with a stretched grid at high resolution over France (10 km) and a coarser grid over Australia of 60 km. At the South Pole, the horizontal resolution is about 50 km and the vertical grid has 70 levels with a first level at around 16 m above the ground. The as-similation tool is based on an incremental four-dimensional variational (4DVAR) method. The physical package used in
the ARPEGE model is state-of-the-art, with a turbulent ki-netic energy scheme associated with a mass flux scheme for the boundary layer (Bazile et al., 2011). The clouds and the microphysics use four prognostic variables such as cloud water, cloud ice, rain and snow (Lopez, 2002; Bouteloup et al., 2005). The radiative transfer in the atmosphere is computed with the rapid radiative transfer model (RRTM) scheme (Mlawer et al., 1997) for the long-wave and the short-wave with the Fouquart–Morcrette scheme (Fouquart and Bonnel, 1980; Morcrette et al., 2001).
3 Episode 1 on 15 March–8 April 2011 3.1 Clouds
In order to check whether clouds are present or not over the station during the two periods studied in detail, we consider the time evolution of the aerosol depolarization as measured by the lidar installed at Dome C on 24–26 March and on 4–6 April 2011 (Fig. 1). On 24–26 March (Fig. 1a), high depolar-ization ratios (greater than 30 %), a signature of ice particles, start increasing by the end of 24 March (22:00 UTC), reach-ing an altitude of 1.2–1.5 km durreach-ing 25 March and start de-creasing on 26 March by 12:00 UTC. The vertical structures in the depolarization ratio fields are a signature of precipita-tion of ice particles (Mishchenko et al., 2000). On 26 March, at about 2 km altitude from 07:00 to 13:00 UTC, a layer of low depolarization ratio (less than 14 %) appears, which is a signature of liquid water cloud. In general, over this period, the cloud is so opaque that the lidar signal cannot penetrate the structure beyond ∼ 1.2 km altitude.
We gain more insight into the vertical structure of the cloud covering the Dome C station by considering the space-borne CALIOP night-time measurements performed on 25 March 2011 in the vicinity of the station. Figure 2a shows the space-borne lidar CALIOP measurements of depolariza-tion ratio along one orbit in the vicinity of the Dome C sta-tion on 25 March 2011. We note that, at the locasta-tion of the Dome C station (75◦060S, 123◦210E), the depolarization ra-tio is greater than 0.4 (ice particles) from the ground (3233 m a.m.s.l.) to about 10 km a.m.s.l., namely ∼ 7 km above the ground. If we now combine the downward and upward li-dar information, we can state that on 24–26 March 2011, a 7 km thick ice cloud passed over the Dome C station and precipitated ice particles whilst, by the end of the period, a low-altitude (∼ 2 km) liquid water cloud was also present.
From Fig. 1b, high depolarization ratios (greater than 30 %) from the lidar operating at Dome C start increasing by the middle of 4 April (12:00 UTC), reaching a maxi-mum altitude of 100 m, increasing up to 200 m on 5 April at 09:00 UTC, to finish decreasing on 6 April by 12:00 UTC. The high depolarization ratio shows that the cloud is con-stituted of ice crystals and, since there are no other layers higher in the troposphere, there is little trace of precipitation.
Considering the CALIOP space-borne lidar measurements of depolarization ratio (Fig. 2b) performed on 5 April 2011 in the vicinity of the Dome C station, they also suggest a much thinner cloud from the ground to about 4 km a.m.s.l., namely less than 1 km above the ground, with values ranging 0.1–0.2 (ice particles). Since there is little precipitation and no pres-ence of standard thick clouds above the station, the thin cloud episode is traditionally attributed to a diamond dust/ice fog episode, rather frequent at the Dome C station.
From Girard and Blanchet (2001), ice fog is distinguished from diamond dust by the high concentration of ice crys-tal of smaller diameters. Ice fog and ice cryscrys-tals are gener-ally closer to spherical shape and their number concentra-tion exceeds 1000 L−1 while their mean diameter is below 30 µm. From Walden et al. (2003), the atmospheric ice crys-tals over the Antarctic Plateau in winter is mainly constituted of three major types: diamond dust, blowing snow and snow grains. When sorted by number, Lawson et al. (2006) at-tribute 30 % of the crystals recorded at the Amundsen–Scott South Pole station to rosette shaped (mixed-habit rosettes, plate-like polycrystals and rosette shapes with side planes), 45 % to diamond dust (columns, thick plates and plates) and 25 % to irregular. By mass, the percentages are 57 % rosette shapes, 23 % diamond dust and 20 % irregular. In the litera-ture of the ice crystals over Antarctica and particularly over the Antarctic Plateau, there is little mention of ice fog ex-cept some studies performed in the coastal areas of e.g. Mc-Murdo in Lazzara (2010). Based on Gultepe et al. (2014) and Arctic studies, the maximum size for ice fog crystals is about 200 µm with diamond dust ice crystal sizes greater than 200 µm. In the East Antarctic Plateau over all the seasons ex-cept summer, a strong surface-based temperature inversion persists in which small ice crystals referred to as diamond dust/ice fog form in the boundary layer (Walden et al., 2003). Classification of ice cloud particles is important to retrieve the shape of individual crystals and to estimate the radiative impact of the clouds (Bailey and Hallett, 2009; Lindqvist et al., 2012). It is beyond the scope of the present analysis to classify ice crystals measured over the Dome C station.
The time evolution of the nebulosity vs. height as calcu-lated by AROME according to the three configurations over the period 25 March–8 April 2011 is displayed Fig. 3. In two configurations (operational and operational with ice tuning), clouds (traced by values of nebulosity greater than 0.25) are calculated mainly over two single periods: (1) on 22 March from 1 to 5 km and (2) on 25–29 March from the ground to 6 km. Considering the third configuration (ARPEGE micro-physics), the period when clouds (traced by values of neb-ulosity greater than 0.25) are present is much longer than the two first configurations since it almost covers the en-tire time interval under consideration. There are indeed the two periods previously cited, namely on 22 March and 25–29 March, but they extend both in time (22–24 March and 25–30 March, respectively) and altitude (surface to 7 km). Other pe-riods show some moderate values of nebulosity (0.10–0.25)
Figure 2. Space-borne lidar CALIOP measurements of depolarization ratio along one orbit in the vicinity of the Dome C station on 25 March 2011 (a), 5 April 2011 (b) and 4 March 2013 (c). The red square represents the location of the Dome C station. The red vertical arrow represents the approximate location of the Dome C station.
on 15–17, 20 March and on 2, 3, 4, 6–7 April. These calcu-lated clouds can be close to the ground or high in the free troposphere (4–6 km). In the three configurations, high neb-ulosity values (greater than 0.8) are calculated close to the surface (0–200 m). The AROME model tends to produce a sort of cloud residual in the planetary boundary layer in the three configurations analysed.
3.2 Radiation
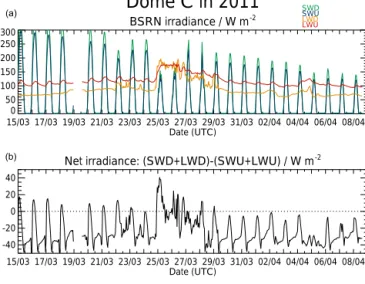
The time evolution of the downward and upward short- and long-wave radiations as measured by the BSRN is displayed in Fig. 4, together with the net irradiance (difference between the downward and the upward fluxes) from 15 March to 8 April 2011. The diurnal cycle of solar irradiance fluxes is clearly evidenced with the obvious maximum at local noon
ranging between 350 W m−2(at the beginning of the period) and 150 W m−2 (at the end of the period). Albedo over the whole period is found to range between 0.8 and 0.95 with daily minimum at local noon (not shown). The upward long-wave radiation emitted by the surface is generally greater than the downward irradiance in clear sky conditions, while they became similar under overcast when thick cloudiness prevents radiative cooling. Consequently, alternating day and night periods in March and April, the net irradiance is nega-tive except around local noon when it can be either posinega-tive or close to zero. However, for the two periods considered so far, namely on 25–26 March and on 5 April, the radiation budget is significantly different from the average situation.
On 25 March, the long-wave radiations (both downward and upward) are greater than the short-wave radiations (both
Figure 3. (a–c) Time evolution of nebulosity from 15 March to 8 April 2011 above Dome C as calculated by the mesoscale model AROME according to different runs: operational (a), operational with ice tuning (b) and considering ARPEGE microphysics (c). See the text for further information regarding the AROME runs.
downward and upward) even at local noon. The resulting effect is that the net irradiance is positive or close to zero over the whole period. This obviously indicates that a thick cloud is shielding the downward short-wave radiation (com-ing from the Sun) and increases the downward long-wave radiation (coming from the cloud). Furthermore, there is a great probability that a thick cloud is present over the Dome C station.
On 5 April, the situation is radically different. There was no abrupt increase of long-wave downward radiation as on 25 March, so we can rule out the presence of a thick cloud above the station. Nevertheless, the situation is atypical since, at lo-cal noon, the downward short-wave radiation is only slightly greater than the upward short-wave radiation, and the net ir-radiance does not exhibit an obvious diurnal cycle maximiz-ing at local noon. Consequently, even if the presence of a thick cloud has been ruled out from the long-wave radiation analysis, both the short-wave and the total irradiance anal-yses tend to suggest the presence of a cloud, probably thin and/or close to the surface, in order to (1) slightly affect the downward long-wave irradiance and (2) strongly affect the diurnal cycle of the net irradiance. The next section investi-gates the evolution of temperature and water vapour over the same period. BSRN irradiance / W m-2 15/03 17/03 19/03 21/03 23/03 25/03 27/03 29/03 31/03 02/04 04/04 06/04 08/04 Date (UTC) 0 50 100 150 200 250 300
Net irradiance: (SWD+LWD)-(SWU+LWU) / W m-2
15/03 17/03 19/03 21/03 23/03 25/03 27/03 29/03 31/03 02/04 04/04 06/04 08/04 Date (UTC) -40 -20 0 20 40
Dome C in 2011
SWDSWU LWD LWU (a) (b)Figure 4. (a) Time evolution of downward short-wave radiation (SWD, green line), upward short-wave radiation (SWU, blue line), downward long-wave radiation (LWD, orange line) and upward long-wave radiation (LWU, red line) from 15 March to 8 April 2011 above Dome C as measured by the BSRN instruments. (b) Net ir-radiance (SWD+LWD−SWU−LWU) as measured by the BSRN instruments.
Figure 5. Time evolution of temperature from 15 March to 8 April 2011 above Dome C as measured by the HAMSTRAD radiometer from 0 to 5 km.
3.3 Temperature and water vapour time evolutions The time evolution of temperature and absolute humidity profiles as measured by HAMSTRAD from 0 to 5 km is shown Figs. 5 and 6, respectively. In general, temperature and water vapour from HAMSTRAD show a maximum over the period 25–26 March (thick cloud episode) and a mini-mum over the period 5 April (diamond dust/ice fog episode). Along the vertical, these two episodes cover a wide domain from the ground to more than 3 km above the ground for tem-perature and up to 2.5–3 km above the ground for absolute humidity. The warm and wet period lasts 3–4 days and is as-sociated with the thick cloud episode although the cold and dry period is of a short duration, namely 1 day, and is asso-ciated with the diamond dust/ice fog episode. Note that the time evolution of temperature and water vapour over the
pe-Figure 6. Time evolution of absolute humidity from 15 March to 8 April 2011 above Dome C as measured by the HAMSTRAD ra-diometer from 0 to 5 km.
riod of 15 March–8 April 2011 as measured by HAMSTRAD is consistent with the one measured by the radiosondes and calculated by AROME (not shown).
4 Episode 2 on 4–5 March 2013
The second episode, which is much shorter than the first one, relies on the same data sets presented in Sect. 3. The only difference is that the model analyses are only from the mete-orological operational model ARPEGE that routinely deliv-ers meteorological fields at the vicinity of the Dome C station every 6 h (00:00, 06:00, 12:00 and 18:00 UTC) since Decem-ber 2011.
4.1 Clouds
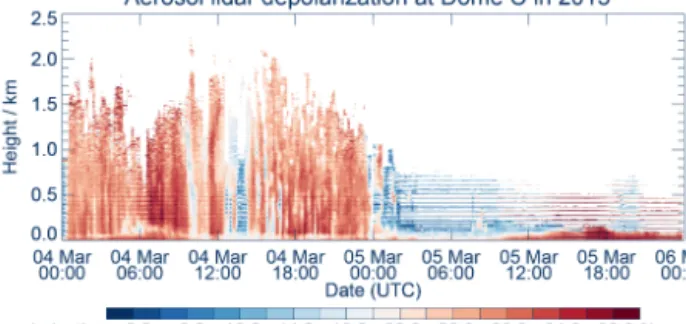
The depolarization ratio measured by the aerosol lidar in-stalled at Dome C from 4 to 5 March is shown in Fig. 7. High depolarization ratios (greater than 30 %) are present all over 4 March, reaching an altitude of 1.5–2.0 km, and start de-creasing on 5 March by 00:00 UTC. The thick cloud shows vertical structures in the depolarization ratio fields that are a signature of precipitation of ice particles (see Sect. 3.1). Between 13:00 and 14:00 UTC on 4 March and from 00:00 to 10:00 UTC on 5 March, depolarization ratios are much lower, reaching values of less than 10 %. From 10:00 to 24:00 UTC on 5 March, depolarization ratios (Fig. 7) are very high (> 40 %), indicative of ice crystals, but confined from the surface to 100–200 m altitude indicative of the pres-ence of diamond dust/ice fog. This is confirmed by the BSRN radiation measurements (see Sect. 4.2).
We now can consider the time evolution of the number of ice crystals measured by the ICE-CAMERA integrated over 1 h from 4 to 5 March 2013 above the Dome C station in Fig. 8. We notice that, from 00:00 to 10:00 UTC on 5 March, the number of ice crystals detected by the ICE-CAMERA dramatically decreased from ∼ 700 to ∼ 200, whatever the crystal ice habit size greater than 20 µm. There is also a strong lidar raw signal (not shown) together with a low lidar depolarization signal (Fig. 7) around 100 m, a signature of
Figure 7. Time evolution of the depolarization ratio (%) from 4 to 5 March 2013 above the Dome C station as measured by the aerosol lidar installed at Dome C.
ICE CAMERA: number of ice crystals at Dome C in 2013
04 Mar
00:00 04 Mar06:00 04 Mar12:00 04 Mar18:00 05 Mar00:00 05 Mar06:00 05 Mar12:00 05 Mar18:00 06 Mar00:00 100
1000
N
Date (UTC)
Figure 8. Time evolution of the number of ice crystals measured by the ICE-CAMERA integrated over 1 h from 4 to 5 March 2013 above the Dome C station.
liquid particles. Consequently, the reduced polarization de-tected in Fig. 7 reflects the presence of supercooled liquid water and not the presence of ice crystals. There are some traces of vertical structures present around 18:00 UTC, a sig-nature of precipitation, but they are very difficult to detect probably because the fall velocity of the ice crystals is much less than in the case of thick clouds. However, it is beyond the scope of the present paper to discuss the fall velocity of the ice crystals.
Over this 2-day period, only one CALIOP/CALIPSO or-bit has been analysed in the vicinity of the Dome C sta-tion (Fig. 1b) on 4 March (08:15 UTC) during the thick cloud episode. On that day, the depolarization ratio ranges from 0.1 to 0.3 from the ground (3233 m a.m.s.l.) to about 8 km a.m.s.l., namely ∼ 5 km above the ground. Note that there is no CALIPSO orbit in the vicinity of the Dome C station coinciding with the diamond dust/ice fog episode.
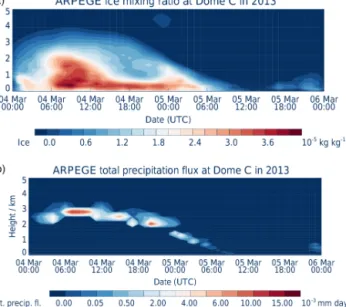
Now we consider the presence of clouds and/or ice/liquid particles over the 2-day period either from active and pas-sive remote-sensing measurements or from ARPEGE anal-yses. The time evolution of ice water mixing ratio calcu-lated by ARPEGE over Dome C is represented in Fig. 9a to-gether with the total precipitation flux over the 2-day period (Fig. 9b). The ARPEGE simulation indicates an ice cloud from the surface to near 4 km above the ground on 4 March with the top altitude decreasing down to the surface on 5 March at 12:00 UTC. The main thick cloud calculated on
Figure 9. Time evolution of the ice water mixing ratio (a) and of the total precipitation flux (b) from 4 to 5 March 2013 above the Dome C station as calculated by the ARPEGE model.
4 March is associated with ice precipitation from the alti-tude of ∼ 3 km at 06:00 UTC down to ∼ 2 km on 20:00 UTC (Fig. 9b). This is in agreement with observations. Between 18:00 and 24:00 UTC on 5 March there is also a trace of ice cloud from 0 to 1 km altitude. There is no longer trace of lo-cal precipitation after 03:00 UTC on 5 March. However, this calculated ice cloud is much deeper than the one observed by the lidar.
4.2 Radiation
The time evolution of the downward and upward short- and long-wave radiations as measured by BSRN is displayed in Fig. 10, together with the net irradiance (difference between the downward and the upward fluxes) from 1 to 9 March 2013. As already presented in Sect. 3.2, the diurnal cycle of solar irradiance fluxes mainly shows a clear sky period over the Dome C station, except over the period from 4 March at 00:00 UTC to 6 March at 00:00 UTC. Indeed, on 4 March all day long, there is a net increase in the long-wave downward radiation from 80 to 120 W m−2compared to the values from 1 to 3 March and from 7 to 9 March when we can expect the station is under clear sky conditions. Furthermore, from 12:00 to 24:00 UTC, the net irradiance is about −20 W m−2 on 4 March, whilst it is usually about −30 W m−2 in clear sky conditions. Consequently, there is a great probability a thick cloud is present over the Dome C station on 4 March during 24 h. On 5 March, between 12:00 and 24:00 UTC, the net irradiance is very low (about −50 W m−2)compared to values of about −30 W m−2 in clear sky conditions. There is a slight increase of the long-wave downward (90 W m−2) and upward (140 W m−2)fluxes on 5 March compared to the
BSRN irradiance / W m-2 01/03 02/03 03/03 04/03 05/03 06/03 07/03 08/03 09/03 Date (UTC) 0 100 200 300 400 500
Net irradiance: (SWD+LWD)-(SWU+LWU) / W m-2
01/03 02/03 03/03 04/03 05/03 06/03 07/03 08/03 09/03 Date (UTC) -60 -40 -20 0 20 40 60
Dome C in 2013
SWD SWU LWD LWU (a) (b)Figure 10. (a) Time evolution of downward short-wave radiation (SWD, green line), upward short-wave radiation (SWU, blue line), downward long-wave radiation (LWD, orange line) and upward long-wave radiation (LWU, red line) from 1 to 9 March 2013 above Dome C as measured by the BSRN instruments. (b) Net irradi-ance (SWD+LWD−SWU−LWU) as measured by the BSRN in-struments. The horizontal green dashed line represents the net ir-radiance averaged between 14:00 and 17:00 UTC (represented by green diamonds) from 1 to 8 March excluding 4 and 5 March. The red and blue diamonds represent the net irradiances measured be-tween 14:00 and 17:00 UTC on 4 March (thick cloud episode) and 5 March (diamond dust/ice fog episode), respectively.
fluxes in clear sky conditions (70 and 120 W m−2, respec-tively), but much less than fluxes in cloudy conditions (150 and 160 W m−2, respectively). Consequently, this 12 h period on 5 March can be attributed to neither clear sky nor thick cloud episodes. Quantitatively, over the period 1–8 March 2013 (Fig. 10), considering clear sky days (excluding 4 and 5 March), the net irradiance between 14:00 and 17:00 UTC is −30.55 W m−2, whilst on 4 March (thick cloud episode) the net irradiance has increased to −16.75 W m−2and on 5 March (diamond dust/ice fog episode) the net irradiance has decreased to −45.52 W m−2.
4.3 Temperature and water vapour evolutions
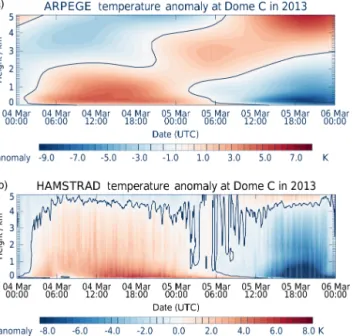
The temperature and the water vapour anomalies over the 2-day period are represented in the Figs. 11 and 12, respec-tively, as measured by HAMSTRAD and as calculated by ARPEGE.
Considering the 0 K temperature anomaly isoline (Fig. 11), both data sets show a warm period on 4 March (thick cloud episode) followed by a cold period on 5 March (diamond dust/ice fog episode) from the surface to about 2.4 km above the ground on 4 March by ARPEGE and to about 4.0 ± 0.5 km by HAMSTRAD. The 1.6 km difference between the altitude of the 0 K temperature anomaly isoline in HAMSTRAD and in ARPEGE data sets on 4 March
Figure 11. Temperature anomaly from 4 to 5 March 2013 above the Dome C station as calculated by the ARPEGE model (a) and as measured by the HAMSTRAD radiometer (b).
might be due to the poor vertical resolution of HAMSTRAD compared to ARPEGE. Above this altitude, a cold period is followed by a warm period in the two data sets. Although the HAMSTRAD data are noisier than the ARPEGE data, the maxima and minima are consistently observed and calcu-lated in the lowermost troposphere around 12:00–18:00 UTC on 4 March and around 18:00–22:00 UTC on 5 March. From the surface to about 4–5 km altitude, both data sets also show a wet period (Fig. 12) on 4 March (thick cloud episode) followed by a dry period (diamond dust/ice fog episode) on 5 March.
In general, in the lower troposphere, ARPEGE and HAMSTRAD temperature data sets are very consistent to each other (see Fig. 11). If we now consider in detail the evolution of the vertical temperature structures during the two episodes, using also radiosondes measurements at 12:00 UTC, interesting conclusions can be deduced from Fig. 13. During the warm episode (thick cloud) on 4 March, there is a sharp positive vertical temperature gradient at 12:00 and 18:00 UTC within the first 100–200 m altitude layer in the planetary boundary layer from a very cold surface of about 230 K, reaching a maximum of about 240–242 K. Above, the atmosphere is rather isothermal and starts cool-ing around 400–800 m. All the data sets are very consis-tent to each other. During the cold episode on 5 March, the lower troposphere is generally colder than during the warm episode, but at 12:00 UTC there is no such a stable planetary boundary layer as observed a day before since the vertical gradient is only of a 3 K over 500 m altitude instead of 20 K over 200 m during the warm episode. Radiosonde, ARPEGE and HAMSTRAD profiles are consistent to each other. At
Figure 12. Absolute humidity anomaly from 4 to 5 March 2013 above the Dome C station as calculated by the ARPEGE model (a) and as measured by the HAMSTRAD radiometer (b).
215 220 225 230 235 240 245 Temperature / K 0.0 0.2 0.4 0.6 0.8 1.0 Height / km HAMSTRAD ARPEGE Radiosonde 5 March 18:00 UTC 5 March
12:00 UTC 12:00 UTC4 March
4 March 18:00 UTC
Figure 13. Vertical distribution of temperature measured by HAM-STRAD (solid line) and radiosondes (dashed lines) and calculated by ARPEGE (dotted lines) on 4 March 12:00 UTC (red line) and 18:00 UTC (orange line) and on 5 March 12:00 UTC (blue line) and 18:00 UTC (green line). Note radiosondes are only available at 12:00 UTC.
18:00 UTC, in the core of the diamond dust/ice fog episode, the vertical structure of the temperature observed by HAM-STRAD showing a positive gradient (218 to 227 K from 100 to 500 m) is opposite to the negative gradient of ARPEGE temperature (228 to 226 K from the surface to 400 m). Con-sistent with Fig. 13, the radiative impact of the thick cloud is to enlarge the net irradiance by about 15 W m−2and thus to locally increase temperature as measured by HAMSTRAD and calculated by ARPEGE, whilst the radiative impact of the diamond dust/ice fog is to reduce the net irradiance by about 15 W m−2and thus to locally decrease temperature as measured by HAMSTRAD but not calculated by ARPEGE. Consequently, the ice cloud calculated by ARPEGE on 5 March over the vertical domain 0–1 km (Fig. 9) is certainly
Figure 14. (a, b) Five-day back trajectories of air masses originated from Dome C on 25 March 2011 at 12:00 UTC (a) and on 5 April 2011 at 12:00 UTC (b) at 650 (pink line), 600 (red line), 500 (green line), 400 (light blue line) and 300 hPa (dark blue line). (c, d) Same as (a, b) but on 4 March 2013 at 08:00 UTC (c) and on 5 March 2013 at 18:00 UTC (d).
advected and cannot be considered as a diamond dust/ice fog episode locally produced as suggested by the observations.
If we synthesize our findings, we can state the following. The time evolution of temperature, absolute humidity, ice and aerosol fields obviously shows two episodes of abrupt changes. Firstly, a warm and wet period is associated with a thick cloud that develops from the surface to 5–8 km above the ground and is constituted of ice crystals that precipitate. Secondly, a cold and dry period is associated with a thin cloud that develops close to the surface (100–200 m) and is constituted of ice crystals with a longer suspension time in the air. This later episode is known as diamond dust/ice fog episode. The operational models take into account in-teractions between liquid and solid water phases but are en-able to actually simulate the number of droplets that depends on their sizes. Consequently, models can estimate the pres-ence of thick clouds but cannot reproduce diamond dust/ice fog episodes. A more sophisticated cloud microphysics such as a two-moment scheme like LIMA (Liquid Ice Multiple Aerosols) (Vié et al., 2016) and an explicit aerosol scheme (Girard et al., 2001) would favour the local production of ice crystals in the planetary boundary layer.
5 Discussion
In this section, we investigate the processes that contributed to the presence of a thick cloud and a diamond dust/ice fog episode above the Dome C station by considering the origin of air masses, the integrated water vapour fields over Antarc-tica and the temperature and water vapour budgets calculated by ARPEGE.
5.1 Origin of air masses
Both the impact of the origin of air masses on the short-term variability of H2O and temperature and the high
cor-relation coefficient (greater than 0.90) between water vapour and temperature at Dome C over the entire year 2010 were presented in Ricaud et al. (2012, 2014c) based on 5-day back-trajectory calculations. We propose, in the present study, to use the same methodology to interpret the time evolution of the atmosphere during the two above-mentioned episodes. We have thus considered a 5-day back-trajectory study based upon the European Centre for Medium-Range Weather Fore-casts (ECMWF) analyses starting from the Dome C location at five different pressure levels from the planetary boundary
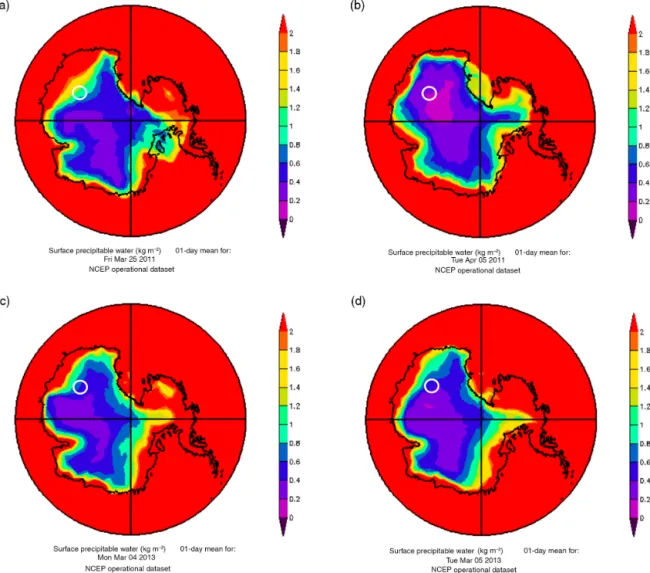
Figure 15. IWV calculated above the Antarctic continent from the NCEP/NCAR operational analyses on 25 March 2011 (a), 5 April 2011 (b), 4 March 2013 (c) and 5 March 2013 (d). The white circle represents the position of the Dome C station.
layer (650 and 600 hPa) to the free troposphere (500, 400 and 300 hPa).
For episode 1, Fig. 14a shows the 5-day back trajectories at the five selected pressure levels during the warm and wet pe-riod (see the Sect. 3) on 25 March 2011 at 12:00 UTC corre-sponding to the time of maximum temperature and absolute humidity of an air parcel issued from Dome C. In the low-ermost layers (650 and 600 hPa), the air parcels are mainly issued from the Antarctic continent. However, higher up, at 500, 400 and 300 hPa, air masses come from the oceanic mid-dle latitudes, between Australia and New Zealand, an imprint of warm and wet air masses. When air masses in the free tro-posphere reach the Antarctic continent, they are uplifted and temperature decreases by more than 50 K (not shown). Note the air parcel at 400 hPa that originated from oceanic high latitudes in the vicinity of the Antarctic continent but moved towards the middle oceanic latitudes with a net subsidence and an increase of temperature of 30 K.
Regarding the diamond dust/ice fog period, Fig. 14b shows the 5-day back trajectories at the five selected pressure levels on 5 April 2011 at 12:00 UTC, corresponding to the time of minimum temperature and absolute humidity of an air parcel issued from Dome C. We can note that all the cal-culated air masses are originated from the Antarctic Plateau whatever the pressure level considered. Consequently, as al-ready studied in Ricaud et al. (2012, 2014c), we expect that both temperature and H2O tend to decrease on 5 April at
12:00 UTC compared to the surrounding periods because air masses with continental origins produce a cold and dry at-mosphere above Dome C (as on 5 April 2011).
For episode 2, Fig. 14c shows the 5-day back trajecto-ries at the four selected pressure levels of 650, 600, 500 and 400 hPa during the warm and wet period (see Sect. 4) on 4 March 2013 at 08:00 UTC, corresponding to the time of max-imum temperature and absolute humidity of an air parcel is-sued from Dome C. At 650 hPa, the air parcel has a continen-tal origin but migrates very close to the coast 2 days before
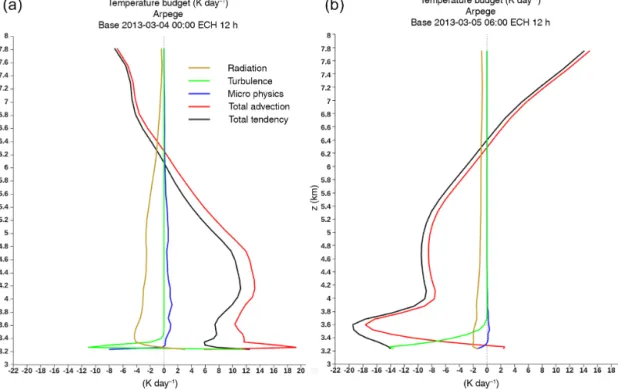
Figure 16. (a) Temperature budget calculated by ARPEGE on 4 March 2013 over the 12 h period 00:00–12:00 UTC induced by radiation (brown), turbulence (green), microphysics (blue) and total advection (red), showing the total tendency (black). (b) Same as (a) but on 5 March 2013 over the 12 h period 06:00–18:00 UTC.
reaching Dome C. Above, at 600, 500 and 400 hPa, all the air masses are coming from the oceanic middle–high latitudes ranging from 47 to 63◦S and from the surface to ∼ 680 hPa, namely an imprint of warm and wet air masses. As for episode 1, when air parcels in the free troposphere reach the Antarctic continent, they are uplifted and temperature de-creases by 20–30 K (not shown). On 5 March at 18:00 UTC (Fig. 14d) during the cold and dry period of episode 2 corre-sponding to the time of minimum temperature and absolute humidity, the meteorological situation is radically different. Whatever the pressure level considered, the air parcels are all confined to the Antarctic Plateau in the vicinity of the Dome C station, explaining again, as for episode 1, the cold and dry atmosphere observed during episode 2.
5.2 Integrated water vapour over Antarctica
The IWV fields calculated by the NCEP/NCAR operational analyses (Kalnay et al., 1996) on 25 March 2011 and 5 April 2011 for episode 1 over the Antarctic continent (Fig. 15a and b, respectively) show that the East Antarctic Plateau is much wetter on 25 March than on 5 April. The IWV calculated over the Dome C station is ∼ 1.4 kg m−2 on 25 March 2011 and ∼ 0.6 kg m−2 on 5 April 2011 in excel-lent agreement with the HAMSTRAD measurements (see Sect. 3.3). This is induced by the oceanic-origin flux bring-ing warm and wet air masses over the Dome C station on 25 March and by the continent-origin flux bringing cold and
dry air masses over the station on 5 April. The same exer-cise can be performed for the episode 2 (Fig. 15c and d, respectively) considering the IWV fields as calculated by the NCEP/NCAR operational analyses on 4 and 5 March 2013. There, the IWV fields above Dome C show a simi-lar pattern between 4 and 5 March but with a smaller wet inflection on 4 March compared to 5 March with daily-averaged values of ∼ 0.6 and ∼ 0.4 kg m−2, respectively, consistent with the daily-averaged values obtained at Dome C with HAMSTRAD (∼ 0.55 and ∼ 0.30 kg m−2, respec-tively). Consequently, considering episodes 1 and 2, the thick cloud episodes observed during the warm and wet period above Dome C are attributed to air masses with an oceanic origin whilst the diamond dust/ice fog episodes occurred dur-ing the cold and dry period are attributed to air masses with continental origins.
5.3 Temperature and water vapour budgets
Here, we attribute the tendencies of temperature calculated by ARPEGE during episode 2 among radiation, turbulence, microphysics and total advection and the tendencies of wa-ter vapour among turbulence, microphysics and total advec-tion. Figure 16 shows the temperature budget calculated on 4 March 2013 over the warm and wet 12 h period 00:00– 12:00 UTC and on 5 March 2013 over the dry and cold 12 h period 06:00–18:00 UTC whilst Fig. 17 focusses on the wa-ter vapour budget.
Figure 17. (a) Water vapour budget calculated by ARPEGE on 4 March 2013 over the 12 h period 00:00–12:00 UTC induced by turbulence (green), microphysics (blue) and total advection (red), showing the total tendency (black). (b) Same as (a) but on 5 March 2013 over the 12 h period 06:00–18:00 UTC.
For altitudes greater than ∼ 100 m (3333 m a.m.s.l.) above the ground on 4 March and greater than ∼ 200 m on 5 March, the temperature tendency of the warm (Fig. 16a) and of the cold (Fig. 16b) periods is mainly dominated by the advection processes (red lines). This is fully consistent with the inter-pretation of the origin of air masses (previous subsection). Nevertheless, in the planetary boundary layer below approx-imately 100 m on 4 March and below 200 m on 5 March, the temperature tendency of the two periods is also governed by the vertical mixing done by the turbulent processes (green line). Indeed, turbulence always tends to stabilize the atmo-sphere impacted by radiative or dynamical forcing. The ef-fect of the radiative cooling on the surface temperature and its impact on the boundary layer is clearly shown on 5 March (Fig. 16b).
As for temperature, the water vapour tendency of the two periods also needs to be separated at ∼ 100 and ∼ 200 m above the ground on 4 and 5 March, respectively. Above these two limits, the water vapour tendency of the warm pe-riod (Fig. 17a) and of the cold (Fig. 17b) pepe-riods is governed by both the advection and the microphysical processes. On 4 March, warmer and more humid air is advected (total water vapour tendency in Fig. 17a and total temperature advection in Fig. 16a are positive), so the microphysics tend to cre-ate some clouds by condensation (negative microphysics ten-dency, blue line in Fig. 17a) with weak precipitations close to the surface (∼ 18 mm in 12 h, not shown). On 5 March (Fig. 17b), the water vapour advection (red line) is negative
so a drier air is advected toward the Dome C station. Below ∼200 m, advection, turbulence and microphysical (precipi-tation) processes compete to dehydrate the planetary bound-ary layer.
In general, this reinforces our conclusions of thick cloud episodes driven by warm and wet air masses of oceanic origin and of diamond dust/ice fog episodes driven by cold and dry air masses of continental origin. Nevertheless, in the plane-tary boundary layer below approximately ∼ 100–200 m, the water vapour tendency of the two periods is competing be-tween advection, microphysical and turbulence processes.
6 Conclusions
The present study takes the opportunity to combine several measurements and operational model outputs to study the short-term evolution of the Antarctic atmosphere above the Dome C station focussing on episodes of thick cloud and di-amond dust/ice fog. The objectives of the paper are mainly to investigate the processes that cause these episodes based on observations and to verify whether operational models can evaluate them. From 15 March to 8 April 2011 and from 4 to 5 March 2013, the atmosphere has been probed by sev-eral instruments: (1) a ground-based microwave radiome-ter (HAMSTRAD) installed at Dome C that provided ver-tical profiles of tropospheric temperature and absolute hu-midity with a 7 min integration time; (2) daily radiosound-ings launched at 12:00 UTC at Dome C; (3) a tropospheric
aerosol lidar that provides aerosol depolarization ratio along the vertical; (4) down- and upward short- and long-wave ra-diations from an instrument installed at Dome C belonging to the BSRN; (5) an ICE-CAMERA to detect at an hourly rate the size of the ice crystal grains deposited at the surface of the camera; (6) space-borne aerosol depolarization ratio from the CALIOP aboard the CALIPSO platform along or-bits close to the Dome C station.
The time evolution of the atmosphere over the 1-month pe-riod in 2011 has also been evaluated by considering the out-puts from the mesoscale model AROME in three configura-tions: (1) “operational”, operating mode with a snow albedo of 0.80; (2) “operational with ice tuning”, as in “operational” but with a setting of snow albedo that can reach up to 0.85; and (3) “ARPEGE microphysics”, as in “operational with ice tuning” but includes the physics of ARPEGE and a state-of-the-art scheme to represent the snow pattern taking into ac-count the roughness length. The ARPEGE global-scale me-teorological model analyses gave the state of the atmosphere and relevant prognostics (ice precipitation, temperature and water vapour budget) on 4 and 5 March 2013.
Considering upward and downward active measurements of aerosols from two lidars installed at Dome C and aboard a space-borne platform, respectively, together with downward and upward long-wave radiations, the signature of a thick cloud with high depolarization ratios (greater than 30 %) is detected during two periods (24–26 March 2011 and 4 March 2013) from the surface to ∼ 5–7 km above the ground with precipitation of ice particles and the presence of a su-percooled liquid water cloud with low depolarization ratios (∼ 10 %). These two periods are shown to be warm and wet by considering HAMSTRAD and radiosonde measurements. Over two other periods (5 April 2011 and 5 March 2013), di-amond dust and/or ice fog are detected with high depolariza-tion ratios (greater than 30 %) in the planetary boundary layer to a maximum altitude of 100–300 m above the ground with little trace of precipitation. These two periods are shown to be cold and dry by considering HAMSTRAD and radiosonde measurements.
The presence of a thick cloud during the warm and wet periods of 2011 and 2013 is calculated by the operational models of AROME and ARPEGE in the free troposphere extending from the surface to ∼ 6 km above the ground. In the three configurations of AROME, high nebulosity val-ues (greater than 0.8) are calculated close to the surface (0– 200 m), almost systematically in the two first configurations (operational and operational with ice tuning). The AROME model tends to produce a sort of cloud residual in the plan-etary boundary layer in the three configurations analysed so the presence of a thin cloud close to the surface cannot be ruled out. ARPEGE also calculates ice precipitation during the thick cloud event. However, the diamond dust/ice fog episodes have not been evaluated in the planetary bound-ary layer during the cold and dry periods by the operational models. No liquid water clouds have been estimated by the
ARPEGE analyses. Although operational models can repro-duce thick cloud episodes in the free troposphere, they cannot evaluate the diamond dust/ice fog episodes in the planetary boundary layer because they require to use more sophisti-cated cloud and aerosol microphysics schemes.
Considering 5-day back trajectories from Dome C and global distributions of IWV over the Antarctic in 2011 and 2013 tends to show that the thick cloud episodes observed during the warm and wet periods above Dome C can be at-tributed to air masses with an oceanic origin whilst the dia-mond dust/ice fog episode occurring during the cold and dry periods can be attributed to air masses with continental ori-gins. Thus, diamond dust/ice fog episodes are driven by local processes whilst thick cloud episodes are driven by regional processes. This is confirmed by the ARPEGE temperature tendencies calculated during the warm and the cold periods of 2013 that are mainly dominated by the advection com-ponents whilst the water vapour tendencies are governed by both the advection and the microphysical processes.
Data availability. The HAMSTRAD data are publicly accessi-ble in France at Météo-France: http://www.cnrm-game-meteo.fr/ spip.php?article961&lang=en. The lidar images are publicly ac-cessible in Italy at INO-CNR: http://lidarmax.altervista.org/lidar/ AntarcticLIDAR.php. The CALIOP images are publicly accessible in the USA at NOAA/ESRL: http://www.esrl.noaa.gov/psd/.
Competing interests. The authors declare that they have no conflict of interest.
Acknowledgements. The present research project HAMSTRAD programme (910) has been performed at the Dome C station and was supported by the French Polar Institute, Institut polaire français Paul-Émile Victor (IPEV), the Institut National des Sciences de l’Univers (INSU)/Centre National de la Recherche Scientifique (CNRS), Météo-France and the Centre National d’Études Spatiales (CNES). The permanently manned Concordia station is jointly operated by IPEV and the Italian Programma Nazionale di Ricerche in Antartide (PNRA). We would like to thank all the winter-over personnel who worked at Dome C on the different projects: HAMSTRAD, Routine Meteorological Observations (RMO), aerosol lidar and BSRN. Thanks to the British Atmospheric Data Centre, which is part of the Natural Environment Research Council (NERC) National Centre for Atmospheric Science (NCAS), for the calculation of trajectories and access to European Centre for Medium-Range Weather Forecasts (ECMWF) data. We have used NCEP Reanalysis data provided by the NOAA/OAR/ESRL PSD, Boulder, Colorado, USA, from their website at http://www.esrl.noaa.gov/psd/. The authors also would like to thank the CALIPSO science team for providing the CALIOP images at http://www-calipso.larc.nasa.gov/. HAMSTRAD data are available at http://www.cnrm.meteo.fr/spip.php?article961&lang=en. RMO data are available at http://www.climantartide.it. We finally would like to thank the three anonymous reviewers for their fruitful
comments.
Edited by: M. Petters
Reviewed by: three anonymous referees
References
Adhikari, L., Wang, Z., and Deng, M.: Seasonal variations of Antarctic clouds observed by CloudSat and CALIPSO satellites, J. Geophys. Res., 117, D04202, doi:10.1029/2011JD016719, 2012.
Argentini, S., Viola, A., Sempreviva, A. M., and Petenko, I.: Sum-mer boundary-layer height at the plateau site of Dome C, Antarc-tica, Bound.-Lay. Meteorol., 115, 409–422, 2005.
Bailey, M. P. and Hallett, J: A comprehensive habit diagram for at-mospheric ice crystals: Confirmation from the laboratory, AIRS II, and other field studies, J. Atmos. Sci., 66, 2888–2899, 2009. Bazile, E., Marquet, P., Bouteloup, Y., and Bouyssel, F.: The
Turbu-lent Kinetic Energy (TKE) scheme in the NWP models at Météo-France, ECMWF Proceedings “Workshop on Diurnal cycles and the stable boundary layer”, 127–136, 2011.
Bazile, E., Couvreux, F., Le Moigne, P., and Genthon, C.: First Workshop on the GABLS-4 Intercomparison, GEWEX Newslet-ter, 18–19, August 2015.
Bouteloup, Y., Bouyssel, F., and Marquet, P.: Improvements of Lopez’s progonostic large scale cloud and precipitation scheme, ALADIN Newsletter, 28, 66–73, 2005.
Brasseur, G. P., Orlando, J. J., and Tyndall, G. S.: Atmospheric chemistry and global change, 2nd Edn., Oxford University Press, New York, Oxford, ISBN-0-19-510521-4, 1999.
Davis, D., Nowak J. B., Chen G., Buhr M., Arimoto R., Hogan A., Eisele F., Mauldin L., Tanner D., Shetter R., Lefer B., and Mc-Murry P.: Unexpected high levels of NO observed at South Pole, Geophys. Res. Lett., 28, 3625–3628, 2001.
Douville, H., Royer, J.-F., and Mahfouf, J.-F.: A new snow parame-terization for the Météo-France climate model, Part I : Validation in stand-alone experiments, Clim. Dynam., 12, 21–35, 1995. Dufresne, J. L. and Bony, S.: An assessment of the primary sources
of spread of global warming estimates from coupled atmosphere-ocean models, J. Climate, 21, 5135–5144, 2008.
Fouquart, Y. and Bonnel, B.: Computations of solar heating of the earth’s atmosphere: a new parameterization, Beitr. Phys. Atmo-sph., 53, 35–62, 1980.
Girard, E. and Blanchet, J. P.: Microphysical parameterization of Arctic diamond dust, ice fog, and thin stratus for climate models. J. Atmos. Sci., 58, 1181–1198, 2001.
Gultepe, I., Kuhn, T., Pavolonis, M., Calvert, C., Gurka, J., Heyms-field, A. J., Liu, P. S. K., Zhou, B., Ware, R., Ferrier, B., Mil-brandt, J., and Berstein, B.:Ice fog in Arctic during FRAM-ICE Fog project: Aviation and Nowcasting Applications, B. Am. Me-teorol. Soc., 95, 211–226, 2014.
Hines, K. M., Bromwich, D. H., Rasch, P. J., and Iacono, M. J.: Antarctic clouds and radiation within the NCAR cli-mate models, J. Clicli-mate, 17, 1198–1212, doi:10.1175/1520-0442(2004)017<1198:ACARWT>2.0.CO;2, 2004.
Hudson, S. R., Warren, S. G., Brandt, R. E., Grenfell, T. C., and Six, D.: Spectral bidirectional reflectance of Antarctic snow:
Mea-surements and parameterization, J. Geophys. Res., 111, D18106, doi:10.1029/2006JD007290, 2006.
Kalnay, E., Kanamitsu, M., Kistler, R., Collins, W., Deaven, D., Gandin, L., Iredell, M., Saha, S., White, G., Woollen, J., Zhu, Y., Leetmaa, A., Reynolds, R., Chelliah, M., Ebisuzaki, W., Higgins, W. Janowiak, J., Mo, K. C., Ropelewski, C., Wang, J., Jenne, R., and Dennis Joseph, D.: The NCEP/NCAR 40-Year Reanalysis Project, B. Am. Meteorol. Soc., 77, 437–471, 1996.
Lanconelli, C., Busetto, M., Dutton, E. G., König-Langlo, G., Maturilli, M., Sieger, R., Vitale, V., and Yamanouchi, T.: Po-lar baseline surface radiation measurements during the Inter-national Polar Year 2007–2009, Earth Syst. Sci. Data, 3, 1–8, doi:10.5194/essd-3-1-2011, 2011.
Lawson, R. P., Baker, B. A., Zmarzly, P., O’Connor, D., Mo, Q., Gayet, J. F., and Shcherbakov, V.: Microphysical and optical properties of atmospheric ice crystals at South Pole Station, J. Appl. Meteorol., 45, 1505–1524, 2006.
Lazzara, M.: Diagnosing Antarctic fog, 5th International Confer-ence on Fog, Fog Collection and Dew, Münster, Germany, 25–30 July 2010, 1, 150 pp., available at: http://meetingorganizer. copernicus.org/FOGDEW2010/FOGDEW2010-150.pdf, (last access: 19 April 2017), 2010.
Lindqvist, H., Muinonen, K., Nousiainen, T., Um, J., McFarquhar, G. M., Haapanala, P., Makkonen, R., and Hakkarainen, H.: Ice-cloud particle habit classification using principal components, J. Geophys. Res., 117, D16206, doi:10.1029/2012JD017573, 2012. Lopez, P.: Implementation and validation of a new prognostic large-scale cloud and precipitation scheme for climate and data assim-ilation purposes, Q. J. Roy. Meteorol. Soc., 128, 229–257, 2002. Lubin, D., Chen, B., Bromwich, D. H., Somerville, R. C., Lee, W. H., and Hines, K. M.: The Impact of Antarctic Cloud Radiative Properties on a GCM Climate Simulation, J. Climate, 11, 447– 462, 1998.
Miloshevich, L. M., Vömel, H., Whiteman, D. N., Lesht, B. M., Schmidlin, F. J., and Russo, F.: Absolute accuracy of water vapor measurements from six operational radiosonde types launched during AWEX-G and implications for AIRS validation, J. Geo-phys. Res., 111, D09S10, doi:10.1029/2005JD006083, 2006. Miloshevich, L. M., Vömel, H., Whiteman, D. N., and Leblanc,
T.: Accuracy assessment and corrections of Vaisala RS92 ra-diosonde water vapour measurements, J. Geophys. Res., 114, D11305, doi:10.1029/2008JD011565, 2009.
Mishchenko, M. I., J. W. Hovenier, and L. D. Travis (Eds.): Light Scattering by Nonspherical Particles: Theory, Measurements, and Applications, Academic Press, 14, 393–416, 2000.
Mlawer, E. J., Taubman, S. J., Brown, P. D., Iacono, M. J., and Clough, S. A.: Radiative transfer for inhomogeneous atmo-spheres: RRTM, a validated correlated-k model for the longwave, J. Geophys. Res., 102, 16663–16682, 1997.
Morcrette, J.-J., Mlawer, E. J., Iacono, M. J., and Clough, S. A.: Impact of the radiation transfer scheme RRTM in the ECMWF forecasting system, ECMWF Newsletter, 91, 2–9, 2001. Palchetti, L., Bianchini, G., Di Natale, G., and Del Guasta,
M.: Far infrared radiative properties of water vapor and clouds in Antarctica, B. Am. Meteorol. Soc., 96, 1505–1518, doi:10.1175/BAMS-D-13-00286.1, 2015
Pirazzini, R.: Surface albedo measurements over Antarc-tic sites in summer, J. Geophys. Res., 109, D20118, doi:10.1029/2004JD004617, 2004.
Ricaud, P., Gabard, B., Derrien, S., Chaboureau, J.-P., Rose, T., Mombauer, A., and Czekala, H.: HAMSTRAD-Tropo, A 183-GHz Radiometer Dedicated to Sound Tropospheric Water Vapor Over Concordia Station, Antarctica, IEEE Trans Geosci Remote Sens., 48, 1365–1380, doi:10.1109/TGRS.2009.2029345, 2010. Ricaud, P., Genthon, C., Durand, P., Attié, J.-L., Carminati, F.,
Canut, G., Vanacker, J.-F., Moggio, L., Courcoux, Y., Pellegrini, A., and Rose, T.: Summer to Winter Diurnal Variabilities of Tem-perature and Water Vapor in the lowermost troposphere as ob-served by the HAMSTRAD Radiometer over Dome C, Antarc-tica, Bound.-Lay. Meteorol., 143, 227–259, doi:10.1007/s10546-011-9673-6, 2012.
Ricaud, P., Carminati, F., Attié, J.-L., Courcoux, Y., Rose, T., Gen-thon, C., Pellegrini, A., Tremblin, P., and August, T: Quality As-sessment of the First Measurements of Tropospheric Water Vapor and Temperature by the HAMSTRAD Radiometer over Concor-dia Station, Antarctica, IEEE T. Geosci. Remote, 51, 3217–3239, doi:10.1109/TGRS.2012.2225627, 2013.
Ricaud, P., Carminati, F., Courcoux, Y., Pellegrini, A., Attié, J.-L., El Amraoui, L., Abida, R., Genthon, C., August, T., and Warner, J.: Statistical Analyses and Correlation between Tropospheric Temperature and Humidity at Dome C, Antarctica, Antarct. Sci., 26, 290–308. doi:10.1017/S0954102013000564, 2014a. Ricaud, P.: Variabilités de la vapeur d’eau et de la température
troposphérique au Dôme C (station Concordia), Antarctique. Partie I: l’instrument Hamstrad, La Météorologie, 84, 15–28, doi:10.4267/2042/53184, 2014b.
Ricaud, P.: Variabilités de la vapeur d’eau et de la température troposphérique mesurées par le radiomètre micro-onde HAM-STRAD au Dôme C, Antarctique. Partie II : Résultats scien-tifiques, La Météorologie, 85, 35–46, doi:10.4267/2042/53749, 2014c.
Ricaud, P., Grigioni, P., Zbinden, R., Attié, J.-L., Genoni, L., Gale-andro, A., Moggio, A., Montaguti, S., Petenko, I., and Legovini, P.: Review of tropospheric temperature, absolute humidity and integrated water vapour from the HAMSTRAD radiometer in-stalled at Dome C, Antarctica, 2009–14, Antarct. Sci., 27, 598– 616, doi:10.1017/S0954102015000334, 2015.
Seity, Y., Brousseau, P., Malardel, S., Hello, G., Bénard, P., Bouttier, F., Lac, C., and Masson, V.: The AROME-France Convective-Scale Operational Model, Mon. Weather Rev., 139, 976–991, 2011.
Tomasi, C., Petkov, B., Benedetti, E., Vitale, V., Pellegrini, A., Dar-gaud, G., De Silvestri, L., Grigioni, P., Fossat, E., Roth, W. L., and Valenziano, L.: Characterization of the atmospheric temper-ature and moisture conditions above Dome C (Antarctica) during austral summer and fall months, J. Geophys. Res., lll, D20305, doi:10.1029/2005jD006976, 2006.
Tomasi, C., Petkov, B., Benedetti, E., Valenziano, L., and Vi-tale, V.: Analysis of a 4 year radiosonde dataset at Dome C for characterizing temperature and moisture conditions of the Antarctic atmosphere, J. Geophys. Res., 116, D15304, doi:10.1029/2011JD015803, 2011.
Tomasi, C., Petkov, B. H., and Benedetti, E.: Annual cycles of pressure, temperature, absolute humidity and precipitable wa-ter from the radiosoundings performed at Dome C, Antarc-tica, over the 2005–2009 period, Antarct. Sci., 24, 637–658, doi:10.1017/S0954102012000405, 2012.
Tremblin, P., Minier, V., Schneider, N., Al. Durand, G., Ashley, M. C. B., Lawrence, J. S., Luong-van, D. M., Storey, J. W. V., An. Durand, G., Reinert, Y., Veyssiere, C., Walter, C., Ade, P., Calisse, P. G., Challita, Z., Fossat, E., Sabbatini, L., Pellegrini, A., Ricaud, P., and Urban, J.: Site testing for submillimetre as-tronomy at Dome C in Antarctica, Astronom. Astrophys., 535, A112, doi:10.1051/0004-6361/201117345, 2011.
Turner, J., Lachlan-Cope, T. A., Colwell, S., Marshall, G. J., and Connolley, W. M.: Significant Warming of the Antarctic Winter Troposphere, Science, 311, 1914–1917, doi:10.1126/science.1121652, 2006.
Vié, B., Pinty, J.-P., Berthet, S., and Leriche, M.: LIMA (v1.0): A quasi two-moment microphysical scheme driven by a multi-modal population of cloud condensation and ice freezing nuclei, Geosci. Model Dev., 9, 567–586, doi:10.5194/gmd-9-567-2016, 2016.
Walden, V. P., Warren, S. G., and Tuttle, E.: Atmospheric ice crys-tals over the Antarctic Plateau in winter, J. Appl. Meteorol., 42, 1391–1405, 2003.
Winker, D. M., Vaughan, M. A., Omar, A., Hu, Y., Powell, K. A., Liu, Z., Hunt, W. H., and Young, S. A.: Overview of the CALIPSO mission and CALIOP data processing algorithms, J. Atmos. Ocean. Technol., 26, 2310–2323, 2009.
Young, S. A. and Vaughan, M. A.: The retrieval of profiles of par-ticulate extinction from Cloud Aerosol Lidar Infrared Pathfinder Satellite Observations (CALIPSO) lidar data: Algorithm descrip-tion, J. Atmos. Ocean. Technol., 26, 1105–1119, 2009.