Our objective is to demonstrate a mobile event recording
system and its application to the online recording and
analysis of concurrent events in complex behavioral
pro-cesses. This recording system has been used successfully
by researchers from a variety of backgrounds (e.g.,
engi-neering, psychology, and biology) for the online recording
of event sequences in a variety of research contexts
rang-ing from animal behavior to workplace design. To highlight
the system’s potential advantages when recording and
an-alyzing concurrent events in complex behavioral processes,
we use the example of work processes in the inherently
complex work environment of surgical anesthesia.
Human activity in this context is much more complex
than a sequence of single operations. In complex
envi-ronments, several processes related to one or more goals
take place in parallel. Even when focusing on processes
that are directly observable, several forms of co-occurrence
can be witnessed on the organizational and team levels,
as well as on the level of individual task execution.
Sys-tematic investigation of the temporal structure of
com-plex processes, therefore, should comprise the analysis
of concurrent events.
Previous studies of anesthesia work processes have all
faced the methodological problem of recording
concur-rent events online. In our research, however, we
coun-tered this problem by applying an observation method
that is sensitive to concurrent events. This field study,
conducted on the work processes relating to the
admin-istration of anesthesia (Manser, 2002, 2003; Manser &
Wehner, 2002), serves as an example to illustrate the use
of the FIT-System with its specific graphical user
inter-face and its syntax for event recording (Held, 1999) and
data analysis.
Concurrent Events in Anesthesiology Action
Sequences: A Methodological Problem for
Task Analysis
Since the early 1970s, several systematic studies have
been conducted on the individual task execution of
anes-thesiologists in operating theatres (e.g., Held, Brüesch,
Zollinger, Pasch, & Krueger, 2002; Kennedy, Feingold,
Wiener, & Hosek, 1976; Weinger, Herndon, & Gaba, 1997;
Weinger et al., 1994). These studies focused primarily on
ergonomic concerns and were based on observations
made either within the work setting or from filmed
anes-thetic procedures.
Because of the inconsistent assignment of observation
categories among the various researchers, it seems almost
155
Copyright 2005 Psychonomic Society, Inc.
The FIT-System PDA software is commercially available for Palm OS(trademark of PalmSource, Inc.) versions 3.0 and higher. Data transfer requires FIT-System PC software that is available for Windows OS (trademark of Microsoft, Inc.) versions 95 and higher. The authors re-tain a proprietary interest in the software described herein. T.M. is af-filiated with the Institute of Work Psychology, J.H. with the Institute of Hygiene and Applied Physiology, both at ETH. Correspondence relat-ing to this article may be sent to J. Held, Swiss Federal Institute of Tech-nology, Clausiusstrasse 25, CH-8092 Zurich, Switzerland (e-mail: [email protected]).
Note—This article was accepted by the previous editor, Jonathan Vaughan.
A PDA-based system for online recording and
analysis of concurrent events in complex
behavioral processes
JÜRGEN HELD and TANJA MANSERSwiss Federal Institute of Technology (ETH), Zurich, Switzerland
This article outlines how a Palm- or Newtbased PDA (personal digital assistant) system for on-line event recording was used to record and analyze concurrent events. We describe the features of this PDA-based system, called the FIT-System (flexible interface technique), and its application to the analy-sis of concurrent events in complex behavioral processes—in this case, anesthesia work processes. The patented FIT-System has a unique user interface design allowing the user to design an interface template with a pencil and paper or using a transparency film. The template usually consists of a draw-ing or sketch that includes icons or symbols that depict the observer’s representation of the situation to be observed. In this study, the FIT-System allowed us to create a design for fast, intuitive online recording of concurrent events using a set of 41 observation codes. An analysis of concurrent events leads to a description of action density, and our results revealed a characteristic distribution of action density during the administration of anesthesia in the operating room. This distribution indicated the central role of the overlapping operations in the action sequences of medical professionals as they deal with the varying requirements of this complex task. We believe that the FIT-System for online record-ing of concurrent events in complex behavioral processes has the potential to be useful across a broad spectrum of research areas.
istering anesthesia—has been a major, recurring
method-ological problem.
One recording technique for concurrent events has
been to toggle “between the two task categories based on
the frequency each dominated the subject’s time” (Weinger
et al., 1994, p. 79). This solution, however, has led to new
disadvantages concerning the analysis and interpretation
of the data—for example, “the occurrence of
simultane-ous tasks . . . will result in . . . decreased dwell time
val-ues (task duration)” (Weinger et al., 1994, p. 89).
These methodological problems demonstrate
chal-lenges in the development of an adequate
methodologi-cal approach to human behavior in complex activity
set-tings. In the following section, we describe a new method
that is sensitive to concurrent events and that therefore
provides a means to investigate this key aspect of
com-plex behavioral processes.
METHOD
The following section describes the FIT-System for online event recording and illustrates its functionalities by presenting the example of a study of concurrent events in anesthesiology action sequences. The FIT System
The FIT-System (flexible interface technique) is a patented computer-based method for the mobile recording of observable data
justable loudness) for each data entry tap. In addition, the system al-lows the user to link additional information, such as handwritten notes, to the observation data by using the current count of an en-tered piece of data that is displayed on the PDA screen. The soft-ware stores the Cartesian coordinates of input data and the corre-sponding time codes to the PDA’s memory. Therefore, task symbols on the event recorder interface do not have to be defined for the PDA’s software, which makes the recording system more flexible— this feature allows the user to adapt or enlarge the interface’s set of symbols (e.g., draw new buttons) during the development and pro-totyping phases, and even in real time during online event record-ing. However, during actual study new observation codes must not be introduced, as this would affect the reliability of the data.
For data analysis, the FIT-System user transfers the data files (the lists of coordinates and time stamps) from the hand-held device to a personal computer (PC). On the PC screen, each input data point is represented by a dot in relation to the PDA’s touch screen area. Sub-sequent to the recording process, the user can identify the input data according to the corresponding areas of the interface and can define the data (i.e., assign to them the corresponding predefined observation codes) by drawing polygons with the PC mouse to encircle the input data dots. Labels can then be assigned to the symbols accordingly. Fig-ure 3 presents a PC screen shot of the signatFig-ure or data definition pro-cess related to the FIT-System interface shown in Figure 2.
This signature or data definition procedure results in a list of event definitions, which include, for example, a data point’s label and the related time stamp. The user can then initiate data process-ing accordprocess-ing to a number of different models:
Single object, single channel. This model is based on the as-sumption that all events are related to a single object, such as the
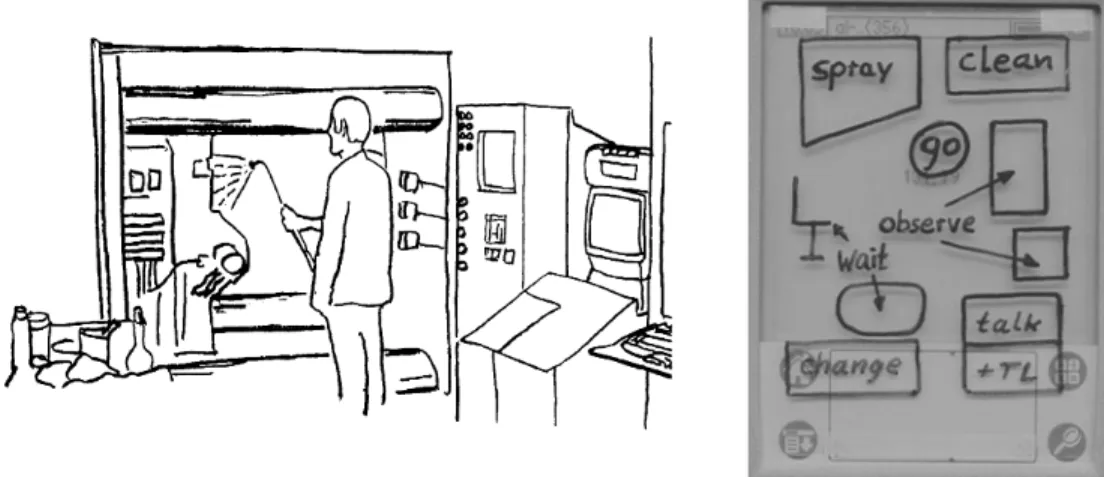
Figure 1. Workplace situation and FIT-System interface for online recording of sequential tasks in in-dustrial production. The transparency overlay covers the liquid crystal display.
worker in the example shown in Figure 1. Events occur sequentially according to this model—that is, every event ends at the time the following one starts.
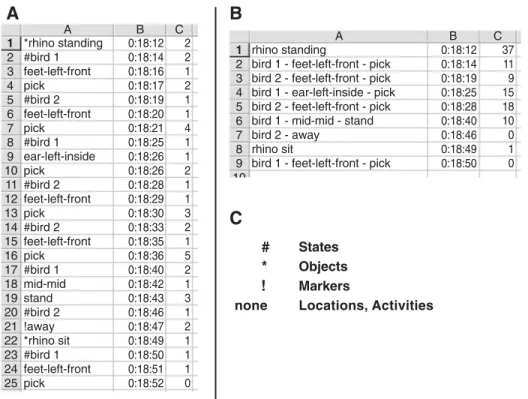
Several states, objects, and markers. A set of prefixes (such as the characters “*,” “#,” and “!”) in the definitions of the events tell the postprocessing data analysis software to distinguish between, for example, states (#), objects (*), or markers (!) and activities or locations (see Figure 4).
Single object, concurrent events. An additional symbol, defined as a delimiter, allows the user to process data in “packages” of par-allel or concurrent events. This model is described in more detail in the remainder of this article.
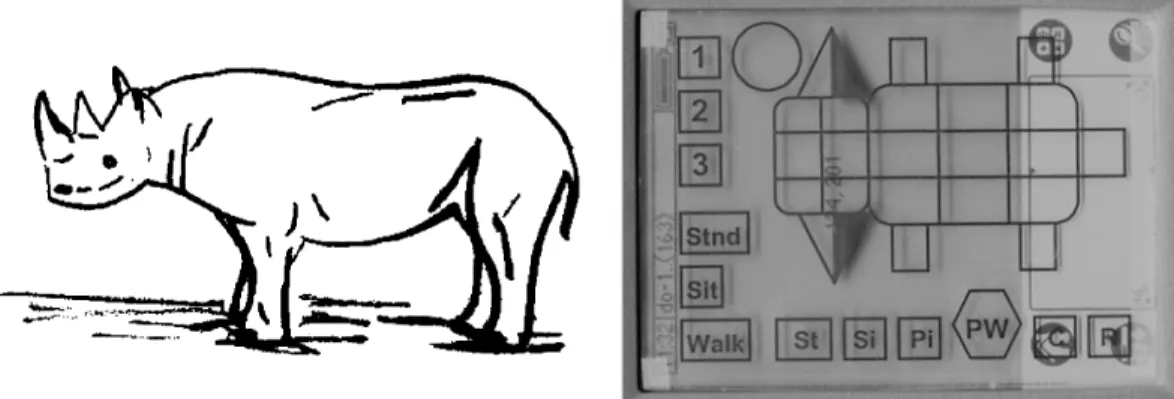
The table of defined event labels we used was written in ASCII format to facilitate its use with standard software; the FIT-System analysis software itself is an add-on for Microsoft’s Excel spread-sheet program. Figure 4 shows an event-time list and its compila-Figure 2. FIT-System interface for online recording of locations and events in the behavior of several oxpecker
birds and a rhinoceros.
Figure 3. Signature of recorded events (locations, states, objects, activities, or markers) related to the application shown in Figure 2.
Unbenannt - FIT Manager
Hand-Held: PalmPilot Data file: do-12.09.03 Template: rhin_def ear-left-inside Definition OK Cancel
tion based on a state-object-location-activity syntax that corre-sponds to the example in Figures 2 and 3.
Aggregation and visualization of the recorded data can be ac-complished with the FIT-System software using five elements: (1) a table of basic descriptive statistics (frequencies, mean values, stan-dard deviations, and quartiles); (2) an adjacency matrix of the graph; (3) a time line chart; (4) a box-plot time line diagram; and (5) a link chart—that is, a representation of event flow. The FIT-System also allows transferring data into the SPSS statistical soft-ware package.
Syntax and Interface for the Recording of Concurrent Events in Anesthesia Work Processes
To record concurrent events, we used a syntax that allows the user to enter all co-occurring events sequentially. To enable the soft-ware to distinguish between different lists of events, we added a symbol to the FIT-System’s interface called “all”; the correspond-ing syntax can thus be called an “actions⫹ all” syntax. The “all” symbol acts as a delimiter that marks the end of each event list. After entering all co-occurring events sequentially, the “all” sym-bol is activated by the user to indicate that a previously entered list of events all started at the same time. We should note that this de-limiter has to be entered after every list of events, even if this list consists of only one element (i.e., there is no co-occurrence of events).
For example, in the case of simultaneously occurring actions A, X, and Z, the observer would tap the A, X, and Z symbols on the FIT-System’s interface overlay and then tap the “all” symbol to in-dicate that A, X, and Z all started at the same time (i.e., the time that the first symbol was activated). As soon as the observer enters the first time stamp for a new event or list of events, the system marks the end of the previously occurring concurrent events. In our ex-ample, if only X continues after a few seconds of actions A, X, and
Z co-occurring, the user would tap the corresponding X symbol and then the “all” symbol to indicate that only one action continues at this point in time.
In Figure 5, the design of the FIT-System interface for our anes-thesia example is depicted along with a mind map structure of the observation categories. The interface contains 41 symbols for the various observation categories, the “all” symbol, and an additional button to mark data entry errors.
We used the FIT-System’s features described above to label the recorded data after the recording process, to distinguish between all recorded lists of concurrent events, and to assign the time stamp of the first element of such a list to each event in that particular list. Figure 6 presents an example of the output in the form of an event-time list (including listings for the “all” symbol) and also shows a box-plot time line diagram illustrating the flow of events. Obtaining Data
A trained observer who was familiar with the operating room en-vironment and its procedures recorded anesthesiologists’ action se-quences throughout 23 cases involving a broad spectrum of surgi-cal and anesthesia procedures. We did not systematisurgi-cally control for a possible reactivity to the presence of an observer. However, the observer had been in the field for several weeks prior to the actual data collection, and most participating anesthesiologists reported that they had gotten used to being observed during this time. Before starting each case, the anesthesiologist was explicitly instructed that patient care was paramount. At the end of each case, the observed anesthesiologist rated the case for whether or not it was routine. Level of Analysis
This study is based on the theoretical framework of activity the-ory (Cole, 1996; Engeström, 1987), which distinguishes between three levels of human practice. Activity is driven by a complex mo-Figure 4. (A) Event-time list of raw data. (B) Its compilation. (C) Meaning of the prefixes. In
Pan-els A and B, column A shows the signature or event definition label, column B shows the time stamp (hh:mm:ss), and column C shows time differences in seconds.
C
13 14 15 16 17 18 19 20 21 22 23 24 25 pick #bird 2 feet-left-front pick #bird 1 mid-mid stand #bird 2 !away *rhino sit #bird 1 feet-left-front pick 0:18:30 0:18:33 0:18:35 0:18:36 0:18:40 0:18:42 0:18:43 0:18:46 0:18:47 0:18:49 0:18:50 0:18:51 0:18:52 3 2 1 5 2 1 3 1 2 1 1 1 0#
*
!
States Objects Markers Locations, Activities nonetive that is collective in nature and that the individual actor is sel-dom aware of. An activity manifests itself in the form of goal-oriented individual actions. Actions in turn rely on incorporated operations that are influenced by the conditions under which they are per-formed. These concepts of activity theory give rise to certain method-ological implications, such as a definition of the unit of analysis (Manser & Wehner, 2002). According to this theoretical frame-work, only operations are directly observable. Moreover, because operations are influenced by the conditions under which they are performed, variations in the concrete conditions, such as the inci-dence of unexpected events, should correspond to variations at the level of operations. Therefore, observation is located on the level of operations that constitute action sequences of individual anesthesi-ologists. Our analysis focuses on the operational composition and potential co-occurrences of operations leading to the identification of different patterns. The complexity of action sequences may vary during the administration of anesthesia in response to, for example, the phase of the anesthesia process or the occurrence of unexpected events.
Observation Categories
On the basis of a literature review, several weeks of temporary at-tendance in the field, and discussions with anesthesia experts, Manser (2002) developed a set of 41 observation codes specific to the administration of anesthesia, each code representing a single operation. The five main categories structuring this set of observa-tion codes were monitoring, manual tasks, communicaobserva-tion, docu-mentation, and additional tasks not belonging to the primary task of providing anesthesia (see Table 1).
Interobserver Agreement
Especially during the development of a new approach to behav-ioral analysis, it is important to assess interobserver agreement. In general, Cohen’s kappa (Cohen, 1960) is used to assess interob-server agreement. In a context of concurrent events, though, we
must remember that single observation codes are not mutually ex-clusive and may co-occur in various combinations. One way to compute Cohen’s kappa would be to regard each combination of two or more observation codes as a “new code” and to assess ob-server agreement on each of these new codes. These results, how-ever, would not be helpful in the definition of observation codes or in the training of observers. Manser (2002) therefore decided to assess interobserver agreement by computing Cohen’s kappa for each ob-servation code separately. Such a methodology means that a com-parison of two independent observers coding during the same ob-servation unit (in our case 1 sec) may result in agreement for one code and nonagreement for another if, for example, one observer codes an event as A and B, whereas another codes the same event as A and C. Moreover, if the observation task involves not only cod-ing but also unitizcod-ing, a lag of a few seconds may also occur be-tween the two observers (e.g., Observer 1 codes A, A, B, B, B, B, and Observer 2 codes A, A, A, B, B, B). In the study used as an ex-ample here, Manser (2002) applied a tolerance of 2 sec in the analy-sis of interobserver agreement described by Bakeman and Gottman (1997). Finally, a weighted average was used to compute an overall score in order not to overestimate interobserver agreement in favor of rare events.
After the assessment of interobserver agreement described above (for details, see Manser, 2002), the results indicated a kappa of .68, which can be regarded as good agreement.
Data Analysis
To analyze the recorded data, we generated quantitative measures of frequency, duration, and percentage of total time for each obser-vation code, as well as for empirical instances of co-occurrence. As we have indicated, this data analysis was carried out using FIT-System software based on Microsoft Excel spreadsheets. In order to de-scribe the extent to which total activity, particular operations, and the number of concurrent operations fluctuated in the course of a specific action sequence, we calculated measures of action density Figure 5. (A) FIT-System interface template for online recording of anesthesia-related concurrent events. (B) Its mind map structure.
A
B
for the overall observation period as well as for different phases of an anesthesia case.
Action density indicates the number of concurrent events in a given time frame. The baseline for action density is by convention 100, meaning that only one observation code occurred during a period with an action density of 100.1Any empirical co-occurrence of
be-havioral events would cause an increase in action density above the defined baseline. If, for example, two codes co-occurred for the whole of a given time period, that action density would equal 200. If the two codes co-occurred for only two thirds of that time period, the resulting action density would be 167.
RESULTS
In the following discussion, we will focus on the
oc-currence of concurrent events or overlapping operations
in the course of administering anesthesia, using two
dif-ferent cases as examples. We will also highlight
varia-tions in action density corresponding to different phases
of anesthesia and the occurrence of unexpected events.
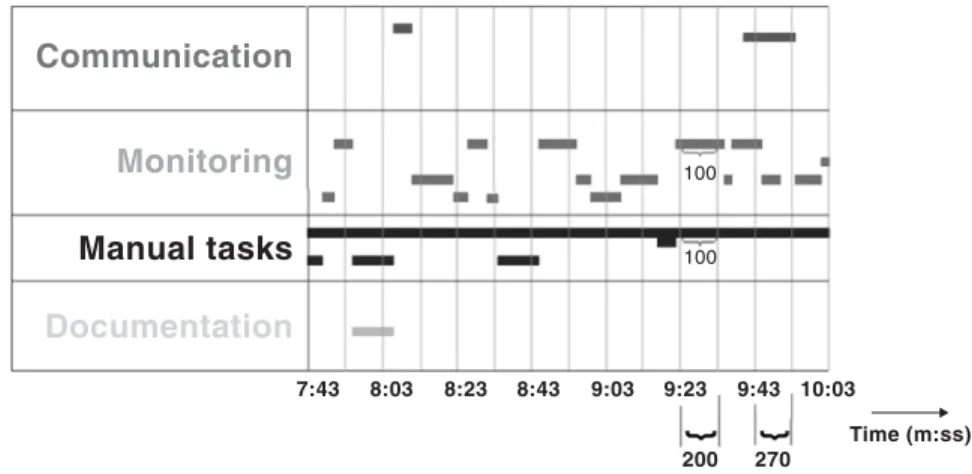
In Figure 7, the structure of overlapping operations is
visualized by using as an example about 2 min of an
ac-tion sequence observed during anesthesia inducac-tion.
It is obvious that overlapping operations are quite
fre-quent during this episode. If we do not consider the
du-ration of an event (i.e., “Manual tasks” and “Monitoring”
from 9:22 to 9:34 would be one event, and so would
“Manual tasks,” “Monitoring,” and “Communication”
from 9:44 to 9:49), 43% of all observed events included
concurrent tasks—that is, two or more overlapping
op-erations. However, events involving such co-occurring
observation codes (and especially more than two such
codes) had generally shorter durations than those
in-volving a single observation code.
Action density helps to reveal the extent to which total
activity and the number of operations fluctuate during
the action sequences observed. Figure 8 shows the
distri-bution of action density and of the main behavioral
cat-egories (i.e., communication, monitoring, manual tasks,
Responsive conversation with patientResponsive conversation with others Response to pager
Monitoring Read patient record Observe patient Observe patient monitors Observe anesthesia machine Observe IV drip
Observe syringe pumps Measurement Scan area Manual tasks Place IV
Give drugs Adjust IV Mask ventilation Intubation/extubation Adjust anesthesia machine Use of other equipment Quitting alarms Suctioning Documentation Patient chart
Labeling (drugs, drips) Additional tasks Positioning of patient
Patient transfer
Tasks of others (circulating nurse, orderly) Arrange workplace
Conversation with observer “Just looking”
Other Miscellaneous
and documentation) during an anesthesia case, which
was rated as routine by the anesthesiologist. Because of
frequent short-term fluctuations in the raw data, the
mov-ing average of action density of the previous 5 min is
charted in this figure.
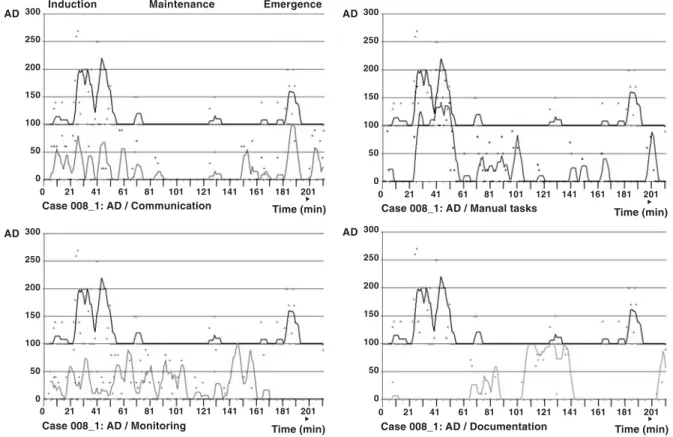
The results of our case analyses show that the action
density during the application of anesthesia to a patient
exhibits a characteristic and distinct distribution. For
ex-ample, two periods that are characterized by increased
action density are the induction of and the emergence
from anesthesia (i.e., putting the patient to sleep and
waking the patient up). The particular behavioral
cate-gories also display a distinct distribution in the course of
the anesthesiologist’s action sequence. For example,
communication is most frequent during the induction of
and the emergence from anesthesia, points at which
sub-Figure 6. Event-time list, including labels describing the meaning of the syntax, and the box-plot time line dia-gram of recorded concurrent events.
Figure 7. The structure of concurrent events during an episode of 2:20 min during induc-tion of anesthesia in case 015_3.
Communication
Monitoring
Manual tasks
Documentation
100 100 7:43 8:03 8:23 8:43 9:03 9:23 9:43 10:03 200 270 Time (m:ss) Event (input in event recorder)Adjust anaesthesia machine All
Arrange workplace All
Responsive conversation with surgeon Arrange workplace
All
Observe patient monitors Arrange workplace All
Adjust anaesthesia machine All … Time Stamp Time Difference 1:53:12 1:53:13 1:53:23 1:53:23 1:53:41 1:53:42 1:53:43 1:53:47 1:53:47 1:53:48 1:53:53 1:53:53 … 1 10 0 18 1 1 4 0 1 5 0 3 … from: 1:53:12 to: 1:57:26 grid width [s]: 1 No. 1 2 3 4 … Event Adjust anaesthesia machine Arrange workplace Responsive conversation with surgeon Observe patient monitors
01:53:12 01:53:22 01:53:32 01:53:42 01:53:52 …
stantial coordination between team members takes place.
Moreover, throughout most cases included in this study,
there was an increase in the percentage of time spent
monitoring operations while maintaining anesthesia
dur-ing actual surgery, in comparison with durdur-ing the
induc-tion of or the emergence from anesthesia, whereas the
percentage of manual measures taken decreased during
the maintenance phase. The highest percentage of
man-ual tasks can be observed during the induction phase,
whereas documentation becomes most concentrated
dur-ing the maintenance phase. Only operations related to
monitoring show a rhythmic curve throughout the entire
anesthesia case. These results are supported by almost
all cases involving general anesthesia that were included
in this study. Moreover, overlapping operations have a
prominent position when anesthetists deal with the
vari-ous requirements relating to unexpected events (Manser
& Wehner, 2002).
DISCUSSION
Concurrent Events and Action Density
The results presented here support the descriptive
va-lidity of action density as an indicator of the frequency
of concurrent events, in our example overlapping
opera-tions in complex action sequences relating to
adminis-tering anesthesia. First, the results show a considerable
number of co-occurrences of observation codes that would
have been neglected using most observation methods.
Second, action density shows a characteristic and
dis-tinct distribution during the course of anesthesia.
As they have been described in the literature concerning
the organization of multiple actions on an individual or a
group level, concurrent actions may occur because of
in-creased task complexity (Fuhrer, 1984; Kaminski, 1973;
Tschan, 1990). Thus, we regard variations in action density
as an indicator helpful for describing how health care
pro-fessionals adopt to the varying complexity of task
require-ments in the course of anesthesia administration,
espe-cially in the case of unexpected complications. Moreover,
the variations in action density revealed in our data fit very
well with the results of research on workload (Gaba & Lee,
1990) during the administration of anesthesia.
Event Recording
One of the advantages of using a PDA for event
re-cording is that one can input data simply by tapping the
pressure-sensitive screen rather than by using a separate
keyboard. In general, the ease of use of the touch screen’s
interface depends on the ergonomic design of the GUI
and on user involvement in the design process
(Interna-tional Organization for Standardization, 1999). In
com-Figure 8. Variations in action density (AD)—that is, in the total number of overlapping operations—and in the relative num-bers of communication, manual task, monitoring, and documentation operations during the course of case 008_1. (Graphs show the moving average over the previous 5 min.)
300 250 200 150 100 50 0 300 250 200 150 100 50 0
Case 008_1: AD / Communication Time (min) Case 008_1: AD / Manual tasks Time (min)
AD AD
0 21 41 61 81 101 121 141 161 181 201 0 21 41 61 81 101 121 141 161 181 201
Time (min) Time (min)
parison with current PDA-based event recording systems,
the FIT-System is unique in the way it provides users
with the autonomy to design their own GUIs (Table 2).
The GUI design method of the FIT-System allows the
user to make the GUI a map of the situation to be
ob-served instead of simply a symmetrical matrix of
but-tons. It should be mentioned that users of the FIT-System
require no interaction with a PDA or PC to design their
GUI template. Other PDA-based event recording
sys-tems force users to configure their coding scheme and
label their buttons on the PC before downloading the
template onto the PDA (e.g., Pocket Observer) or to
per-form all interactions for configuration in dialog with the
PDA software. In comparison with these other PDA
sys-tems, the paper-and-pencil technique used with the
FIT-System has the following advantages:
1. It is a fast, simple, and robust technique that
sup-ports a user’s creativity and allows for the user’s
partici-pation in ergonomic design (Noro & Imada, 1991).
2. It enables the user to design the GUI without
re-strictions in the use of text, graphics, or color. No
spe-cific requirements of brightness, contrast, or colors are
needed when creating the PDA display.
3. It facilitates the prototyping process of the coding
scheme because it allows changes to be made online,
without PDA interaction, and different GUI templates of
the iterative design process to be compared side by side.
4. When used with some PDAs (i.e., those running the
Palm OS), the GUI template has the advantage of
pro-viding 20% more interface area, because the template
covers the “graffiti” field and allows it to be used as an
input area (see Figures 1 and 2).
5. Any kind of symbol or icon can be created on the
in-terface template and any kind of boundaries for the
point-ing area, whereas other systems are more restricted. For
example, the ActoPalm system allows the design of
cir-cular buttons, but only the inner rectangular area of the
circular form is active for pen-stroke recognition.
6. There is room for at least 50 icons (each 7
⫻ 7 mm)
on the template area, which covers 5.5
⫻ 7.0 cm
(Palm-One OS device) or 6.5
⫻ 8.0 cm (Apple Newton device).
The fully adaptable layout of the GUI and the free
arrangement of icons support a customizable relationship
between the mapping of the symbols on the interface and
the individual observation situation. For example, in
Fig-ure 1 the workplace layout is designed relating to tasks
the worker has to perform at several locations. On the
FIT-System interface, the corresponding symbols are
arranged in a way that matches this work setting. To give
another example, in Figure 2 the different areas of the
rhi-noceros’s body an oxpecker bird might sit on are depicted
on the GUI using a schematic drawing of the rhinoceros.
We believe that this kind of customization of an interface
reduces the observer’s mental workload by reducing the
effort required to memorize the syntax and symbols.
We experienced the problem that a user might not
re-member whether a certain event had already been
en-tered or not. The FIT-System resolves this issue by
allow-ing multiple inputs of the same event (see, e.g., Figure 4A,
rows 11 to 16). The data compilation process is
pro-grammed to subsume and compress redundant input data.
We assume that this interaction is faster than scanning
the PDA screen for visual feedback such as, for example,
whether the area around or under a specific symbol or
button is highlighted.
Both PDA-based online recording and video analysis
systems have several advantages and disadvantages,
de-pending on the observation task at hand. One economic
advantage of online recording is the 1:1 ratio of coding
time to observed behavior, because the coding
(identifi-cation and recording of the events) takes place in the
same time frame as the observed behavior. One may
argue, however, that there is no need for the observer to
be present during video capture and that coding from
videotape can also be done in a 1:1 ratio. For example,
one can use the FIT-System or another event recording
system in front of a video screen instead of being
pres-ent in the real situation. This technique has the advantage
of providing a reproducible data source, which is
espe-cially beneficial when assessing interobserver agreement.
We evaluated this argument and made these findings.
1. Identifying events is often difficult when analyzing
videotapes because of the fixed camera perspective and
the reduction of the environment to a two-dimensional
picture. During online recording, in contrast, the
ob-server may continuously change his or her perspective
by (minor) eye, head, or body movements.
2. In analogy with the differences between
face-to-face meetings and video conferencing, we assume that
the online observer uses a broader spectrum of
modali-ties than the two (visual and auditory) captured on
video-tape. Moreover, we found that during online recording
there is more contextual information available than on
video and that this additional information is needed for a
correct coding of events in complex behavioral processes.
Furthermore, in many situations, such as operating
rooms or emergency wards, it is difficult or even
impos-sible to get approval for video recording.
Table 2
GUI Design of Some Current PDA-Based Recording Systems
GUI Design Process Involves System
Changing predefined labels and fixing arrangement of buttons Pocket Observer (Noldus, Inc., www.noldus.com) or EthoScribe (Tima Scientific, www.tima.sci.com) Creating, labeling, and arranging two types of buttons (boxes and circles) ActoPalm (Kerguelen, 1999)
ertheless, further investigation into the operational
com-position of action sequences is needed. Additional
re-search should be done, for example, on the effects of
qualitatively different combinations of overlapping
op-erations in action sequences on human performance in
complex work environments.
None of the information presented here should be
in-terpreted as an argument for restricting the analysis of
complex behavioral processes to medical work alone.
Rather, we would emphasize the need to integrate
numer-ous settings in order to provide a well-rounded and
bal-anced system for investigating human activity and the role
of concurrent events in complex behavioral processes.
REFERENCES
Bakeman, R., & Gottman, J. M. (1997). Observing interaction: An in-troduction to sequential analysis (2nd ed.). Cambridge: Cambridge University Press.
Cohen, J. (1960). Coefficient of agreement for nominal scales. Educa-tional & Psychological Measurement, 20, 37-46.
Cole, M. (1996). Cultural psychology. Cambridge, MA: Harvard Uni-versity Press.
Engeström, Y. (1987). Learning by expanding: An activity-theoretical approach to developmental research. Helsinki: Orienta-Konsultit. Fuhrer, U. (1984). Mehrfachhandeln in dynamischen Umfeldern: Vorschläge zu einer systematischen Erweiterung psychologisch-handlungstheoretischer Modelle. Göttingen: Hogrefe.
Gaba, D. M., & Lee, T. (1990). Measuring the workload of the anes-thesiologist. Anesthesia & Analgesia, 71, 354-361.
Held, J. (1999). Fitting the mental model: A new technique for com-puterised event recording. In D. Harris (Ed.), Engineering psychol-ogy and cognitive ergonomics (pp. 293-300). London: Ashgate.
Cognition.
Manser, T. (2002). Dichte als Texturmerkmal komplexer Arbeits-tätigkeiten: Zur Analyse von Überlagerungen im Handlungsverlauf am Beispiel der Narkoseführung. Zürich: Zentralstelle der Student-enschaft der Universität Zürich.
Manser, T. (2003). Dichte als Merkmal komplexer Arbeitstätigkeiten. In T. Manser (Ed.), Komplexes Handeln in der Anästhesie (pp. 100-174). Pabst: Lengrich.
Manser, T., & Wehner, T. (2002). Analysing action sequences: Vari-ations in action density in the administration of anesthesia. Cogni-tion, Technology, & Work, 4, 71-81.
Noro, K., & Imada, A. (1991). Participatory ergonomics. London: Tay-lor & Francis.
Tschan, F. (1990). Organisationen als sich zielgerichtet verhaltende Systeme: Entwicklung eines theoriegeleiteten Beschreibungssystems im Rahmen einer Fallstudie. Unpublished dissertation, Universität Bern.
Weinger, M. B., Herndon, O. W., & Gaba, D. M. (1997). The effect of electronic record keeping and transesophageal echocardiography on task distribution, workload, and vigilance during cardiac anesthe-sia. Anesthesiology, 87, 144-155.
Weinger, M. B., Herndon, O. W., Zornow, M. H., Paulus, M. P., Gaba, D. M., & Dallen, L. T. (1994). An objective methodology for task analysis and workload assessment in anesthesia providers. Anes-thesiology, 80, 77-92.
NOTE
1. This baseline has been defined on the basis of the assumption that the behavioral codes used are exhaustive. If they are not, action density can drop and reach 0 when no codes occur in a given time period.
(Manuscript received September 24, 2002; revision accepted for publication May 13, 2004.)