The Rockefeller University Press $30.00
BM is one of most actively proliferating tissues
of the body. In humans, 10
11–10
12mature
blood cells are generated per day (Gordon et al.,
2002) from short-lived highly proliferative
he-matopoietic progenitors which arise from a rare
population of hematopoietic stem cells (HSCs)
with multilineage differentiation and self-renewal
capacity (Kondo et al., 2003). Transplantation
studies in mice have shown that a single HSC
is capable of reconstituting and maintaining all
hematopoietic lineages in lethally irradiated
re-cipients for their respective lifetime (Osawa et al.,
1996a; Kiel et al., 2005), or even longer in assays
of serial transplantation (Harrison and Astle,
1982; Allsopp et al., 2003); however,
physio-logical hematopoiesis is at least oligoclonal at
any given time, indicating that it is not
main-tained by offspring of one single HSC (Jordan
and Lemischka, 1990; McKenzie et al., 2006).
Adult BM provides a specialized
microenvi-ronment for HSCs, the so-called “niche,” that
allows HSC maintenance at homeostatic levels.
This process is controlled by both intrinsic
and extrinsic signals, as demonstrated in
mul-tiple animal models with genetic alterations in
nonhematopoietic and hematopoietic tissues
(Orford and Scadden, 2008).
Steady-state HSC cycling kinetics have
been evaluated by in vivo labeling assays with
BrdU (Cheshier et al., 1999; Kiel et al., 2007)
and biotin (Nygren and Bryder, 2008) and, in
recent studies, using both BrdU labeling and
histone 2B GFP (H2B-GFP) transgenic mouse
models (Wilson et al., 2008; Foudi et al., 2009).
BrdU and biotin labeling suggested that all
HSCs divide, on average, every 17.8 d, whereas
combined BrdU and H2B-GFP experiments
revealed two HSC populations, one actively
di-viding about every 9–36 d and one didi-viding
approximately every 56–145 d (Wilson et al.,
2008; Foudi et al., 2009). Assuming conserved
division rates in these populations in steady
state during a 2-yr laboratory mouse lifetime,
the former experiments suggest that HSCs
di-vide 42×, whereas the latter suggest that one
population would divide 20 times and the other
5 times. This might imply that slow dividing
CORRESPONDENCEMarkus G. Manz: [email protected] Abbreviations used: APC, allophycocyanin; Flt3, Fms-like tyrosine kinase 3; H2B-GFP, histon 2B GFP; HSC, hemato-poietic stem cell; LK, Linc-Kit+Sca-1; LKS, Lin c-kit+Sca-1+; PB, peripheral blood; TLR, Toll-like receptor.
H. Takizawa and R.R. Regoes contributed equally to this paper.
Dynamic variation in cycling of hematopoietic
stem cells in steady state and inflammation
Hitoshi Takizawa,
1,2Roland R. Regoes,
3Chandra S. Boddupalli,
1,2Sebastian Bonhoeffer,
3and Markus G. Manz
1,21Institute for Research in Biomedicine, CH-6500 Bellinzona, Switzerland 2Division of Hematology, University Hospital Zürich, CH-8091 Zürich, Switzerland 3Institute of Integrative Biology, ETH Zürich, CH-8092 Zürich, Switzerland
Hematopoietic stem cells (HSCs) maintain blood production. How often mouse HSCs divide
and whether each HSC contributes simultaneously, sequentially, or repetitively to
hemato-poiesis remains to be determined. We track division of 5-(and-6)-carboxyfluorescein
diac-etate succinimidyl ester (CFSE)–labeled HSC in vivo. We found that, in steady-state mice,
bone marrow cells capable of reconstituting lifelong hematopoiesis are found within both
fast-cycling (undergoing five or more divisions in 7 wk) and quiescent (undergoing zero
divisions in 12–14 wk) lineage marker–negative c-Kit
+Sca-1
+populations. The
contribu-tion of each populacontribu-tion to hematopoiesis can fluctuate with time, and cells with extensive
proliferative history are prone to return to quiescence. Furthermore, injection of the
bacte-rial component lipopolysaccharide increased the proliferation and self-renewal capacity of
HSCs. These findings suggest a model in which all HSCs undergo dynamic and
demand-adapted entry into and exit out of the cell cycle over time. This may facilitate a similar
degree of turnover of the entire HSC pool at the end of life.
© 2011 Takizawa et al. This article is distributed under the terms of an Attribution– Noncommercial–Share Alike–No Mirror Sites license for the first six months after the publication date (see http://www.rupress.org/terms). After six months it is available under a Creative Commons License (Attribution–Noncommercial–Share Alike 3.0 Unported license, as described at http://creativecommons.org/licenses/ by-nc-sa/3.0/).
Also, some cytokines produced by immune cells in response
to viral or bacterial infection can activate quiescent HSC
(Essers et al., 2009; Sato et al., 2009; Baldridge et al., 2010).
However, it is thus far unclear if these naturally occurring
stimulants trigger only differentiation or also accelerated HSC
self-renewal. To address the questions of how often HSCs
divide and, thus, possibly contribute simultaneously,
sequen-tially, or repetitively to steady-state hematopoiesis, of whether
there is a relationship between divisional history and blood
forming or repopulating ability, and if HSC self-renewal is
increased in hematopoietic stress upon severe infectious
chal-lenge, we set up an in vivo HSC divisional tracking system using
CFSE labeling.
RESULTS
In vivo CFSE dilution reveals steady-state divisional
heterogeneity of Lin
c-kit
+Sca-1
+(LKS) cells
Because 1% of HSCs are estimated to circulate in
steady-state blood, and some of them physiologically rehome into
the 1% unoccupied BM HSC niches (Wright et al., 2001;
Bhattacharya et al., 2006, 2009), we reasoned that i.v. transfer
of HSC into nonirradiated mice resembles this process
competitively and thus allows evaluation of steady-state HSC
divisional dynamics. To track HSC division with high
reso-lution, we labeled cells with CFSE, a fluorescent dye which is
HSCs would not contribute to relevant amounts of mature
blood cells and could be a dormant reserve, only recruited
upon hematopoietic challenge (Wilson et al., 2008; Foudi
et al., 2009). However, the faster cycling HSCs repopulated
lethally irradiated animals only in the short term, whereas the
dormant HSCs showed long-term repopulation (Wilson et al.,
2008; Foudi et al., 2009). Therefore, these findings face
diffi-culty in explaining how high-throughput hematopoiesis is
maintained by only a small HSC fraction with long-term
po-tential but a very slow division rate. An alternative
explana-tion would be that a single steady-state HSC pool exists that
contains stochastically changing slow and fast dividing HSCs,
with most HSCs within the pool dividing longitudinally at
similar rates.
Although in steady-state adult mice more than two-thirds
of HSCs are in a resting, i.e., G0/G1 phase of cell cycle
(Cheshier et al., 1999), HSC division can be induced in
situa-tions of hematopoietic challenge, for example,
chemother-apeutic treatment, irradiation, and BM transplantation (Trumpp
et al., 2010). Recently, it was demonstrated that HSC-
enriched populations express Toll-like receptors (TLRs), which
recognize bacterial or viral molecules, and that TLR ligation
causes proliferation and enhances production of innate
im-mune cells such as macrophages and dendritic cells for
respec-tive host defense (Nagai et al., 2006; Massberg et al., 2007).
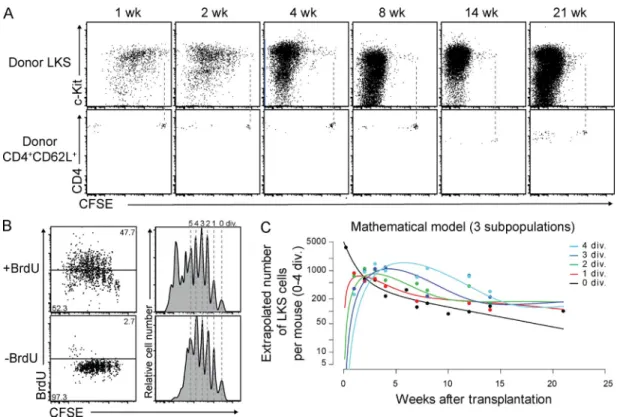
Figure 1. Steady-state divisional heterogeneity of LKS cells revealed by in vivo CFSE dilution. (A) Representative dot plots of BM gated on
donor CD45+Lin (top) and spleen gated on donor CD45+ CD4+CD62L+ (bottom) cells at the indicated time points after transplantation of CFSE-labeled
LKS cells and CD4+CD62L+ cells into nonirradiated mice, respectively. Dashed lines represent CFSE intensity of CD4+CD62L+ cells indicating zero division.
(B) Comparison of in vivo CFSE dilution and BrdU labeling. Dot plots and histograms show representative CFSE-labeled donor LKS cells 3 wk after trans-plantation and after 2 wk of in vivo BrdU labeling and control, respectively. Dashed lines illustrate single divisions. (C) Mathematical model of three LKS subpopulations fitting the CFSE labeling data. See also Materials and methods.
0×-divided non–BrdU-labeled LKS. These data demonstrate
that CFSE labeling provides high-resolution single-division
HSC tracking and reveal that BrdU labeling alters cell cycle
kinetics but, as expected, does not mark the remaining
quies-cent cells. This fact might have had a profound impact on
readout and interpretation of previous studies using the BrdU
labeling and chase assay to evaluate HSC turnover, as cells are
recruited into division and only recently divided and labeled
cells are subsequently monitored, and most 0×-divided
quies-cent cells are not included in the chased population (Cheshier
et al., 1999; Wilson et al., 2008).
To estimate the turnover and loss rate of total LKS cells,
i.e., a population which contains but is not exclusively
com-posed of HSCs (Osawa et al., 1996b), we developed
mathe-matical models assuming that the LKS cell population is
composed of one, two, three, or four subpopulations with
dif-fering rates of proliferation and loss. Fitting these
mathemati-cal models to the CFSE dilution data revealed at least three
subpopulations with different division and differentiation
ki-netics (see Materials and methods and
Table S1
). One
popula-tion was characterized by a high rate of loss and no proliferapopula-tion,
and the remaining two populations roughly correspond to
the fast-cycling and dormant populations identified
previ-ously (Wilson et al., 2008; Foudi et al., 2009).
Expression of HSC and lineage-differentiation markers
by LKS cells upon division
To correlate divisional history with HSC and progenitor cell–
associated surface marker expression, we analyzed lineage
negative cells in BM 3 wk after transfer. 0–2×-divided donor
Lin
c-kit
+cells were positive for Sca-1 (>98%) and the
thrombopoietin receptor c-Mpl (>93%), both of which are
equally distributed to daughter cells upon each cellular division
(Weston and Parish, 1990; Lyons and Parish, 1994). CFSE
la-beling did not impair HSC function, as CFSE-labeled LKS
cells containing HSCs successfully engrafted nonirradiated
animals with stable chimerism of 1% over at least 20 wk
(unpublished data). Transplantation of 10
5LKS into
nonirra-diated mice revealed that 0×-divided Lin
c-Kit
+cells with an
equivalent CFSE intensity to that of naive CD4
+CD62L
+T cells transferred to determine zero cell division CFSE
in-tensity. When mice were irradiated before LKS transfer, all
donor-derived LKS cells had divided ≥5× in 3 wk and high
BM and blood chimerism was established as expected (
Fig. S1
).
Weekly BM analysis of nonirradiated recipient mice
trans-planted with CFSE-labeled LKS showed that most of the
donor cells divided within 4 wk, whereas a small fraction did
not divide over 21 wk, the longest period observed (Fig. 1 A).
0×-divided cells were maintained in the BM, but not in the
spleen, and included LKS cells with a CD150
+and CD34
phenotype, which are reported to be highly enriched for
quiescent HSC (Osawa et al., 1996a; Kiel et al., 2005;
Fig. S2, A and B
). These data demonstrate that in steady state
the majority of LKS cells divide actively and a small fraction
is quiescent.
To compare the HSC-tracking method established in this
study with BrdU labeling (Cheshier et al., 1999; Kiel et al.,
2007), mice were treated with BrdU starting 1 wk after
CFSE-labeled LKS cell transfer. BrdU treatment led to more
LKS divisions, confirming a mitogenic effect of BrdU (Kiel
et al., 2007; Wilson et al., 2008; Fig. 1 B). However, BrdU
in-corporation neither correlated linearly with divisions nor
al-lowed divisional resolution. Most importantly, BrdU did not
recruit all LKS cells into division, leaving behind a fraction of
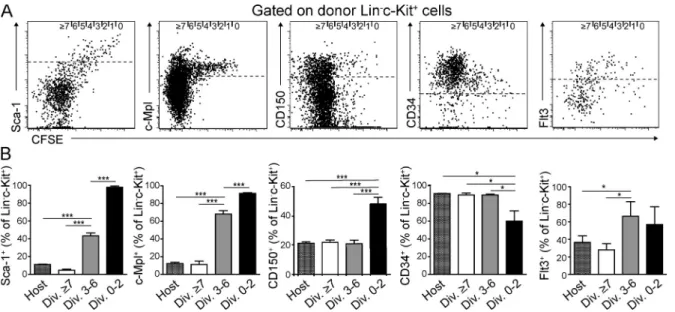
Figure 2. Expression of HSC surface markers upon division of CFSE-labeled LKS cells in BM. (A) Representative dot plots gated on BM donor
Linc-Kit+ cells depicting CFSE label versus Sca-1, c-Mpl, CD150, CD34, and Flt3 expression 3 wk after transplantation of 105 CFSE-labeled LKS cells into
nonirradiated recipients. Dashed lines represent cutoff regarded as positive. 0 to ≥7 divisions (indicated at top of dot plots) were determined according to CFSE intensity. (B) Percentage of Linc-Kit+ cells, positive for indicated surface antigens within total host or 0–2×-, 3–6×-, and ≥7×-divided donor
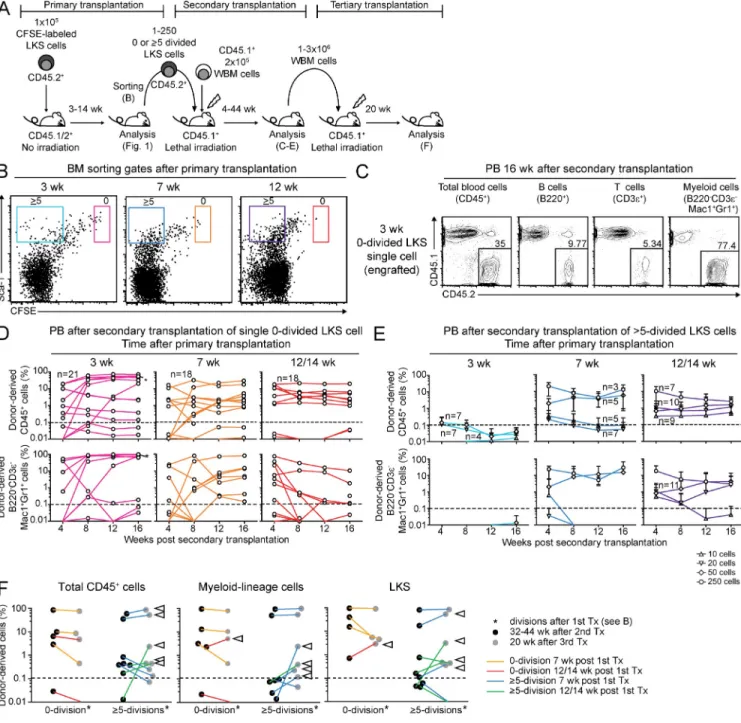
Figure 3. HSCs have heterogeneous divisional activity. (A) Experimental scheme of sequential transplantation. (B) Representative dot plots of
BM from primary LKS transplant recipients gated on donor Linc-Kit+ cells. Sorting gate for 0×- (red, orange, and pink) and ≥5×-divided LKS cells
(light blue, dark blue, and purple) are shown at the indicated time points after primary transplantation. (C–E) PB donor chimerism in indicated popu-lations after secondary transplantation with single 0×-divided LKS cells (C and D) or 10–250 ≥5×-divided LKS cells (E). (C) Representative PB FACS dot plots 16 wk after secondary transplantation with a single 0×-divided LKS cell sorted from primary recipients at 3 wk after LKS transfer. (D) Each line represents sequential data from individual animals (n = 18–21 mice as indicated from four to five independent experiments). Asterisk shows
engraft-ment data of the animal shown in C. Range of donor CD45+ chimerism in engrafted mice 4 mo after secondary transplantation: 32.7–72%, 1.8–
22.5%, and 1.0–19.9% in mice transplanted with LKS cells isolated 3, 7, and 12/14 wk after primary transplantation, respectively. (E) Lines represent all data from four independent experiments with SD error bars (number of mice in each group are indicated at each line). (F) Long-term engraftment of 0×- or ≥5×-divided LKS cells in secondary and tertiary transplants. Donor chimerism in total CD45+ cells, myeloid cells, and LKS cells in BM was
examined 32–44 wk after secondary transplantation (black dots) and 20 wk after tertiary transplantation (gray dots). Each connecting line shows data derived from identical primary donor cells. Arrows represent increase in contribution to hematopoiesis after tertiary transplantation. Dashed line at 0.1% marks cut off determined for nonengraftment.
highly expressed in HSC (Spangrude et al., 1988; Qian et al.,
2007; Yoshihara et al., 2007), and their expression decreased
with division. 40–50% of 0–2×-divided cells were positive for
CD150 (Kiel et al., 2007) and negative for CD34 (Osawa
et al., 1996a), and Fms-like tyrosine kinase 3 (Flt3) expression
(Christensen and Weissman, 2001; Karsunky et al., 2003) was
low in 0–2×-divided and up-regulated in 3–6×-divided cells
(Fig. 2). Some Lin
c-Kit
+cells started to express markers of
lineage commitment like M-CSFR (Onai et al., 2007), IL-7R
(Kondo et al., 1997), and FcRII/III (Akashi et al., 2000;
Kondo et al., 2003) after more than three divisions (Fig. S2,
C and D). Thus, surface marker expression pattern analysis
demonstrates that at 3 wk after transfer, 0–2×-divided cells
displayed a HSC immunophenotype. Furthermore, LKS cell
differentiation to lymphoid or myeloid lineage-committed
progenitors required at least three divisions in steady state.
Heterogeneous cycling activity of functional HSCs
As HSCs represent a minority within LKS cells (Osawa et al.,
1996b) and LKS cell division does not necessarily reflect HSC
divisional dynamics, we determined HSC frequency by in vivo
single-cell and limiting dilution repopulation and serial
transplantation assays. We reisolated defined numbers of
donor LKS cells based on their divisional history at different
time points after primary transfer (Fig. 3 B) and transplanted
these into lethally irradiated secondary recipient mice along
with irradiation-protective whole BM cells, followed by
monthly analysis for donor engraftment (Fig. 3 A).
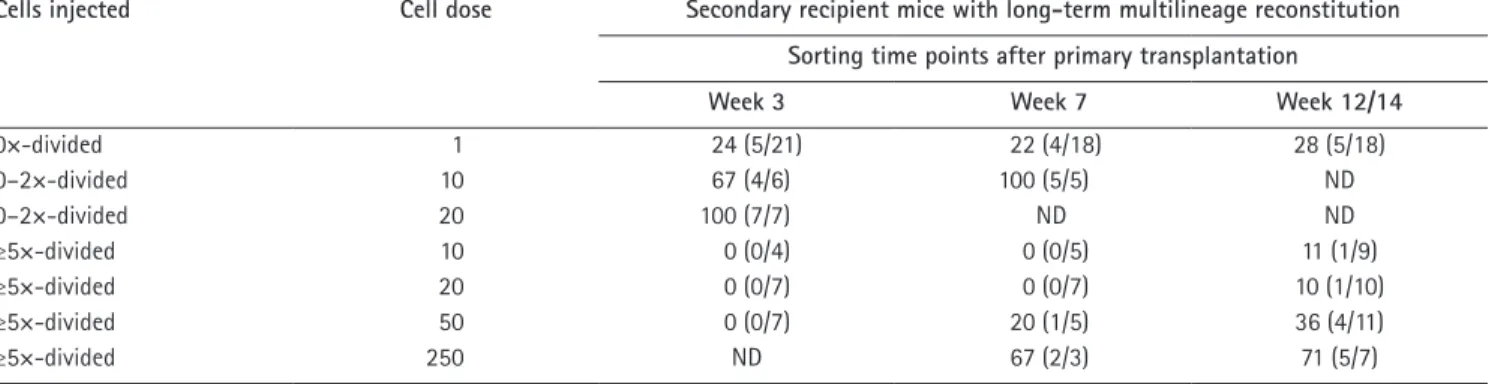
Transplan-tation of single 0×-divided LKS cells, isolated 3–14 wk after
primary transplantation, yielded multilineage reconstitution
in 22–28% of irradiated mice for 16 wk (Fig. 3, C and D;
Table I; and
Fig. S3
). Up to 250 LKS cells that had divided
≥5× in 3 wk in primary recipients showed no engraftment,
whereas 50–250 ≥5×-divided LKS cells at 7 or 12–14 wk
after primary transfer contained long-term multilineage
re-populating HSCs (Fig. 3 E, Table I, and Fig. S3). Based on in
vivo limiting dilution transplantation, the frequency of HSC
in ≥5×-divided LKS cells at 7 and 12–14 wk was 1:293 and
1:153, respectively (Fig. S3 D). BM LKS CD34
cell analysis
revealed maintenance of donor chimerism within this
HSC-enriched cell fraction over 6 mo (
Fig. S4
).
We next tested serial long-term hematopoietic potential
of 0×- and ≥5×-divided LKS cells by transferring whole BM
cells from engrafted secondary recipients into lethally
irradi-ated tertiary recipient mice (Fig. 3 A). Both 0×- and ≥5×-
divided LKS cells were able to reconstitute BM compartments
of irradiated mice for a total of 52–64 wk, i.e., >1 yr, over
se-rial transplantation. Donor chimerism varied depending on
individual mice but not on divisional history of donor cells
from primary transplants (Fig. 3 F). Given that
noncondi-tioned i.v. transfer reflects steady-state physiological HSC
cir-culation and BM rehoming (Wright et al., 2001; Bhattacharya
et al., 2006; Méndez-Ferrer et al., 2008), these findings, in
contrast to previous studies (Wilson et al., 2008; Foudi et al.,
2009), directly demonstrate cycling heterogeneity in
steady-state HSC; some HSCs are quiescent over months and
con-sequently do not contribute to blood production, whereas
others possess high cycling activity and, thus, likely contribute
to blood cell production during this time.
To determine the mean turnover rate of HSC, we
calcu-lated the number of HSC in division classes 0 and ≥5 from the
repopulation assay data (Fig. 4 A and
Table S2
) and fitted a
mathematical model to the number of HSC, assuming that
their division rate is equal to the rate of loss, and, hence, the
total HSC number in this steady-state model is constant over
time (see Materials and methods). We estimate that HSCs
di-vide, on average, every 39 d (95% confidence interval 20–50 d),
leading to a total of 18 divisions during a lifetime of a
mouse. As there was no statistical evidence for heterogeneous
division rates in the functional biologically defined HSC
population, this indicates that HSCs with long-term
reconsti-tution capacity are not necessarily permanently split into
sub-populations with different cycling kinetics (Wilson et al., 2008;
Foudi et al., 2009).
Table I. Transplantation of 0×-, 0–2×-, or ≥5×-divided LKS cell into lethally irradiated mice reveals steady-state cycling
heterogeneity in HSC
Cells injected Cell dose Secondary recipient mice with long-term multilineage reconstitution Sorting time points after primary transplantation
Week 3 Week 7 Week 12/14
0×-divided 1 24 (5/21) 22 (4/18) 28 (5/18) 0–2×-divided 10 67 (4/6) 100 (5/5) ND 0–2×-divided 20 100 (7/7) ND ND ≥5×-divided 10 0 (0/4) 0 (0/5) 11 (1/9) ≥5×-divided 20 0 (0/7) 0 (0/7) 10 (1/10) ≥5×-divided 50 0 (0/7) 20 (1/5) 36 (4/11) ≥5×-divided 250 ND 67 (2/3) 71 (5/7)
The indicated numbers of LKS cells at the indicated time points after primary transplantation were deposited into individual wells of 96-well plates. The contents of each well were injected into lethally irradiated animals along with 2 × 10⁵ total BM cells. After 4 mo, PB of transplanted mice was analyzed on flow cytometry to identify mice that were multilineage reconstituted by donor cells (above background: >0.1% in B220+, CD3+, and B220CD3CD11b+Gr-1+ cells). The numbers in the time point columns represent the percentage of engrafted mice, and the parenthetical numbers represent the number of engrafted mice per number of transplanted mice. ND, not determined.
indicates that some HSC clones or their offspring vary in
contribution to blood production over time. This is consistent
with recent publications indicating reactivation of HSCs from
quiescence over time (Morita et al., 2010).
To address the question of whether divisional frequency is
kept constant or if steady-state fast-dividing LKS cells
natu-rally vary turnover rates, we performed steady-state serial
transplantation with fast-cycling cells. 4,000–6,500 LKS cells
that had divided ≥5× at 14 wk after primary transplantation
were reisolated, labeled again with CFSE, and subsequently
transplanted into secondary nonirradiated animals (Fig. 4 B).
Assuming constant divisional frequency, transferred cells
should divide at least ≥2× within 6 wk. However, some donor
LKS cells remained in the zero- or onefold division,
demon-strating that fast-cycling cells or their progeny can slow down
the divisional rate in steady state (Fig. 4 C).
Increased dormancy of aged LKS CD150
+and expanded
LKS cells
Next, we examined whether steady-state aging or massive
he-matopoietic system expansion after lethal irradiation and BM
Changing divisional frequencies of LKS cells revealed
by steady-state serial transplantation
Virus-mediated HSC marking suggested that hematopoiesis
is maintained by stem cell clones that asynchronously self-
renew and differentiate (Lemischka et al., 1986; McKenzie
et al., 2006). Consistent with those findings, our serial
trans-plantation experiments showed that the donor contribution
to mature blood cells and LKS cells varied and increased in
some tertiary recipients (Fig. 3 F, arrowheads). Secondary and
tertiary recipients contained blood-forming cells derived
from single 0×-divided HSCs and, according to limiting
dilu-tion transplantadilu-tion experiments, single or double ≥5×-divided
HSCs. Thus, the fluctuating hematopoietic contribution
Figure 4. Maintenance of biologically defined HSCs over time and steady-state serial transplantation revealing changing divisional fre-quencies of LKS. (A) Mathematically calculated mean number of 0×- or
≥5×-divided biologically defined HSCs per mouse over time based on en-graftment data described in Materials and methods and Table S2. (B) Experi-mental scheme of steady-state serial transplantation of cycling LKS cells into nonirradiated mice. (C) Representative dot plots of BM from secondary transplants gated on donor (CD45.2+) or host (CD45.1/2+) Lin cells at 6 wk
after secondary transplantation. Dashed lines represent zero division.
Figure 5. Increased dormancy of LKS CD150+ cells associated
with steady-state aging. (A) Experimental scheme of transplantation.
Young mice were transplanted with 7.5–10 × 104 CFSE-labeled LKS cells from
young (8–12 wk old) or aged (64–72 wk old) mice and analyzed after 4 wk. (B) Representative dot plot analysis of lineage-depleted BM gated on donor Lin cells. Dashed lines represent zero division. Number of donor LKS CD150+
cells having undergone indicated numbers of divisions were calculated. Graph shows mean ± SD (n = 3 mice from two to three independent experiments).
subsequently, undergo division at peripheral sites
to give rise to innate immune cells (Nagai et al.,
2006; Massberg et al., 2007). However, there is no
direct evidence that quiescent HSCs in BM increase
division and self-renewal to contribute to blood
cell production upon demand in vivo. We tested
if LPS challenge, as a surrogate for gram-negative
infection which induces massive myeloid cell
pro-duction, would recruit quiescent HSCs into cycle.
Mice that had been previously transplanted with
CFSE-labeled LKS cells were repetitively treated
with LPS and analyzed 8 d after final LPS injection
(Fig. 6 A). Although 0×-divided control T cells
were detectable, 0×-divided LSK cells were absent,
and the number of ≥5×-divided LKS cells was
creased in LPS-treated mice (Fig. 6, B and C),
in-dicating cell loss or recruitment of LKS cells into cell cycle.
To evaluate HSC potential in 2–4×- or ≥5×-divided LKS
cells from PBS- or LPS-treated mice, cells were reisolated
and transplanted into lethally irradiated secondary
recipi-ents (Fig. 6 A). 4 mo after transplantation, donor
chime-rism in peripheral blood (PB) and contribution to different
lineage cells were examined. Consistent with previous
ex-periments (Fig. 3 E), donor cell engraftment was rarely
de-tected in secondary recipients transplanted with 2–4×- and
≥5×-divided LKS cells from PBS-injected control mice.
In marked contrast, both 2–4×- and ≥5×-divided LKS cells
from LPS-injected mice contributed to the generation of
multilineage hematopoiesis in more than half and in some
of the recipients, respectively, after 16 wk (Fig. 6 D).
Line-age distribution analysis in secondary transplanted animals
showed no lineage-biased repopulation, indicating that LPS
challenge does not affect cell fate or differentiation potential
of HSC (unpublished data). Thus, this data provides the first
evidence that a naturally occurring hematoimmunological
challenge, such as gram-negative bacterial infection, induces
transplantation with low HSC numbers, i.e., both states with
overall increased HSC divisional history, affects cell cycle
kinet-ics of HSC-enriched cells. CFSE-labeled LKS cells from aged
and young mice were transplanted into steady-state young mice.
The frequency and number of 0×-dividing or slow-dividing
LKS CD150
+was substantially increased in mice transplanted
with aged cells (Fig. 5, A and B). Similarly, CFSE-labeled LKS
cells from mice that were transplanted 16 wk previously with
low numbers of HSCs showed an increased ratio of slow-
dividing and quiescent to fast-dividing cells (unpublished data).
This data demonstrates that LKS cells, containing HSCs with
an increased divisional history, have a tendency to return to
quiescence. If this reflects a general biological feature of HSCs,
steady-state fast-dividing HSCs will slow down their divisional
rate, once given the opportunity in a permissive environment.
Recruitment of HSC into division upon in vivo
LPS challenge
Immunophenotypically defined HSCs have been shown to
recognize viral or bacterial components through TLRs and,
Figure 6. In vivo LPS challenge recruits HSCs into divi-sion. (A) Experimental scheme of transplantation and LPS
challenge. (B) Representative dot plots gated on donor Lin
cells from BM of primary transplant recipients at day 21 after transfer of CFSE-labeled LKS cells with or without four injec-tions of LPS. Sorting gates for 0×- (red), 2–4×- (green), or ≥5×-divided LKS cells (blue) are shown. Dashed lines represent zero division. (C) Representative dot plots gated on donor CD4+CD62L+ cells from spleen of primary transplant recipients
at day 21 after transfer of CD4+CD62L+ cells with or without
four injections of LPS . Dashed lines represent zero division. (D) PB donor engraftment within myeloid, T, and B cells 4 mo after secondary transplantation with 20 2–4×- or ≥5×-divided LKS cells from PBS- or LPS-treated mice (B). Pooled data from three independent experiments are shown as dots (represent-ing one mouse each) and a bar graph depict(represent-ing mean ± SD. Orange dots show the multilineage reconstituted animals. Black dots show animals with one or zero lineages reconsti-tuted. The dashed line at 0.1% shows background threshold set for engraftment cutoff. ND, not detected.
HSC function (Allsopp et al., 2001). HSC cycling activity is
a result of extrinsic and intrinsic regulation (Orford and
Scadden, 2008). Based on our data, we would like to suggest that
steady-state fast-cycling or enhanced turnover with aging or
irradiation- and transplantation-induced proliferation might
activate an intrinsic HSC program that, based on divisional
history, drives toward quiescence. Thus, an intrinsic cell
mem-ory effect to prevent HSC exhaustion might be
counter-balanced by an extrinsic drive for proliferation. The underlying
mechanisms will need to be determined in the context of
en-vironmental cues such as availability of adhesion molecules
and growths factors in the putative BM HSC niche.
Third, we show that in vivo TLR4 agonist challenge
re-cruits in vivo functional quiescent HSCs into proliferation
and self-renewal with nonbiased lineage repopulation capacity.
Although TLR ligation on HSCs has been shown to induce
cellular division and myeloid lineage-skewed differentiation
ex vivo, there was no direct evidence for enhanced self-
renewal of HSC in BM (Nagai et al., 2006; Massberg et al.,
2007). It is not clear from our experiments if LPS executes its
effect on cell cycle regulation directly via TLR4 expressed on
HSCs, via an indirect pathway, or via a combination of both.
Hematopoietic and nonhematopoietic cell–secreted
interfer-ons have been recently identified by several studies to drive
HSC in cycle upon artificial addition or in chronic infection
(Essers et al., 2009; Sato et al., 2009; Baldridge et al., 2010).
Our study extends these findings and directly demonstrates
that correlates of gram-negative infections, or possibly
self-damage (Rakoff-Nahoum and Medzhitov, 2009), can signal
from the periphery to primary hematopoietic sites in BM and
have an impact on divisional behavior of HSCs. This
mecha-nism likely allows adequate hematopoietic responses and, at
the same time, prevents loss of HSCs by differentiation.
Our mathematical simulation reveals that HSCs with
dif-ferent cycling activity can be contained in one HSC
popula-tion with relatively broad cycling variapopula-tion and that, on
average, HSCs divide 18× during a 2-yr lifespan of a
labora-tory mouse. Two principle models have been posed for the
maintenance of hematopoiesis by stem cells. The clonal
main-tenance model suggests that all HSCs give rise to mature
blood cells continuously throughout life and, thus, all HSCs
should divide similarly to produce cells that contribute to
blood formation (
Fig. S5 A
; Jordan and Lemischka, 1990;
Cheshier et al., 1999; McKenzie et al., 2006; Kiel et al., 2007;
Nygren and Bryder, 2008). The clonal succession model
pro-poses that some HSCs divide frequently, contribute to
hema-topoiesis, and fully differentiate or die subsequently and are
followed by previously quiescent HSCs that then meet the
same fate (Fig. S5 B; Kay, 1965; Drize et al., 1996; Wilson
et al., 2008; Foudi et al., 2009). Based on our data, we suggest
a “dynamic repetition” model, where some HSCs dominate
blood formation for a time, subsequently enter a quiescent
state in which other HSCs increase hematopoietic
contribu-tion, and get reactivated again and contribute to blood
forma-tion in repetitive cycles (Fig. S5 C). Our data do not suggest
how long active and resting phases might last or how many
proliferation and self-renewal of HSCs, a mechanism which
might have evolved to enhance fitness to rapidly amplify
innate immune responses upon demand.
DISCUSSION
Using a newly established HSC tracking method that utilizes
in vivo CFSE dilution, we communicate three major findings
on HSC turnover and contribution to blood formation in
steady state and upon inflammation. The first finding is that in
steady state, HSCs with equivalent life-long multilineage
re-population potential are contained in both frequently cycling
cell populations that divide ≥5× in 7 wk, i.e., about every
1.4 wk, and in quiescent cells that do not divide over 14 wk.
The finding is not consistent with the previous observations that
only quiescent cells possess serial reconstitution capacity and
fast-diving cells have limited self-renewal (Wilson et al., 2008;
Foudi et al., 2009). This contradiction might arise from
techni-cal issues, as numbers of cells transferred into secondary
trans-plants, and from sensitivity and resolution of divisional tracking
methods. Another possibility would be that the dividing HSCs
are not included in the population with LKS CD48
CD150
+phenotype as subsets of HSC might not express CD150
(Weksberg et al., 2008). Although it was assumed that both
BrdU incorporation and H2B-GFP transgenic animal models
allow us to follow seven cellular divisions, our comparative
analysis demonstrates that staining intensity for BrdU detection
reaches a limit at two to three divisions and that BrdU staining
is not linear, suggesting a lower divisional resolution of BrdU
retention than expected, whereas, in contrast, CFSE dilution
can distinguish at least five divisions with high resolution.
Fur-thermore, the fact that BrdU has mitogenic activity, which has
been shown in this paper and previously (Kiel et al., 2007;
Wil-son et al., 2008), has a substantial impact on the experimental
readout because BrdU labeling changes cell cycle state as well
as, potentially, consecutive function of cells. Also, most
quies-cent 0×-dividing HSCs are ignored in the BrdU assay, as our
data shows remaining CFSE-high cells that do not incorporate
BrdU. Thus, with some HSCs being deeply quiescent and
inactive in DNA replication and protein synthesis, uniform
labeling of all HSC by DNA labeling or marker protein
ex-pression might not be achieved at the starting point of chase.
This contrasts with the CFSE labeling established in this paper
that ensures highly uniform labeling and high-resolution
divi-sional tracking of cells without impairing HSC function,
inde-pendent of cell cycle activity during the labeling process.
The second finding is that steady-state fast-cycling
popu-lations can slow down over time in steady-state serial
trans-plantation and that LKS CD150
+cells containing HSCs with
extensive proliferative history—i.e., HSCs that have gone
through extended proliferation in aging or after in vivo
chal-lenge by transplantation—are prone to return to quiescence.
As demonstrated in this paper, divisional activity is not
associ-ated with HSC function in young adult mice. Furthermore,
HSCs have the capacity to engraft and constitute long-term
hematopoiesis over several serial transplantations, indicating
that high divisional history does not lead to immediate loss of
follows: APC-Cy7–conjugated c-Kit, PE-Cy7-conjugated anti–Sca-1, Pa-cific blue–conjugated anti-CD45.1 (A20), APC-conjugated anti-CD45.2 (104), PE-conjugated anti-CD150 (TC15-12F12.2; BioLegend), PE- conjugated anti-CD34 (Raw34), PE-conjugated anti-CD16/32 (2.4G2), PE-conjugated IL-7 (A7R34), PE-conjugated anti-Flt3 (A2F10.1), bioti-nylated anti–c-Mpl (AMM2 donated by Kyowa Hakko Kirin Co., Ltd.), PE-conjugated anti–M-CSFR (AFS98), or PE-Cy5–PE-conjugated antilineage antibody. The biotinylated antibody was detected with PE-conjugated strep-tavidin. Each single division was determined as follows: a gate for zero divi-sion was set on the CFSE peak of the undivided naive T cell control, and subsequent divisions were determined according to reduced cence intensity of peaks in respective histograms. The background fluores-cence was determined from nontransplanted BM sample. For evaluation of peripheral engraftment, thymus, spleen, lymph nodes, and PB were harvested and stained with FITC-conjugated anti–Gr-1, PE-conjugated anti-CD11b, PE-Cy5–conjugated CD3, APC-Cy7–conjugated B220, PE-Cy7–conjugated CD45.1, and APC-conjugated CD45.2. Before analysis, cells were resus-pended in PBS containing 2 µg/ml Hoechst 33342 (Invitrogen). The per-centage of donor contribution was assessed by measuring CD45.1+ or CD45.2+
cells in B220+ B-lineage, CD3+ T-lineage, or B220CD3CD11b+Gr-1+
myeloid lineage cells. Cutoff for donor engraftment was determined based on the percentage of nonspecific stain in nontransplanted secondary trans-planted recipient. All antibodies were purchased from eBioscience except when otherwise specified.
BrdU retention assay with CFSE labeling. 1 wk after transfer of
CFSE-labeled LKS cells into nonirradiated mice, animals were i.p. injected with a single dose of 180 µg BrdU (Sigma-Aldrich) and were fed water containing 800 µg/ml BrdU and 5% glucose for the next 14 d. Mice were then sacrificed and BrdU staining was performed using a BrdU labeling kit (BD). Cells from PBS-treated animals were used as a negative control for BrdU staining.
Single cell and whole BM transplantation into lethally irradiated mice. 3–14 wk after primary transplantation with CFSE-labeled cells, Lin
cells were immunomagnetically enriched from long bones of mice, as de-scribed in Flow cytometric analysis and stained with antibodies to CD45.1, CD45.2, c-Kit, and Sca-1. 1–250 donor-derived LKS cells (CD45.2+) were
sorted into individual wells of 96-well plates using a FACSAria. Single cell deposition was confirmed microscopically. 2 × 10⁵ total BM cells from
CD45.1+ or CD45.2+ mice were suspended in Mg2+/Ca2+-free Hank’s
buff-ered salt solution supplemented with 2% FBS and plated into each well. The content of each well was i.v. injected into mice that were lethally irradiated with 2 × 6.5 Gy in a 4-h interval. Mice were bled monthly, blood was sub-jected to red blood cell lysis, and donor engraftment was analyzed as described in Flow cytometric analysis. Recipients with >0.1% donor chi-merism in B-lineage (B220+), T-lineage (CD3+), and myeloid-lineage
(B220CD3CD11b+Gr-1+) population was considered to be multilineage
repopulated. The frequency of HSC in LKS cells at the indicated time points after primary transfer was determined according to Poisson statistics (Smith et al., 1991) or L-Calc (STEMCELL Technologies Inc.). For the tertiary transplantation, one to three million cells of total BM cells harvested from secondary transplants were injected into lethally irradiated mice (CD45.1+
or CD45.2+).
Statistical analysis. The significance of differences was determined by an
unpaired Student’s t test.
Mathematical modeling and analysis of LKS cell division kinetics.
The simplest model that can be used to describe the division kinetics of CFSE-labeled cells is given by the following differential equations (De Boer et al., 2006):
dX dt d X dX dt X d X i dX dt X i i i 0 0 1 5 2 1 4 2 / ( ) / ( ) , ,..., / ( = − + = − + = = − + λ λ λ λ 44+X5+)−dX5+
(1)
HSC clones at any given time contribute to hematopoiesis.
However, the model of steady-state reversible change between
proliferation and quiescence in HSCs over time is consistent
with virtual single cell–based simulation models (Glauche
et al., 2009). Furthermore, the dynamically changing cycling
activity likely results in a similar turnover of the entire HSC
pool, indicating a homogeneous divisional history for all
HSCs at the end of life, a suggestion which would be
coher-ent with linear telomere shortening observed in the human
aging HSC pool (Rufer et al., 1999). The findings reported in
this paper might represent a biological principle that could
hold true for other somatic stem cell–sustained organ systems
and might have developed during evolution to ensure equal
distribution of work load, efficient recruitment of stem cells
during demand, and reduction of risk to acquire genetic
al-terations by alternating fractions of stem cells in quiescence at
any given time.
MATERIALS AND METHODS
Mice. C57BL/Ka-Thy1.1 (CD45.1+ or CD45.2+) mice were bred and
maintained at the Institute for Research in Biomedicine animal facility. CD45.1/2+ F1 mice were generated by crossbreeding. 8–12-wk-old or 64–
72-wk-old mice were used in the studies. Mice were treated in accordance with the guidelines of the Swiss Federal Veterinary Office, and experiments were approved by the Dipartimento della Sanità e Socialità and Gesundheits-direktion Kanton Zürich, Veterinäramt.
Cell isolation and sorting. Total BM cells were harvested from long bones,
red blood cells were lysed with ACK lysis buffer (150 mM NH4Cl, 10 mM
KHCO3, and 0.1 mM EDTA), and debris was removed with 70-µm cell
strainers (BD). Cells were stained with PE-Cy5–conjugated antibodies against the lineage antigens B220 (RA3-6B2), CD3 (145-2C11), Ter119 (Ter119), and Gr-1 (RB6-8C5) and immunomagnetically enriched for lineage-negative cells using anti-Cy5/anti–Alexa Fluor 647 Microbeads (Miltenyi Biotec). The lineage-depleted cells were subsequently stained with allophy-cocyanin (APC)-Cy7–conjugated antibody to c-Kit (2B8) and FITC- conjugated antibody to Sca-1 (D7), and LKS or Linc-Kit+Sca-1 (LK) cells
were sorted using a FACSAria (BD). Naive CD4+CD62L+ T cells were
enriched from spleen cells with PE-Cy5–conjugated anti-CD4 antibody (GK1.5) and anti-Cy5/anti–Alexa Fluor 647 Microbeads, and were then stained with PE-conjugated anti-CD62L antibody (MEL-14) followed by sorting of CD4+CD62L+ cells on a FACSAria. All antibodies were obtained
from eBioscience.
CFSE staining and cell transplantation into nonirradiated or suble-thally irradiated mice. Sorted cells were labeled for 7 min at 37°C with
2 µM CFSE (Invitrogen) in Dulbecco’s PBS (D-PBS; Invitrogen) supple-mented with 2% FBS (Invitrogen). The same volume of ice-cold D-PBS with 10% FBS was then added to stop the reaction. After wash with Mg2+/Ca2+
-free PBS, 105 CFSE-labeled LKS cells (CD45.2+) or 2 × 10⁶ CFSE-labeled
CD4+CD62L+ naive T cells (CD45.2+) were i.v. transplanted into
nonirradi-ated recipient F1 (CD45.1/2+) mice. In some cases, mice were sublethally
irradiated with 6.5 Gy from a Cesium 137 source (BIOBEAM 8000; STS GmbH) at 3.75 Gy/min before transplantation.
In vivo LPS challenge. 105 CFSE-labeled LKS cells were transplanted into
nonirradiated animals. 1 wk after transplantation, mice were i.p. injected with PBS or 35 µg LPS from Escherichia coli (Ultrapure; InvivoGen) 4×, each with a 2 d-interval, and were analyzed 6 d after the final injection.
Flow cytometric analysis. Lineage-negative cells from BM were enriched
N t( )=N( )0
(
f e1−d t1 + −(1 f e1)−d t2)
.
(5)
We fitted Eqs. 4 and 5 to the normalized cell counts by minimizing the squared difference between log-transformed normalized cell counts and the predictions of Eqs. 4 and 5. We found that the two-subpopulation model fits significantly better than the one-subpopulation model (F-test,df1= ,28
df2= ,26 P = 2.2 × 10⁴). Thus, there is a strong statistical signal that the LKS
cell population is heterogeneous with respect to its differentiation rate. The best estimates for the parameters of Eq. 5 are:
df wk d wk 1 1 2 0 70 0 06 1 82 0 90 0 127 0 022 = ± = ± = ± . . ( . . ) / ( . . ) /
.
(6)
The death rates correspond to a mean life-span of 3.8 and 55 d, respec-tively. (Fitting Eq. 4, we obtain d = (0.254 ± 0.020)/wk.)
In the next step, we fitted the full two- and three-subpopulation model and estimated the remaining parameters of these models. The fitting routine involved minimizing the squared difference between log-transformed LKS cell counts and the predictions of the two- or three-subpopulation models. The last division class, five and greater, was omitted in the fitting procedure because we found, on the basis of simulated data, that omitting the last divi-sion class resulted in less biased parameter estimates. We found that there is evidence for at least three subpopulations in the data. A three-subpopulation model, assuming Poisson division and loss of LKS cells, fits significantly better than a model assuming two subpopulations (F-test,df1=153, df2=150,P =
2.4 × 10¹⁴). Estimates of the parameters that characterize the three
subpop-ulations are listed in Table S1. Hereby,f1, f2,andf3 are the initial fractions
of subpopulation one, two, and three, respectively. λiis the division rate, and
diis the loss rate of the ith subpopulation (as a result of differentiation, loss of
marker, or death). Thus, we have evidence for a subpopulation that is lost at the high rate ofd1= . /1 8 wkand does not divide. Subpopulations two and three initially constitute 22 and 7.7% of the LKS population and divide once every 12 and 97 d, respectively. Subpopulations two and three correspond to the slowly and fast cycling subpopulations that were identified previously (Wilson et al., 2008; Foudi et al., 2009; van der Wath et al., 2009).
Mathematical modeling and analysis of division kinetics of biologi-cally functional HSC. To estimate the turnover rate of biologibiologi-cally
func-tional HSC from the repopulation data, we first estimated the fraction of biologically functional HSC in the LKS cell population in division class zero and five or higher by a maximum likelihood procedure. If the fraction of biologically functional HSC isfHSC,and we transfer i LKS cells to m mice,
the probability to observe repopulation of the hematopoietic system in r mice is:
m m r fHSC f i m r HSC i r −
(
−)
(
− −)
− 1 ( ) 1 (1 ).
(7)
If we conduct E such repopulation experiments, the best estimate for the fraction of biologically functional HSC in the LKS population maximizes the following likelihood:
L f m m r f f HSC k E k k k HSC i m r HSC i r k k k k ( )= ( ) ( ) −
(
−)
(
− −)
= −∏
1 1 1 1 kk. (8)
In this expression, the variablesmkorrkdenote the number of mice used
or repopulated in experiment k, respectively, andikis the number of LKS cells
transferred in experiment k.
We used the repopulation data to estimate the fraction of biologically functional HSC in division classes zero and five or higher at 3, 7, 12, and 14 wk after primary transfer of the LKS cell population. Combining these esti-mates with the number of LKS cells in each division class, we obtain an estimate Here,Xidenotes the number of LKS cells that gave undergone i divisions,
andX5+denotes the number of LKS cells that have divided five or more times.
The parameter is the rate constant for cell division, and d is the rate con-stant for LKS cell loss. Several processes contribute to this loss of LKS cells. These are differentiation, which leads to a loss of LKS marker, cell death, or loss of LKS marker not related to differentiation. For simplicity, we refer to d as the differentiation rate constant. Because the experiment involved the trans-fer of 5,000 CFSE-labeled LKS cells into the mice, we assume that at time t = 0, all cells are in the division class 0, corresponding to the highest CFSE label, and their number isX0( )0 =5 000, . (In mathematical immunology, the division
of cells is often described by the Smith-Martin model rather than this simple model above [De Boer et al., 2006]. The Smith-Martin model describes the cell cycle in more detail introducing a parameter for the time a cell re-quires for dividing once it committed to division. However, because the di-vision kinetics of LKS cells is very slow, occurring on the time scale of weeks rather than hours, the time required for cell division can be ignored.)
We constructed extensions of this basic model to study the hetero-geneity of the division kinetics of the LKS populations. In particular, we developed versions of the basic model in which we assume two or three subpopulations, each with their own division and differentiation rates. These mathematical models are given by the following set of differ-ential equations:
dXdX dtdt X d Xd X i s s i s i s i s 0 0 1 2 1 ( ) ( ) ( ) ( ) ( ) / ( ) / ( ) , ,.. = − + = − − + = λ λ λ .., / ( ) ( ) ( ) ( ) ( ) 4 2 5 4 5 5 dXs dt Xs Xs dXs + = λ + + − +
(2)
Hereby, the parameter s denotes the subpopulation and is an integer ranging from 1 to the number of subpopulations considered in the model. We assume that at time t = 0, all cells are undivided and their number is
Xs
s 0 0 5000
( )( ) .
∑
= It is useful to define the initial fractionfsof undivided cellsin the sth subpopulation by Xs f X s s s 0 0 0 0 ( ) ( ) ( )=
∑
( ). Obviously,∑
sfs= 1.Unlike the models used in Wilson et al. (2008) and van der Wath et al. (2009), this model does not assume that fast-cycling cells arise from dormant cells by differentiation. Rather, we assume that each subpopulation is independently dividing and differentiating.
The most straightforward way to analyze the LKS CFSE cell data would be to successively fit the one-, two-, and three-subpopulation versions of the mathematical model and to assess if increasing the number of subpopulations increases the goodness of fit (as measured by the residual sum of squares) sig-nificantly (as determined by an F-test). However, a straightforward fit of a model with more than one subpopulation, in which the parameters of the model are unconstrained, does not result in consistent goodness of fit and consistent parameter estimates. We have therefore adopted a two-step proce-dure to estimate the parameters of the mathematical models. First, we esti-mate the differentiation rates d of the first two subpopulations from the normalized cell counts (defined in Eq. 3). This leads to a constraint for the differentiation rates. Second, we estimate the division rates and the differenti-ation rates of the remaining subpopuldifferenti-ations from fitting the model to the LKS cell count in the different division classes.
Normalized cell counts are a way to eliminate the division kinetics from CFSE data (De Boer et al., 2006). The normalized cell count is defined as:
N t X ti i i ( )= ( ) / =
∑
2 0 4.
(3)
Assuming a single, homogeneous subpopulation, N(t) is an exponentially decaying function which is independent of the division rate :
N t( )=N( )0 e−dt
.
(4)
Thus, in a plot of ln(N(t)) versus the time, t, the slope is d. Assuming two subpopulations, N(t) is a bimodally decaying function that is indepen-dent of the division ratesλ1andλ2:
REFERENCES
Akashi, K., D. Traver, T. Miyamoto, and I.L. Weissman. 2000. A clonogenic common myeloid progenitor that gives rise to all myeloid lineages.
Nature. 404:193–197. doi:10.1038/35004599
Allsopp, R.C., S. Cheshier, and I.L. Weissman. 2001. Telomere shortening accompanies increased cell cycle activity during serial transplantation of hematopoietic stem cells. J. Exp. Med. 193:917–924. doi:10.1084/ jem.193.8.917
Allsopp, R.C., G.B. Morin, R. DePinho, C.B. Harley, and I.L. Weissman. 2003. Telomerase is required to slow telomere shortening and extend replicative lifespan of HSCs during serial transplantation. Blood. 102: 517–520. doi:10.1182/blood-2002-07-2334
Baldridge, M.T., K.Y. King, N.C. Boles, D.C. Weksberg, and M.A. Goodell. 2010. Quiescent haematopoietic stem cells are activated by IFN-gamma in response to chronic infection. Nature. 465:793–797. doi:10.1038/ nature09135
Bhattacharya, D., D.J. Rossi, D. Bryder, and I.L. Weissman. 2006. Purified hematopoietic stem cell engraftment of rare niches corrects severe lym-phoid deficiencies without host conditioning. J. Exp. Med. 203:73–85. doi:10.1084/jem.20051714
Bhattacharya, D., A. Czechowicz, A.G. Ooi, D.J. Rossi, D. Bryder, and I.L. Weissman. 2009. Niche recycling through division-independent egress of hematopoietic stem cells. J. Exp. Med. 206:2837–2850. doi:10.1084/jem .20090778
Cheshier, S.H., S.J. Morrison, X. Liao, and I.L. Weissman. 1999. In vivo pro-liferation and cell cycle kinetics of long-term self-renewing hematopoi-etic stem cells. Proc. Natl. Acad. Sci. USA. 96:3120–3125. doi:10.1073/ pnas.96.6.3120
Christensen, J.L., and I.L. Weissman. 2001. Flk-2 is a marker in hema-topoietic stem cell differentiation: a simple method to isolate long-term stem cells. Proc. Natl. Acad. Sci. USA. 98:14541–14546. doi:10 .1073/pnas.261562798
De Boer, R.J., V.V. Ganusov, D. Milutinoviç, P.D. Hodgkin, and A.S. Perelson. 2006. Estimating lymphocyte division and death rates from CFSE data.
Bull. Math. Biol. 68:1011–1031. doi:10.1007/s11538-006-9094-8
Drize, N.J., J.R. Keller, and J.L. Chertkov. 1996. Local clonal analysis of the hematopoietic system shows that multiple small short-living clones maintain life-long hematopoiesis in reconstituted mice. Blood. 88:2927– 2938.
Essers, M.A., S. Offner, W.E. Blanco-Bose, Z. Waibler, U. Kalinke, M.A. Duchosal, and A. Trumpp. 2009. IFNalpha activates dormant hae-matopoietic stem cells in vivo. Nature. 458:904–908. doi:10.1038/ nature07815
Foudi, A., K. Hochedlinger, D. Van Buren, J.W. Schindler, R. Jaenisch, V. Carey, and H. Hock. 2009. Analysis of histone 2B-GFP retention re-veals slowly cycling hematopoietic stem cells. Nat. Biotechnol. 27:84–90. doi:10.1038/nbt.1517
Glauche, I., K. Moore, L. Thielecke, K. Horn, M. Loeffler, and I. Roeder. 2009. Stem cell proliferation and quiescence—two sides of the same coin. PLOS Comput. Biol. 5:e1000447. doi:10.1371/journal .pcbi.1000447
Gordon, M.Y., J.L. Lewis, and S.B. Marley. 2002. Of mice and men...and elephants. Blood. 100:4679–4680. doi:10.1182/blood-2002-08-2517 Harrison, D.E., and C.M. Astle. 1982. Loss of stem cell repopulating ability
upon transplantation. Effects of donor age, cell number, and transplantation procedure. J. Exp. Med. 156:1767–1779. doi:10.1084/jem.156.6.1767 Jordan, C.T., and I.R. Lemischka. 1990. Clonal and systemic analysis of
long-term hematopoiesis in the mouse. Genes Dev. 4:220–232. doi:10 .1101/gad.4.2.220
Karsunky, H., M. Merad, A. Cozzio, I.L. Weissman, and M.G. Manz. 2003. Flt3 ligand regulates dendritic cell development from Flt3+ lymphoid
and myeloid-committed progenitors to Flt3+ dendritic cells in vivo. J. Exp. Med. 198:305–313. doi:10.1084/jem.20030323
Kay, H.E. 1965. How many cell-generations? Lancet. 286:418–419. doi:10.1016/S0140-6736(65)90763-4
Kiel, M.J., O.H. Yilmaz, T. Iwashita, O.H. Yilmaz, C. Terhorst, and S.J. Morrison. 2005. SLAM family receptors distinguish hematopoietic stem and progenitor cells and reveal endothelial niches for stem cells. Cell. 121:1109–1121. doi:10.1016/j.cell.2005.05.026
for the number of biologically functional HSC in the division classes zero and five or higher. Table S2 shows these estimates.
We then used the homogeneous cell division model (Eq. 1) to estimate the turnover rate of biologically functional HSC. We assumed that the num-ber of biologically functional HSC stays constant over the 14 wk. This con-stant number of biologically functional HSCs can be interpreted as the number of stem cell niches that are occupied after the transfer of CFSE- labeled cells. Assuming a constant number of biologically functional HSCs is mathematically equivalent to setting the division rate equal to the rate of dif-ferentiation or loss of biologically functional HSC.
We estimated a division rate of 0.18/wk, which corresponds to one divi-sion every 39 d. The 95% confidence interval of this estimate is 0.14–0.35/wk, which corresponds to a range of one division every 20–50 d. This is strong evidence that biologically functional HSCs do not divide only every 150 d, as has been suggested by other studies (Wilson et al., 2008; Wilson et al., 2009; Trumpp et al., 2010). The constant number of biologically func-tional HSCs in the system (i.e., the number of occupied stem cell niches) is estimated as 388 cells (95% confidence interval: 193–559 cells).
We investigated whether relaxing some of the model assumptions alters the estimate of biologically functional HSC dramatically but found that the estimate of the turnover rate is robust. If we relax the assumption that the di-vision rate equals the rate of differentiation and loss, we obtain a didi-vision rate of 0.26/wk, which lies within the 95% confidence interval of the estimate assuming equal division and differentiation rates. This means that the two es-timates are not significantly different. If we set the number of niches to 200 rather than estimating this quantity from the data, we obtain a division rate of 0.24/wk, which is, again, not significantly different from the estimate based on flexible number of niches. Lastly, a two-population model does not significantly improve the fit to the data on biologically functional HSC (Table S2): F-test,df1= , df29 2= ,27 P = 0.15. Thus, there is no evidence for
a heterogeneously dividing population of biologically functional HSC.
Implementation. All the mathematical models and the analysis described in
the previous two sections were implemented in the R language of statistical computing (R Development Core Team, 2008).
Online supplemental material. Fig. S1 shows homogenous CFSE
labeling and CFSE label–retaining cell populations upon nonconditioned transplantation of LKS but not LK. Fig. S2 shows 0×-divided cells that are maintained in BM, but not spleen, and included in LKS CD34CD150+
population. Fig. S3 shows donor contribution to lymphoid lineage in secondary transplantation with 0×- or ≥5×-divided LKS cells, and HSC frequency determined by limiting dilution transplantation. Fig. S4 shows donor chimerism in HSC-containing population in BM of secondary recipient reconstituted with 0–2×- or ≥5×-divided LKS cells. Fig. S5 shows hypothetical models for steady-state hematopoiesis. Table S1 shows es-timates of the parameters of the three-subpopulation model on LKS turnover. Table S2 shows estimate of biologically functional HSC. Online supplemen-tal material is available at http://www.jem.org/cgi/content/full/jem .20101643/DC1.
The authors thank D. Jarrossay for FACS sorting, and D. Bossi and C. Borsotti for assistance with some experiments.
This work was supported in part by a Postdoctoral Fellowship of the Japanese Society for the Promotion of Science for Research Abroad to H. Takizawa, the Swiss National Science Foundation (310000-116637), the Oncosuisse (OCS-02019-02-2007), and the Promedica Foundation to M.G. Manz.
The authors declare no competing interest.
Author contributions: H. Takizawa designed research, performed the experiments, and wrote the manuscript; C.S. Boddupalli performed experiments; R.R. Regoes and S. Bonhoeffer generated mathematical models; and M.G. Manz directed the study and wrote the manuscript.
Submitted: 9 August 2010 Accepted: 11 January 2011
Kiel, M.J., S. He, R. Ashkenazi, S.N. Gentry, M. Teta, J.A. Kushner, T.L. Jackson, and S.J. Morrison. 2007. Haematopoietic stem cells do not asymmetrically segregate chromosomes or retain BrdU. Nature. 449:238–242. doi:10 .1038/nature06115
Kondo, M., I.L. Weissman, and K. Akashi. 1997. Identification of clonogenic common lymphoid progenitors in mouse bone marrow. Cell. 91:661– 672. doi:10.1016/S0092-8674(00)80453-5
Kondo, M., A.J. Wagers, M.G. Manz, S.S. Prohaska, D.C. Scherer, G.F. Beilhack, J.A. Shizuru, and I.L. Weissman. 2003. Biology of hematopoietic stem cells and progenitors: implications for clinical application. Annu. Rev. Immunol. 21:759–806. doi:10.1146/annurev.immunol.21.120601.141007 Lemischka, I.R., D.H. Raulet, and R.C. Mulligan. 1986. Developmental
po-tential and dynamic behavior of hematopoietic stem cells. Cell. 45:917– 927. doi:10.1016/0092-8674(86)90566-0
Lyons, A.B., and C.R. Parish. 1994. Determination of lymphocyte division by flow cytometry. J. Immunol. Methods. 171:131–137. doi:10.1016/ 0022-1759(94)90236-4
Massberg, S., P. Schaerli, I. Knezevic-Maramica, M. Köllnberger, N. Tubo, E.A. Moseman, I.V. Huff, T. Junt, A.J. Wagers, I.B. Mazo, and U.H. von Andrian. 2007. Immunosurveillance by hematopoietic progenitor cells trafficking through blood, lymph, and peripheral tissues. Cell. 131:994– 1008. doi:10.1016/j.cell.2007.09.047
McKenzie, J.L., O.I. Gan, M. Doedens, J.C. Wang, and J.E. Dick. 2006. Individual stem cells with highly variable proliferation and self-renewal properties comprise the human hematopoietic stem cell compartment.
Nat. Immunol. 7:1225–1233. doi:10.1038/ni1393
Méndez-Ferrer, S., D. Lucas, M. Battista, and P.S. Frenette. 2008. Haemato-poietic stem cell release is regulated by circadian oscillations. Nature. 452: 442–447. doi:10.1038/nature06685
Morita, Y., H. Ema, and H. Nakauchi. 2010. Heterogeneity and hierarchy within the most primitive hematopoietic stem cell compartment. J. Exp.
Med. 207:1173–1182. doi:10.1084/jem.20091318
Nagai, Y., K.P. Garrett, S. Ohta, U. Bahrun, T. Kouro, S. Akira, K. Takatsu, and P.W. Kincade. 2006. Toll-like receptors on hematopoietic progenitor cells stimulate innate immune system replenishment. Immunity. 24:801– 812. doi:10.1016/j.immuni.2006.04.008
Nygren, J.M., and D. Bryder. 2008. A novel assay to trace proliferation his-tory in vivo reveals that enhanced divisional kinetics accompany loss of hematopoietic stem cell self-renewal. PLoS One. 3:e3710. doi:10.1371/ journal.pone.0003710
Onai, N., A. Obata-Onai, M.A. Schmid, T. Ohteki, D. Jarrossay, and M.G. Manz. 2007. Identification of clonogenic common Flt3+M-CSFR+ plasmacytoid and conventional dendritic cell progenitors in mouse bone marrow. Nat. Immunol. 8:1207–1216. doi:10.1038/ni1518
Orford, K.W., and D.T. Scadden. 2008. Deconstructing stem cell self-renewal: genetic insights into cell-cycle regulation. Nat. Rev. Genet. 9:115–128. doi:10.1038/nrg2269
Osawa, M., K. Hanada, H. Hamada, and H. Nakauchi. 1996a. Long-term lymphohematopoietic reconstitution by a single CD34-low/negative hematopoietic stem cell. Science. 273:242–245. doi:10.1126/science .273.5272.242
Osawa, M., K. Nakamura, N. Nishi, N. Takahasi, Y. Tokuomoto, H. Inoue, and H. Nakauchi. 1996b. In vivo self-renewal of c-Kit+ Sca-1+ Lin(low/-) hemopoietic stem cells. J. Immunol. 156:3207–3214.
Qian, H., N. Buza-Vidas, C.D. Hyland, C.T. Jensen, J. Antonchuk, R. Månsson, L.A. Thoren, M. Ekblom, W.S. Alexander, and S.E. Jacobsen. 2007. Critical role of thrombopoietin in maintaining adult quiescent hematopoietic stem cells. Cell Stem Cell. 1:671–684. doi:10.1016/j.stem .2007.10.008
R Development Core Team. 2008. R: A language and environment for sta-tistical computing. In R Foundation for Stasta-tistical Computing, Vienna, Austria. www.r-project.org.
Rakoff-Nahoum, S., and R. Medzhitov. 2009. Toll-like receptors and cancer.
Nat. Rev. Cancer. 9:57–63. doi:10.1038/nrc2541
Rufer, N., T.H. Brümmendorf, S. Kolvraa, C. Bischoff, K. Christensen, L. Wadsworth, M. Schulzer, and P.M. Lansdorp. 1999. Telomere fluores-cence measurements in granulocytes and T lymphocyte subsets point to a high turnover of hematopoietic stem cells and memory T cells in early childhood. J. Exp. Med. 190:157–167. doi:10.1084/jem.190.2.157 Sato, T., N. Onai, H. Yoshihara, F. Arai, T. Suda, and T. Ohteki. 2009. Interferon
regulatory factor-2 protects quiescent hematopoietic stem cells from type I interferon-dependent exhaustion. Nat. Med. 15:696–700. doi:10 .1038/nm.1973
Smith, L.G., I.L. Weissman, and S. Heimfeld. 1991. Clonal analysis of he-matopoietic stem-cell differentiation in vivo. Proc. Natl. Acad. Sci. USA. 88:2788–2792. doi:10.1073/pnas.88.7.2788
Spangrude, G.J., S. Heimfeld, and I.L. Weissman. 1988. Purification and characterization of mouse hematopoietic stem cells. Science. 241:58–62. doi:10.1126/science.2898810
Trumpp, A., M. Essers, and A. Wilson. 2010. Awakening dormant haemato-poietic stem cells. Nat. Rev. Immunol. 10:201–209. doi:10.1038/nri2726 van der Wath, R.C., A. Wilson, E. Laurenti, A. Trumpp, and P. Liò. 2009.
Estimating dormant and active hematopoietic stem cell kinetics through extensive modeling of bromodeoxyuridine label-retaining cell dynamics.
PLoS One. 4:e6972. doi:10.1371/journal.pone.0006972
Weksberg, D.C., S.M. Chambers, N.C. Boles, and M.A. Goodell. 2008. CD150 side population cells represent a functionally distinct popula-tion of long-term hematopoietic stem cells. Blood. 111:2444–2451. doi:10.1182/blood-2007-09-115006
Weston, S.A., and C.R. Parish. 1990. New fluorescent dyes for lymphocyte mi-gration studies. Analysis by flow cytometry and fluorescence microscopy.
J. Immunol. Methods. 133:87–97. doi:10.1016/0022-1759(90)90322-M
Wilson, A., E. Laurenti, G. Oser, R.C. van der Wath, W. Blanco-Bose, M. Jaworski, S. Offner, C.F. Dunant, L. Eshkind, E. Bockamp, et al. 2008. Hematopoietic stem cells reversibly switch from dormancy to self- renewal during homeostasis and repair. Cell. 135:1118–1129. doi:10 .1016/j.cell.2008.10.048
Wilson, A., E. Laurenti, and A. Trumpp. 2009. Balancing dormant and self-renewing hematopoietic stem cells. Curr. Opin. Genet. Dev. 19:461–468. doi:10.1016/j.gde.2009.08.005
Wright, D.E., A.J. Wagers, A.P. Gulati, F.L. Johnson, and I.L. Weissman. 2001. Physiological migration of hematopoietic stem and progenitor cells.
Science. 294:1933–1936. doi:10.1126/science.1064081
Yoshihara, H., F. Arai, K. Hosokawa, T. Hagiwara, K. Takubo, Y. Nakamura, Y. Gomei, H. Iwasaki, S. Matsuoka, K. Miyamoto, et al. 2007. Thrombopoietin/MPL signaling regulates hematopoietic stem cell quiescence and interaction with the osteoblastic niche. Cell Stem Cell. 1:685–697. doi:10.1016/j.stem.2007.10.020