HAL Id: hal-02025486
https://hal.archives-ouvertes.fr/hal-02025486
Submitted on 18 Jun 2021
HAL is a multi-disciplinary open access
archive for the deposit and dissemination of
sci-entific research documents, whether they are
pub-lished or not. The documents may come from
teaching and research institutions in France or
abroad, or from public or private research centers.
L’archive ouverte pluridisciplinaire HAL, est
destinée au dépôt et à la diffusion de documents
scientifiques de niveau recherche, publiés ou non,
émanant des établissements d’enseignement et de
recherche français ou étrangers, des laboratoires
publics ou privés.
Epithelium Culture
Myriam Jory, Karim Bellouma, Christophe Blanc, Laura Casanellas Vilageliu,
Aurelie Petit, Paul Reynaud, Charlotte Vernisse, Isabelle Vachier, Arnaud
Bourdin, Gladys Massiera
To cite this version:
Myriam Jory, Karim Bellouma, Christophe Blanc, Laura Casanellas Vilageliu, Aurelie Petit, et al..
Mucus Microrheology Measured on Human Bronchial Epithelium Culture. Frontiers in Physics,
Fron-tiers, 2019, 7, pp.19. �10.3389/fphy.2019.00019�. �hal-02025486�
Edited by: Umberto D’Ortona, UMR7340 Laboratoire de Mécanique, Modélisation et Procédés Propres (M2P2), France Reviewed by: Felix Campelo, Instituto de Ciencias Fotónicas, Spain Juan Guillermo Diaz Ochoa, PERMEDIQ GmbH, Germany *Correspondence: Gladys Massiera [email protected] Specialty section: This article was submitted to Biophysics, a section of the journal Frontiers in Physics Received: 30 October 2018 Accepted: 30 January 2019 Published: 19 February 2019 Citation: Jory M, Bellouma K, Blanc C, Casanellas L, Petit A, Reynaud P, Vernisse C, Vachier I, Bourdin A and Massiera G (2019) Mucus Microrheology Measured on Human Bronchial Epithelium Culture. Front. Phys. 7:19. doi: 10.3389/fphy.2019.00019
Mucus Microrheology Measured on
Human Bronchial Epithelium Culture
Myriam Jory1, Karim Bellouma1, Christophe Blanc1, Laura Casanellas1, Aurélie Petit2,
Paul Reynaud2, Charlotte Vernisse2, Isabelle Vachier2, Arnaud Bourdin2and
Gladys Massiera1*
1L2C, Univ Montpellier, CNRS, Montpellier, France,2PhyMedExp, INSERM U1046, CNRS UMR 9214, Department of
Pneumology and Addictology, Montpellier University Hospital Arnaud de Villeneuve, Montpellier, France
We describe an original method to measure mucus microrheology on human bronchial epithelium culture using optical tweezers. We probed rheology on the whole thickness of mucus above the epithelium and showed that mucus gradually varies in rheological response, from an elastic behavior close to the epithelium to a viscous one far away. Microrheology was also performed on mucus collected on the culture, on ex vivo mucus collected by bronchoscopy, and on another epithelium model. Differences are discussed and are related to mucus heterogeneity, adhesiveness, and collection method.
Keywords: human bronchial epithelium (HBE), microrheology, mucus, viscoelasticity, optical tweezers (OT), mucins, rheology, biopolymer gels
INTRODUCTION
The mucociliary function of bronchial epithelia ensures the continuous clearance of the airways. Mucus is a visco-elastic gel trapping dust and pathogens present in the inhaled air and thus acts as a protective barrier on top of the airway tissue. Its transport is a key element to ensure an efficient clearance of the respiratory system. It relies on two main elements: cilia beating coordination and mucus rheology.
Mucus are gels made of glycoproteins fibers that form a complex and heterogeneous viscoelastic network [1]. In the past, rheological characterization of airway mucus has been restricted to sputum or mucus from dead mammals because rheology methods require large volumes of sample (mL) and because of the difficulty of collecting human bronchial mucus. Models of human bronchial epithelium (HBE) culture have been developed these last decades [2–5]. While these models have been validated by biological factors demonstrating, for various pathologies, that the phenotype is conserved, a few studies [6–8] describe the physical characteristics of these models and in particular the mucus flowing properties. Even for these cultures, the amount of mucus that can be collected varies with the pathology and is in all cases very small. Typically, when secretion level is high, up to 1 mL can be collected during the 28 days of culture, but some cultures have such a small production that no mucus can be collected at all. Rheology can be performed at a microscale with several advantages: small volumes are required (min 10 µL), it is a measure of the local response and therefore allows to investigate the heterogeneity of the sample, and finally it corresponds to probing how mucus flows at a relevant scale, the scale of a cilium. Common passive microrheology methods are based on the fluctuation-dissipation theorem and consist in using the thermal fluctuations of beads dispersed in the mucus to infer the elastic complex modulus, whereas active methods use optical or magnetic tweezers to apply local forces and measure the consequent deformation. Microrheological studies have been reported on horse airway mucus [9, 10], marine worm mucus [11], porcine respiratory mucus [1], and even human respiratory mucus [6,12], using either active or passive methods. This literature reports two main findings. Probe size and probe/mucus interaction have to
be considered to correctly select the probe and perform reliable microrheological measurements[1]. More importantly, the mucus is described as a highly heterogeneous multi-scale network [10, 11] and conceptual models of mucus elastic structure are proposed: a coupled two-fluid model, or an interlinked scaffolds model. The high heterogeneity of the mucus renders their measurement and interpretation difficult. In particular, the collection of mucus itself could introduce a bias as it is limited to the upper fraction of the mucus layer, potentially the less elastic part as it is the easier part to collect. Moreover, mucus is sensitive to shear stress, pH, and extremely sensitive to water loss. The consequence could be that measurements performed on collected mucus give a less elastic response than mucus present on the epithelium.
In this paper, we use an original method that allows to measure microrheology and probe its variation with the distance from the epithelium, directly on HBE culture, thus avoiding any mucus collection. We will compare microrheology measurements performed on mucus collected from human bronchial cultures, collected during bronchoscopy, and measured on another epithelium model. We will discuss differences and relate them to mucus heterogeneity, adhesiveness and collection method. Finally, we will discuss the potential of this method for future studies and its potential use as a biomarker.
METHODS
Human Bronchial Epithelial (HBE) Cultures
Bronchial biopsies from control, smoker, and COPD subjects were collected during fiberoptic bronchoscopy on a subsegmental bronchus of the left lower lobe at Arnaud de Villeneuve hospital (Montpellier, France). All donors signed a consent form after being informed about the biomedical research on airway epithelium performed thanks to their donation. The protocol was approved by the institutional ethics commission of Sud Méditérranée III (CHRU Montpellier-AOI 9244–NCT02354677). Primary human bronchial epithelial cells were obtained from bronchial biopsy specimens and cultured under Air Liquid Interface (ALI) conditions [13] either with culture media provided by Lonza before January 2018, with a protocol adapted from Gras et al. [5] and Gamez et al. [14]; or with culture media provided by Stemcell Technologies after January 2018, with the manufacturer protocol. Briefly, bronchial epithelial biopsies were mechanically dissociated and suspended in bronchial epithelial growth medium (BEGM, Lonza or PneumaCult-Ex Plus, Stemcell Technologies). After an expansion phase in monolayers, cells were plated on uncoated nucleopore membranes (24-mm dia., 0.4 µm pore size, Transwell Clear, Costar) in a 1:1 mixture of BEGM and Dulbecco’s modified Eagle’s medium (DMEM, Lonza) or with Pneumacult-Ex Plus until confluence. After confluence, the ALI phase can begin by applying media [a 1:1 mixture of BEGM and Dulbecco’s modified Eagle’s medium (DMEM, Lonza) or with the PneumaCult ALI maintenance (Stemcell Technologies)] only at the basal side. Cells were cultured for 28 days to obtain a polarized and differentiated cell population with a mucociliary phenotype.
Mucus Collected From HBE Culture
For cultures with BEGM media, mucus, when efficiently produced by the culture, was gently collected with a micropipette every 2 days and stored at 4◦C, for a maximum of 6 months.
Typically, for one culture well, we obtained around 50 µL of secreted mucus after 2 days. For the cultures with Stemcell Technologies media, mucus is strongly stuck to the epithelium. To collect it, 60 µL of culture medium [PneumaCult ALI maintenance (Stemcell Technologies)] is spread on top of the culture well for 24 h. Then the medium is gently withdrawn. We apply then repeatedly a soft flow of media using a micropipette until some mucus detaches. Mucus is then collected from the medium with a micropipette and analyzed the same day. Typically, for one culture well, after 1 week, we obtained around 20 µL of mucus.
“Ex vivo” Mucus Samples From Clinical
Examination
Mucus is collected during a bronchoscopy on healthy patients by blind soft aspiration through a catheter inserted up to 6– 9th airway division always done by the same practitioner. The typical amount sampled is small, around 20 µL, and stored inside a 1.5 mL tube with water saturated air for transport. Samples containing blood are discarded. The chamber for microrheology analysis is prepared <2 h after mucus collection. Microrheology is performed straightaway.
Optical Tweezers Micro-Rheology
Optical Tweezers
Our set-up is built on an inverted optical microscope LEICA DMI 3000 B supported by an air-damped anti-vibration table (Workstation Series, Melles Griot). The optical trap is generated by the focalization of a laser beam (1064 nm laser YLM 5W, from IPG Photonics) through an x100 (NA 1.4) oil immersion objective. The oscillating trap position is controlled thanks to a pair of acousto-optic deflectors (AA optoelectronic). Alternatively, for lower frequencies and higher laser intensity, the sample is moved thanks to a piezoelectric XY stage (Nano-Bio100 from MCL with a subnanometer accuracy). The trapped microsphere is imaged with a CCD camera Basler Scout-F. A multifunction Field Programmable Gate Array (FPGA) is used to control the different devices and acquire data through a LabVIEW homemade program. The bead position is obtained by image correlation analysis under LabVIEW at a sub-pixel resolution (≈4 nm). In our experiments, we typically impose As = 1µm ord As = 0.5µm depending on the elasticity of our
sample. We measure both Aband ϕ for a range of frequency, f in
between 0.09 and 50 Hz. All of our experiments are conducted at room temperature. Nevertheless, due to local heating of the laser, we measured that the temperature of the sample close to the trap could reach 30◦
C. Principle
Microrheology was investigated using oscillating optical tweezers. Once an isolated bead is trapped with a laser, typical experiments consist in applying a small sinusoidal displacement either to the trap or to the sample. The motion of the bead
then gives information about the viscoelastic properties of the matrix at the driving frequency ω [15–17]. We consider now a displacement of the stage xs∗ = Asejωt (with Asthe amplitude
of the stage displacement) and a fixed trap. In the linear regime, a bead of radius a follows the sinusoidal displacement with a phase shift ϕ, and its trajectory is given by xb∗ = Abejωte−jϕ
(with Abthe amplitude of the bead displacement). Following the
analysis by Shundo et al. [17] and other authors, the complex shear modulus G∗ =
G′+
jG′′is related to the ratio of the fluid
forces acting on the bead to its displacement with respect to the fluid (taking into account a 6πa factor for a spherical bead). The fluid forces being opposed by the restoring harmonic force of the trap of stiffness kOT, one gets:
G∗= kOT xb∗ 6πa (xb∗−xs∗) = kOTAbe −jϕ 6πa (Abe−jϕ−As) and gives: G′= kOT 6πa Ab2− AsAb cos ϕ Ab2 + As2 2 AbAs cos ϕ G′′= kOT 6πa AsAb sin ϕ Ab2 + As2 2 AbAs cos ϕ
where G′and G′′are, respectively, the elastic and loss modulus.
To determine the absolute values of elastic moduli, the stiffness kOT of the trap is required. We obtained kOT using
two different methods depending on samples. For weakly elastic mucus, the Gaussian distribution of the trapped bead position [18] is analyzed. For the most elastic samples, a strong laser intensity is required in order to trap the bead. As a consequence, the Brownian motion cannot be detected. We thus have calibrated the stiffness of the trap as a function of the power intensity in water using the drag force method [18]. In this case, we have hypothesized that the optical force is identical in mucus and in water. This hypothesis is supported by the fact that the optical index of the medium (n ≈ 1.335) is very close to the water one, as measured using a refractometer. The laser optical path differs depending on the thickness and on the transparency of the sample, which can be affected by the presence of impurities (see Figure S1). We thus checked its effect on the laser trap stiffness and on its isotropy. As discussed in the Supplemental Information section, we show that the homogeneity of the laser trap is conserved through 100 µm of sample depth (Figure S3) but we observe a decrease of the laser stiffness around 35% (Figure S2), and that impurities play a minor role. We also discuss in Supplemental laser heating and temperature issues. The laser trap indeed causes a local heating of the sample (<10◦
C). We thus checked that an increase in temperature of up to 7◦
C has little effect on the mucus viscoelasticity (Figure S4). Chambers Preparation
In order to work on isolated microspheres, the concentration of beads was chosen in order to have one bead per 100 × 100µm² in a 100 µm thick sample.
For the mucus collected from HBE cultures, carboxylated melamine resin beads, diameter 3 µm (Fluka Analytical, Sigma-Aldrich), are dispersed in the collected supernatant mucus to a final concentration of 0.004 %v/v. Melamine resin beads, diameter 5 µm, and silica beads, diameter 1 and 4.5 µm, have also been tested and gave comparable results. The sample is then sandwiched in between two pegylated glass plates separated by a mylar spacer. The thickness of the spacer (100 or 175 µm) and the dimension of the chamber are chosen accordingly to the mucus volume available in order to minimize the residual air volume. To prevent evaporation, the chamber is immediately (in <2 min) sealed with a UV curable adhesive (ThorLabs NOA81). During Ultra-Violet (UV) exposure, the sample is protected by a reflector (aluminum foil). For “in vivo” mucus, we proceed exactly the same way.
For measurements performed on HBE cultures, 0.5 µL of the 0.4 %v/v bead solution are firstly mixed with mucus collected from the culture wells (∼ 50 µL). The culture membrane is then cut and deposited on a 3 µL volume of culture medium on a glass slide as illustrated in Figure 1. Mucus containing beads is then gently spread on the epithelium and covered with a cover slip onto which a spacer was previously fixed. Three spacers have been tested: (i) silica debris of 60 ± 10 µm distributed approximately every 500 µm; (ii) adhesive circular spacers (Grace Bio-Labs, 654004), 13 mm in diameter and 120 µm in thickness together with a 4 × 4 mm2 central
piece; (iii) UV curable adhesive squared pillars of 100 × 100 µm2 and 100 µm in height, distributed every 0.5 mm and produced using microlithography. The chamber is immediately UV sealed as previously described, in <5 min after membrane cutting. The sample is left to rest 30 min before performing the experiment.
Experimental Method on HBE Cultures
Experiments are conducted no longer than 3 h, during which average of 15 experiments can be performed. We observed cell death after 1 h under the microscope with a laser on at 0.1–1 W. We checked that measurements performed at the same height h, at 1 and 2 h, gave overlapping results. The distance h separating the bead from the epithelium was measured using the microscope fine focus graduations (2 µm). For each measurement, a bead is selected and trapped close to the cover slip (far from the epithelium) and used to measure the rhelogical response at this height. The bead is then gradually dragged to different heights in the direction of the epithelium and the distance hc to the
coverslip is recorded for each rheological measurement. The distance between the coverslip and the tissue, ht, is measured
once the bead reached the cell tissue and is used to compute h, the distance between the bead and the epithelium: h = ht−hc.
The distance ht is measured for each bead at the end of the
experiment since it cannot be removed from the epithelium once it contacted it. For each experiment, the bead is dragged to a given height h, and we then wait a minimum of 3 min before measurement, to allow stress relaxation (see Figure S5). A measurement is performed every 10 µm approximatively when possible: the number of heights per bead is limited by bead loss during the dragging or during the measurement. To evaluate the
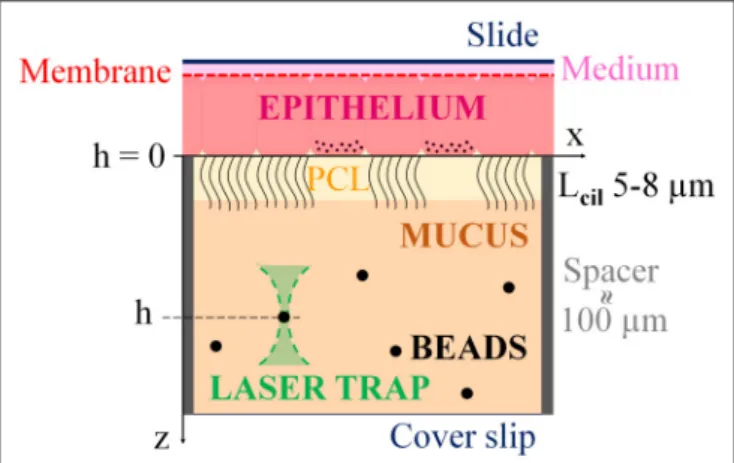
FIGURE 1 | Scheme illustrating the principle of the measurement: The membrane supporting the cultured epithelium is placed on a glass slide, on top of culture medium. A coverslip is put on top of the mucus layer lying on the epithelium. The chamber is sealed and placed upside down under an inverted microscope equipped with optical tweezers. Beads can be trapped and used as micro-probes to perform microrheology. Rheology can then be measured at different distances from the epithelium by selecting beads at different height or by entraining a given bead from the bottom to the top. Distances from the epithelial cells layer typically vary from 100 µm down to several µm. PCL stands for periciliary layer and Lcil is the typical cilia length.
robustness of our results and explore our samples heterogeneity, a height sweep is performed with at least three different beads, taken at different xy locations, and dragged to several heights. On average, 15 measurements are obtained by chamber. In most cases, a few heights are obtained per beads. We then use more beads to increase our statistics. When measuring microrheology close to the epithelium, cilia beating hinder proper rheology measurement. We thus need areas without beating cilia. In the case of BEGM cultures, the density of beating ciliated cells is low (<20%), and we simply worked in areas without beating. In the case of Pneumacult cultures, cilia density is high (60– 80%). We locally stopped cilia beating activity by focalizing the laser on ciliated cells at 2.5W for around 5 s, on an area of a few micrometers.
RESULTS
Mucus collection from cultured wells depends on the mucus flowing properties, which could introduce a bias in their characterization. Indeed, withdraw is easier when the mucus is poorly elastic and is in all cases limited to the mucus layer far from the epithelium to avoid damaging of the culture. To measure the microrheology response within the mucus layer lying on top of cultured HBE and probe its variation with the distance to the epithelium, we developed a new protocol and adjusted our setup. Figure 1 illustrates the principle of the experiment: Beads are dispersed in the mucus layer as described in the methods section. An optical tweezer is used to trap a bead at a given height in the chamber. The selected bead is then used as a rheological probe: a deformation is applied by oscillating the bead and measuring the resulting force. The elastic G′ and loss G′′ moduli can be computed
as detailed in the method section. Rheology can be measured at different distances from the epithelium by selecting beads at different heights in the mucus layer or by entraining a given bead from the bottom to the top. Distances from the epithelial cells layer typically vary from 100 micrometers down to several micrometers.
Figure 2compares the rheological response measured directly
on the culture and on the mucus collected from the same epithelium (named “bulk” in the following). The elastic moduli G′(f) and G′′(f) are represented on a log-log plot over a decade of
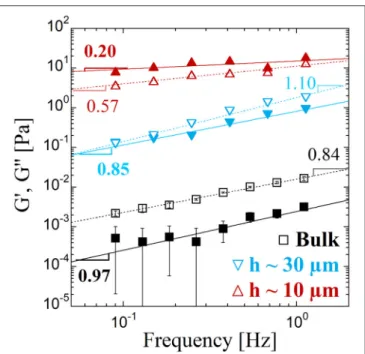
frequency f, from 0.09 to 1.1 Hz, and are fitted with a power law function. In “bulk,” we find the hallmarks of a viscous fluid: G′′
is 10x larger than G′
, and both moduli can be fitted by a power law with exponents very close to 1. Their values correspond to a fluid ∼10 times more viscous than water. Results obtained on the culture drastically differ in amplitude, by 2 to 3 orders of magnitude, and G′
is now larger than G′′
for h < 20 µm approximatively. The response also evolves with the distance probe-epithelium. The power law exponents are much lower when the probe gets closer to the epithelium layer (≈ 10 µm): 0.2 for G′ and 0.57 for G′′. Within the mucus layer, when the
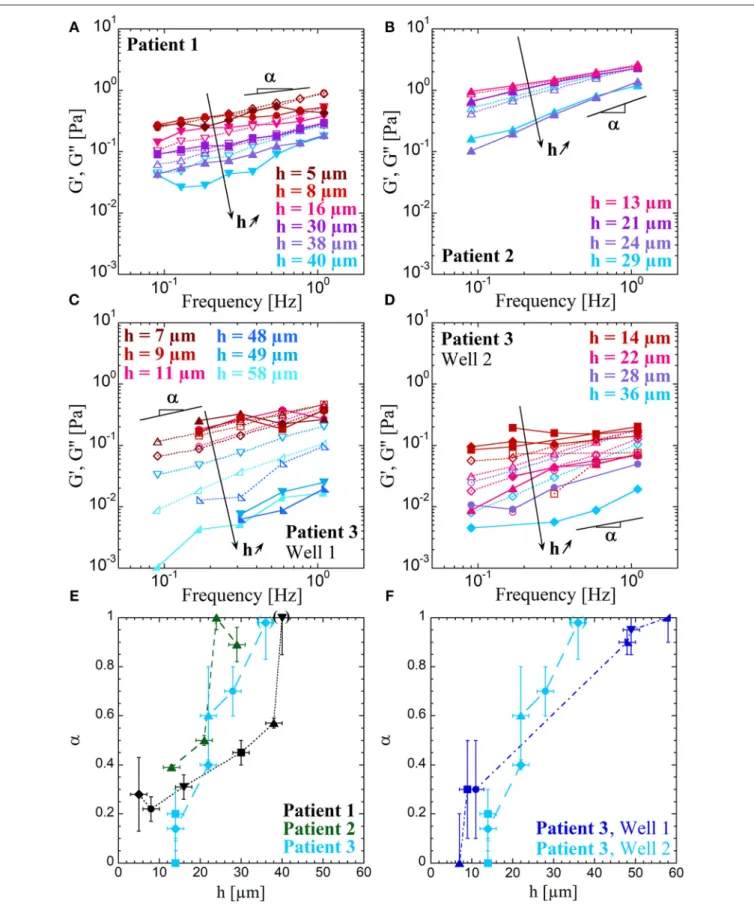
probe distance h from the epithelium is varied from close (a few microns) to far (>50 µm), we observe that the mucus rheological response evolves gradually from the response of a viscoelastic to a viscous fluid, as illustrated in Figure 3 for four cultures obtained from three different biopsies: two smokers (Patient 1 and 3) and a control (Patient 2). On Figure 3, each type of symbol corresponds to a measurement performed with a different bead, i.e., a different xy location on the epithelium. Due to the bead loss during dragging or measurement, measurements can only be performed for a few heights per bead (Figure 3A). Nevertheless, we obtain that different beads at the same height give similar results, as illustrated in Figure 3D with the overlap of the curves in red at h = 14 µm (squares and diamonds) or also the curves in pink at h = 22 µm (diamonds and triangles up). BEGM cultures thus seem homogeneous in the xy plan. The power law exponent α measured on G′(f) is plotted as a function of h and increases with
the distance to the epithelium, clearly showing that mucus is less elastic far from the epithelial layer (Figure 3E). The robustness of our results is shown by measuring microrheology on two different wells obtained from the same biopsy (Patient 3). Data are consistent (Figures 3C,D) and result in the same slope for αvs. h (Figure 3F).
To evaluate how these data obtained from a model of bronchial epithelium can be compared to the rheological response of mucus “ex vivo,” we performed microrheology on mucus extracted from bronchia during clinical examination. Collecting mucus inside bronchia is challenging. Nevertheless, on some occasions, tiny amounts could be obtained, enough to be probed by microrheology. All of our data are reported in Figure 4, for seven patients. These samples contain a large quantity of floating cells. Therefore, in our results description, we consider two distinct cases as illustrated in Figure 4: Case I (squares), the probe is in the vicinity of an aggregate, at least 3 µm away, and Case II (circles), the probe is far (> 15 µm) from cells, in a transparent region, as illustrated in
FIGURE 2 | Microrheology of mucus from a bronchial epithelium culture: The elastic G′(filled symbols) and loss G′′(empty symbols) moduli are represented
as a function of the frequency f. For the same culture, measurements are performed for mucus withdrawn from the epithelium (squares), noted as “bulk” and directly on the epithelium (triangles). For measurements performed on the culture, the approximate distance separating the bead from the epithelium is indicated for each symbol. Error bars correspond to min-to-max values obtained on measurements performed in “bulk” (N = 4). The solid and dotted lines are fits with a power law function of, respectively, G′(f) and G′′(f). The
power law exponent is indicated on the figure with an incertitude of ± 0.05 and power law amplitudes G0=G′(f = 1 Hz) are equal, in Pa, to G′(0.002;
0.82; 15.12) and G′′(0.02; 1.81; 11.25) for respectively, the bulk, 1h ≈ 30 µm,
and 1h ≈ 10 µm.
to 11 different measurements, cover almost 5 decades. The curves corresponding to Case I, with a probe in the vicinity of cell aggregates, have amplitudes varying from 0.4 to 30 Pa and power law exponents in between 0.01 and 0.5, G′
being always greater than G′′
. These are hallmarks of an elastic complex fluid. Case I curve is close to an elastic plateau at 5 Pa, while curves corresponding to probes far away from cells (Case II) are closer to what we obtain for measurements in “bulk”: a viscous response with G′′
greater than G′
, small moduli with power law exponents close to 1.
Figure 5 gathers all the results previously presented,
highlighting two families of curves: rheology curves reflecting the viscous nature of the mucus measured in “bulk” or “ex vivo” for probes isolated from cell aggregate, and a second family of curves highlighting the elastic nature of the mucus for experiments performed on culture wells with a probe close to the epithelium, or when the probe is located near surfaces or cellular structures for mucus collected from HBE culture and “ex vivo” mucus samples, respectively.
Again with the objective of evaluating the HBE culture model from the physical perspective, we compare the mucus flow properties of two HBE cultures which differ by the culture
method and in particular the culture medium used to feed the cells as described in the method section. In the following, we will name these two models “BEGM” and “Pneumacult,” using the names of the culture media used for each method. The results that have been described so far all correspond to the “BEGM” culture model. Figure 6 gather the microrheological measurements obtained “in bulk” with N = 4 “Pneumacult” and N = 10 “BEGM” cultures (Figure 6A), and obtained on the culture with N = 2 and N = 4 for, respectively, “Pneumacult” and “BEGM” cultures (Figure 6B). The elastic moduli value and dependence on the frequency f are considerably different for the two models, and even more obviously when mucus is probed in “bulk”. “BEGM” mucus, as previously described, has the hallmarks of a viscous fluid “in bulk” and behave as an elastic fluid close to the epithelium. “Pneumacult” mucus is highly elastic with an elastic plateau at 8 Pa “in bulk”. On HBE “Pneumacult” cultures, mucus rheology (Figure 7) is characterized by power law exponents in the range 0.3–0.5 and elastic moduli values spanning two decades [G′(f = 1 Hz) = 0.7–70Pa], without any correlation with
the distance h to the epithelium (Figures 7B,C). The power law exponent (the degree of elasticity vs. viscosity) is a constant function of h, around 0.3–0.5 (Figure 7B), except for distances to the epithelium <10 µm, for which α surprisingly reaches values as high as 1. Because of the high beating activity for “Pneumacult” cultures, we consider with caution results obtained for h< 10 µm, which probably corresponds to distance to cilia < 5 µm. “Pneumacult” measurements on HBE cultures do not display the continuous increase in α with the distance h to the epithelium that we obtained on “BEGM” HBE cultures. It is important though to mention here that these two culture methods result in remarkably different epithelia features. “Pneumacult” cultures have much more beating ciliated cells and a lower production of mucus with a thicker and more elastic aspect. The mucus observed on “Pneumacult” culture contains numerous cellular debris (see Figure S1D) and is highly inhomogeneous (Figure 7D), while mucus from “BEGM” culture is transparent, and floating cells are observed only on some occasions (see Figures S1A,C).
DISCUSSION
Difficulties in characterizing human airway mucus are essentially related to the small amount of high quality physiological mucus that can be collected [19–21]. To respond to the requirement of measuring rheology on small volumes of mucus, novel techniques named microrheology have been proposed [1,10,22]. However, the collection of mucus itself could lead to a biased picture of the ex vivo mucus properties as only the supernatant mucus can be collected. The less elastic, the easier it is to collect the mucus. The consequence could be that collected mucus is less elastic than the one on the epithelium. In addition the mucus as a layered structure with a gel phase on top of a periciliary watery layer [19]. To measure how microrheology vary within the mucus layer lying on top of cultured bronchial epithelium and probe its variation with the distance from the epithelium, we developed a new protocol and implemented our setup.
FIGURE 3 | Variation of the microrheology response with the distance to the epithelium: The elastic G′(filled symbols and solid lines) and loss G′′(empty symbols and
dotted lines) moduli are represented as a function of the frequency f in panels (A–D). Measurements are performed by entraining beads from the bottom to the top. (Continued)
FIGURE 3 | Each symbol corresponds to a different bead. The four bronchial epithelia are cultured starting from biopsy of a smoker (Patient 1) for (A), a control (Patient 2) for (B) and two wells obtained from the same smoker (Patient 3) for (C,D). Power law exponents α of G′(f) are represented in panels (E,F) as a function of
the distance h from the epithelium cells layer, with in (E) the three patients: Patient 1 (black, dotted line), Patient 2 (dark green, short dashed line) and Patient 3 (light blue, long dashed line); and in (F) the comparison between two wells of Patient 3: well 1 (dark blue, dotted and dashed line) and well 2 (light blue, long dashed line). Each symbol corresponds to different beads and are kept identical to the corresponding data of panels (A–D). Error bars report on errors on the height h and on the determination of α by fitting G′(f) by a power law. The parentheses around some points at h > 30 µm indicate inaccurate values of α when the behavior of the
corresponding curve G′(f) is not a power law.
FIGURE 4 | Microrheology of mucus collected from bronchia during a patient examination. (A) The elastic G′(filled symbols) and loss G′′(empty symbols) moduli are
represented as a function of the frequency f. The 9 reported curves correspond to different patients and cases. Since “ex vivo” mucus contains a lot of cell debris, measurements have been performed in different locations: with the probe in the vicinity (between 3 and 10 µm) of cellular structures (Case I, squares), and with the probe away (more than 15 µm) from cellular structures (case II, circles). The data reported for each curve correspond to the averaged G′and G′′on N measurements
performed on the same sample (patient) but for different bead locations and distinct cases (I and II). Error bars correspond to min-to-max values obtained from N measurements. Case I, patients #1–6, N = 3, 1, 4, 5, 4, 2; Case II, patient #5&7 N = 5, 4. (B) Power law exponent α (filled symbols) and amplitude G0 (empty symbols) of G′(f) for the 2 cases, II (squares) and III (circles). The values are obtained by a power law fit of the 9 reported curves in panel A of elastic modulus G′as a
function of the frequency f. Colors refer to the different patients and bars correspond to min-to-max values obtained from N measurements.
Collected Mucus and Mucus on the
Epithelium Have a Different Microrheology
Response
Recent papers are focused on the mucus rheology and compare the rheological response of mucus measured at the macro-scale using standard rheometers to measurements performed at a microscale [9–12,23]. These studies have been performed on mucus of various origin: horse airway mucus [9, 10], marine worm mucus [11], porcine respiratory mucus[1], and even HBE mucus [6, 12], using either active or passive methods for microscale measurements. It is shown that probe size and probe/mucus interaction have to be considered to correctly select the probe and perform reliable microrheological measurements [1]. Furthermore, mucus appears as a highly heterogeneous multi-scale network with coupled two-fluid or interlinked scaffolds models being proposed [10,23]. Micro and macro-rheology consequently result in different behaviors and values [10, 12, 23]. In addition to the scale at which mucus rheology is probed, we discuss here how mucus collection can
introduce a bias. We show, using mucus from the same well, that mucus measured once collected and measured directly on the epithelium have very different responses. Elastic moduli are several orders of magnitude larger on the epithelium with an elastic response rather than a viscous behavior as for the “bulk” case (Figure 2). This confirms that mucus collection is delicate and might lead to a misinterpretation of the results as only the less elastic fraction of mucus can be withdrawn from the epithelium.
Microrheology Gradually Varies Within the
Mucus Layer on the Epithelium From
Elastic to Viscous
More importantly, we find that the mucus rheology is not homogeneous but consistently varies from elastic to viscous when probed at increasing distances from the epithelium (Figure 3). The viscoelastic moduli G′
and G′′
variation with the frequency f is used to quantify and analyse the mucus viscoelastic response. We consider three main features of G′(f)
FIGURE 5 | Summarizing figure gathering the 6 main types of measurements. Microrheology of ALI mucus performed on collected mucus (circles) either in “bulk” (black) or close to a surface (dark red), performed directly on the culture well (squares) with a probe close to (10 µm, red) or away (30 µm, blue) from the epithelium, and on bronchia-collected mucus (color areas) with the probe close (I, dark gray) or away (II, light gray) from cellular structures. Symbols represent the elastic modulus G′as a function of the frequency f and solid lines the power law fit of these 4 curves with the value of the power law exponent α written on the graph. Error bars
correspond to min-to-max values obtained on several patients with N = 10 in “bulk” and N = 1 close to a surface for collected mucus, and N = 4 for mucus directly on the culture well, close to and away from the epithelium. The curves represent the mean value on these N patients.
and G′′(f): the amplitude of the elastic moduli G
0 = G′(f =
1 Hz), that give the viscoelasticity level; the ratio G′/G′′, and
the power law exponent α, which both are a measure of the elastic vs. viscous character of the complex fluid. In particular, the exponent α is expected to be equal to 1 when the fluid is purely viscous and to 0 for a purely elastic solid. α increases roughly linearly with the distance h to the epithelium thus going from an elastic to a viscous behavior. The rate at which the behavior goes from elastic to viscous with the distance h is highly dependent on the culture, but the variation in α for two wells obtained from the same biopsy consistently overlaps (Figure 3F), bringing robustness to our results. This is the first demonstration of a gradient in viscoelasticity in the mucus layer of bronchial epithelium, even if the hypothesis has been present in the literature for long in particular because of its layered structure [19].
Mucus “ex vivo” Collected From Bronchia
Contains a Lot of Cell Debris That Affect
the Microrheology Response
All the difficulties related to collecting native mucus have restricted mucus physical and biochemical studies to sputum for which it is difficult to prevent saliva contamination. Some
techniques have been proposed to measure mucus collected during bronchofibroscopy allowing to collect mucus sample without saliva but they are extremely constrained [19]. We attempt to characterize the flowing properties of mucus collected from human bronchia by simple aspiration during a clinical examination. We obtain a very broad set of data (Figure 4) probably due to the variability of the mucus, and of its collection. Cell debris are present in large amount and contribute to the microscale rheology measurements. The rheology response, indeed, essentially depends on the probe vicinity to cellular structures. Far from any structure, elastic moduli are consistent with what we find for mucus collected from HBE: the rheology corresponds to a medium of viscosity equal to 2–20 times the water viscosity (Figure 4). Close to cellular structure, our results are rather consistent with the elastic behavior obtained on mucus collected from HBE when the probe is close to surfaces such as the glass plate. We hypothesize as discussed in another publication [19], that this elastic response occurs thanks to filaments-like structures that could form when the probe contacts any surface because of the highly adhesive nature of the mucus. Mucus is composed of mucins, proteinglycans, lipids, that interact together to form a gel network, but that also interact with cilia and other cellular structures. Flow properties of these “ex vivo” samples can be subjected to various contributions affecting rheology such
FIGURE 6 | Microrheology of mucus from two different culture methods performed in the “bulk” on collected mucus (A) and directly on the culture close to the epithelium for height h around 10 µm (B). Culture 1 and 2 are, respectively, obtained using a “BEGM” (orange bars) and a “Pneumacult” (green bars) medium. The elastic G′(dark color bars) and loss G′′(light color bars) moduli are represented as a function of the frequency f. The bars correspond to min-to-max values obtained
from N measurements with: in the “bulk” (A) N = 10 and N = 4, on the culture (B) N = 4 and N = 2, for, respectively, culture 1 and 2.
as water loss, collection method, or collection region, stress induced hypersecretion, tissue damage. We thus consider that these measurements are only indicative of what could be the bronchia mucus microrheology.
Figure 5 summarizes all of our results and show that
depending on how mucus is measured, G′ and G′′fall on one
of two families of curves: curves corresponding to a viscous behavior with low value of the moduli or curves corresponding to an elastic behavior with lower exponent and higher moduli values. Collection of mucus seems to have a huge role on the type of behavior that is obtained as a result without being strictly related to the bronchia mucus properties. Measuring the viscoelastic moduli as a function of the frequency directly on the epithelium seems to be the most reliable way to evaluate the microrheological response of respiratory mucus.
On the Role of the Culture Method on
Physical Features of the Human Bronchia
Epithelium: “BEGM” and “Pneumacult”
Finally, we compared two methods of culture, essentially differing in the culture media used to feed the cells “BEGM” and “Pneumacult”. They give different results both on collected mucus and when rheology is measured on the epithelium (Figure 6). This is in agreement with macroscopic observation of the samples, as the mucus from “Pneumacult” culture appears as highly elastic and sticky in comparison with “BEGM” mucus. These first experiments show that the gradual variation observed on the whole mucus layer for “BEGM” culture is not found for “Pneumacult” culture (Figure 7). On the reverse, the elasticity
is always high and does not seem to be as dependent on the distance to the epithelium. This has to be confronted to the very high heterogeneity of this mucus and to the large number of cell debris it contains. This culture method which is the one used in our group since January 2018, provides epithelia which are singularly different in its physical characteristics, while it has been proven to represent a reliable and robust model of respiratory epithelia by means of biological markers and tissues characterization [24,25]. Pneumacult cultures are probably more physiologically relevant since epithelia are much more active with a density of beating cells probably closer to in vivo tissues. Nevertheless, the mucus is produced in much lower quantity and difficult to collect. The presence of cells alters mucus rheology determination. Overall, BEGM cultures were an easier tool to investigate mucus rheology on culture and to show robustly the existence of a variation in the viscoelastic behavior with the distance to the epithelium, which was never assessed before. Pneumacult cultures because of heterogeneity do not exhibit such a clear variation and need more biological investigation to be considered as a good biological model. Further investigations on these culture are to be performed to analyze other physical characteristics such as cilia beating and mucus flow [7].
CONCLUSION
Mucus is a complex biofluid that fulfills numerous biological functions. Among its physical properties, rheology is crucial to understand how mucus flow is generated in the mucociliary system. Mucus collection to evaluate its physical properties
FIGURE 7 | “Pneumacult” culture characteristics: (A) Microrheology of mucus from bronchial epithelium culture obtained using a “Pneumacult” culture medium. The elastic G′(filled symbols and solid lines) and loss G′′(empty symbols and dotted lines) moduli are represented as a function of the frequency f. Measurements are
performed by entraining 3 different beads at different spatial (xy) localizations (circles, squares, diamonds) from the bottom to the top. (B) The exponent α of the G′(f)
power law fit for the 3 xy localizations (circles, squares, diamonds) as the function of the probe distance h to epithelium. Bars represent the errors on the height h and on the determination of α by the power law fit. (C) Amplitude of the power law fit of the elastic modulus G0=G′(f = 1Hz) vs. probe to epithelium distance h for the 3
xy localizations (circles, squares, diamonds). Error bars represent the errors on the height h and on the determination of G0by the power law fit. (D) Picture of the culture at low magnification focalized above the mucus layer. Scale bar: 200 µm.
results in very small volumes of a selected fraction of mucus because of mucus high heterogeneity and interaction with the epithelium. Collected mucus is consequently poorly representative of native mucus rheology. We took full advantage of the human bronchial epithelia models developed thanks to air-liquid interface cultures and developed an original method to measure mucus rheology directly on the epithelium. Our
main experimental findings are that beside the heterogeneous structures formed by the mucus, which remains difficult to decipher, mucus rheological response varies, for BEGM cultures, from an elastic behavior close to the epithelium to a viscous one far away, and with up to a two-fold decrease in elastic moduli on distances to the epithelium from 10 to 50 µm. On Pneumacult cultures which are now the one available, similar experiments
need to be performed at an earlier stage, before cilia density becomes too high. Our findings could now be used at various levels to understand how this variation in elasticity with the distance to the epithelium could contribute to mucus transport when coupled to cilia beating. On a clinical point of view, it is not obvious at this stage if this method could be used for diagnosis as a clinical marker, mainly because experiments are delicate and time consuming. On a more fundamental point of view though, these experimental results could now be used in numerical models [26,27] describing the whole epithelium, and in particular the emergence of metachronal waves and mucus transport thanks to cilia beating in a mucus with elastic properties varying with the distance to the epithelium.
AUTHOR CONTRIBUTIONS
IV, AB, and GM conceived the project. MJ, LC, IV, AB, and GM coordinated the experimental and data analysis activity. AP
and CV provided cultures. PR performed bronchoscopies. CB developed the optical tweezers and adapted it to microrheology experiments. MJ, CB, and KB performed experiments. MJ analyzed data. GM wrote the first draft of the manuscript. MJ and CB wrote sections of the manuscript. All authors contributed to manuscript revision, read, and approved the submitted version.
FUNDING
Labex Numev, FSFR AAP2015-2-053, Vaincrelamucoviscidose AP2016 RF20160501673, ANR Mucocil 13-BSV5-0015.
SUPPLEMENTARY MATERIAL
The Supplementary Material for this article can be found online at: https://www.frontiersin.org/articles/10.3389/fphy. 2019.00019/full#supplementary-material
REFERENCES
1. Lai SK, Wang YY, Wirtz D, Hanes J. Micro- and macrorheology of mucus. Adv Drug Deliv Rev. (2009) 61:86–100. doi: 10.1016/j.addr.2008. 09.012
2. Gras D, Petit A, Charriot J, Knabe L, Alagha K, Gamez AS, et al. Epithelial ciliated beating cells essential for ex vivo ALI culture growth. BMC Pulm Med. (2017) 17:1–7. doi: 10.1186/s12890-017-0423-5
3. Leslie Fulcher M, Gabriel S, Burns KA, Yankaskas JR, Randell SH. Well-differentiated human airway epithelial cell cultures. Hum Cell Cult Protoc. (2005) 107:183–206. doi: 10.1385/1-59259-861-7:183
4. Liu Y, Fire AZ, Boyd S, Olshen RA. Rescue of CF airway epithelial cell function in vitro by a CFTR potentiator, VX-770. Proc Natl Acad Sci USA. (2014) 106:18825–830. doi: 10.1016/j.melaen.2014.05.008
5. Gras D, Bourdin A, Vachier I, De Senneville L, Bonnans C, Chanez P. An ex vivo model of severe asthma using reconstituted human bronchial epithelium. J Allergy Clin Immunol. (2012) 129:1259–1266.e1. doi: 10.1016/j.jaci.2012.01.073
6. Hill DB, Vasquez PA, Mellnik J, McKinley SA, Vose A, Mu F, et al. A biophysical basis for mucus solids concentration as a candidate biomarker for airways disease. PLoS ONE (2014) 9:1–11. doi: 10.1371/journal.pone. 0087681
7. Khelloufi MK, Loiseau E, Jaeger M, Molinari N, Chanez P, Gras D, et al. Spatiotemporal organization of cilia drives multiscale mucus swirls in model human bronchial epithelium. Sci Rep. (2018) 8:1–10. doi: 10.1038/s41598-018-20882-4
8. Feriani L, Juenet M, Fowler CJ, Bruot N, Chioccioli M, Holland SM, et al. Assessing the collective dynamics of motile cilia in cultures of human airway cells by multiscale DDM. Biophys J. (2017) 113:109–19. doi: 10.1016/j.bpj.2017.05.028
9. Bokkasam H, Ernst M, Guenther M, Wagner C, Schaefer UF, Lehr CM. Different macro- and micro-rheological properties of native porcine respiratory and intestinal mucus. Int J Pharm. (2016) 510:164–7. doi: 10.1016/j.ijpharm.2016.06.035
10. Kirch J, Schneider A, Abou B, Hopf A, Schaefer UF, Schneider M, et al. Optical tweezers reveal relationship between microstructure and nanoparticle penetration of pulmonary mucus. Proc Natl Acad Sci USA. (2012) 109:18355– 60. doi: 10.1073/pnas.1214066109
11. Weigand WJ, Messmore A, Tu J, Morales-Sanz A, Blair DL, Deheyn DD, et al. Active microrheology determines scaledependent material properties of Chaetopterus mucus. PLoS ONE (2017) 12:1–19. doi: 10.1371/journal.pone.0176732
12. Schuster BS, Suk JS, Woodworth GF, Hanes J. Nanoparticle diffusion in respiratory mucus from humans without lung disease. Biomaterials (2013) 34:3439–46. doi: 10.1016/j.biomaterials.2013.01.064
13. Jeffery P, Holgate S, Wenzel S. Methods for the assessment of endobronchial biopsies in clinical research: application to studies of pathogenesis and the effects of treatment. Am J Respir Crit Care Med. (2003) 168:S1–17. doi: 10.1164/rccm.200202-150WS
14. Gamez AS, Gras D, Petit A, Knabe L, Molinari N, Vachier
I, et al. Supplementing defect in club cell secretory protein attenuates airway inflammation in COPD. Chest (2015) 147:1467–76. doi: 10.1378/chest.14-1174
15. Tassieri M, Gibson GM, Evans RML, Yao AM, Warren R, Padgett MJ, et al. Measuring storage and loss moduli using optical tweezers: Broadband microrheology. Phys Rev E (2010) 81:1–5. doi: 10.1103/PhysRevE.81. 026308
16. Tassieri M, Del Giudice F, Robertson EJ, Jain N, Fries B, Wilson R, et al. Microrheology with optical tweezers: Measuring the relative viscosity of solutions “at a glance.” Sci Rep. (2015) 5:1–6. doi: 10.1038/srep 08831
17. Shundo A, Hori K, Penaloza DP, Tanaka K. Optical tweezers with fluorescence detection for temperature-dependent microrheological measurements. Rev Sci Instrum. (2013) 84:14103. doi: 10.1063/1.4789429
18. Neuman KC, Block SM. Optical trapping. Rev Sci Instrum. (2004) 75:2787–09. doi: 10.1063/1.1785844
19. Girod S, Zahm JM, Plotkowski C, Beck G, Puchelle E. Role of the physiochemical properties of mucus in the protection of the respiratory epithelium. Eur Respir J Off J Eur Soc Clin Respir Physiol. (1992) 5:477–87.
20. Jeanneret-Grosjean A, King M, Michoud MC, Liote H, Amyot R. Sampling technique and rheology of human. Am Rev Respir Dis. (1988) 137:707–10. 21. Zayas JG, Man GCW, King M. Tracheal mucus rheology in patients
undergoing diagnostic bronchoscopy interrelations with smoking and cancer. Am Rev Respir Dis. (1989) 141:1107–13.
22. King M, Macklem PT. Rheological quantities properties of microliter of normal mucus. J Appl Physiol Respir Exerc Physiol. (1977) 42:797–802. 23. Gross A, Torge A, Schaefer UF, Schneider M, Lehr CM, Wagner C. A
foam model highlights the differences of the macro- and microrheology of respiratory horse mucus. J Mech Behav Biomed Mater. (2017) 71:216–22. doi: 10.1016/j.jmbbm.2017.03.009
24. Gohy ST, Hupin C, Pilette C, Ladjemi MZ. Chronic inflammatory airway diseases: the central role of the epithelium revisited. Clin Exp Allergy (2016) 46:529–42. doi: 10.1111/cea.12712
25. Gohy ST, Hupin C, Fregimilicka C, Detry BR, Bouzin C, Chevronay HG, et al. Imprinting of the COPD airway epithelium for dedifferentiation and mesenchymal transition. Eur Respir J. (2015) 45:1258–72. doi: 10.1183/09031936.00135814
26. Chatelin R, Anne-Archard D, Murris-Espin M, Thiriet M, Poncet P. Numerical and experimental investigation of mucociliary clearance breakdown in cystic fibrosis. J Biomech. (2017) 53:56–63. doi: 10.1016/j.jbiomech.2016.12.026
27. Chateau S, Ortona UD, Poncet S, Favier J, David T. Transport and mixing induced by beating cilia in human airways. Front Physiol. (2018) 9:161. doi: 10.3389/fphys.2018.00161
Conflict of Interest Statement: The authors declare that the research was
conducted in the absence of any commercial or financial relationships that could be construed as a potential conflict of interest.
Copyright © 2019 Jory, Bellouma, Blanc, Casanellas, Petit, Reynaud, Vernisse, Vachier, Bourdin and Massiera. This is an open-access article distributed under the terms of the Creative Commons Attribution License (CC BY). The use, distribution or reproduction in other forums is permitted, provided the original author(s) and the copyright owner(s) are credited and that the original publication in this journal is cited, in accordance with accepted academic practice. No use, distribution or reproduction is permitted which does not comply with these terms.