DEVELOPMENT OF MACROSCOPIC NANOPOROUS
GRAPHENE MEMBRANES FOR GAS SEPARATION
BY
MICHAEL
S. H.
BOUTILIERMASSAC BACHELOR OF APPLIED SCIENCE IN MECHANICAL ENGINEERING, OF
UNIVERSITY OF WATERLOO, 2009
MASTER OF APPLIED SCIENCE IN MECHANICAL ENGINEERING,
UNIVERSITY OF WATERLOO, 2011
LI
HUSETTS INSTITUTE TECHNOLOGY
B 15 2017
3RARIES
SUBMITTED TO THE DEPARTMENT OF MECHANICAL ENGINEERING
AMHV
IN PARTIAL FULFILLMENT OF THE REQUIREMENTS FOR THE DEGREE OFDOCTOR OF PHILOSOPHY IN MECHANICAL ENGINEERING AND COMPUTATION AT THE
MASSACHUSETTS INSTITUTE OF TECHNOLOGY
FEBRUARY 2017
MASSACHUSETTS INSTITUTE OF TECHNOLOGY 2017. ALL RIGHTS RESERVED.
A UTHO R ...
Signature redacted
MICHAEL S. H. BOUTILIER
DEPARTMENT OF MECHANICAL ENGINEERING
Signature redacted
NOVEMBER 10, 2016C-ER TIFIED B Y ... ... ,...
~i nn~tiir~
U CERTIFIED BY ... ACCEPTED BY ... CH ACCEPTED BY ... ROHIT KARNIKASSOCIATE PROFESSOR OF MECHANICAL ENGINEERING
THESIS CO-SUPERVISOR
redacted-NICOLAS G. HADJICONSTANTINOU
PROFESSOR OF MECHANICAL ENGINEERING A t THESIS CO-SUPyVIOR
Signature redacted7
ROHAN ABEYARATNE PROFESSOR OF MECHANICAL ENGINEERING AIRMAN, DEPARTMENT COMMITTEE ON GRADUATE THESES
ignature redacted
t '~ YOUSSEF MARZOUK
ASSOCIATE PROFESSOR OF AERONAUTICS AND ASTRONAUTICS
Development of macroscopic nanoporous graphene membranes
for gas separation
by
Michael S. H. Boutilier
Submitted to the Department of Mechanical Engineering
on November 10, 2016, in partial fulfillment of the requirements for the degree of Doctor of Philosophy in Mechanical Engineering and Computation
Abstract
Separating components of a gas from a mixture is a critical step in several important industrial processes including natural gas purification, hydrogen production, carbon dioxide sequestration, and oxy-combustion. For such applications, gas separation membranes are attractive because they offer relatively low energy costs but can be limited by low flow rates and low selectivities.
Nanoporous graphene membranes have the potential to exceed the permeance and selectivity limits of existing gas separation membranes. This is made possible by the atomic thickness of the material, which can support sub-nanometer pores that enable molecular sieving while presenting low resistance to permeate flow. The feasibility of gas separation by graphene nanopores has been demonstrated experimentally on micron-scale areas of graphene. However, scaling up to macroscopic sizes presents significant challenges, including graphene imperfections and control of the selective nanopore size distribution across large areas. The overall objective of this thesis research is to develop macroscopic graphene membranes for gas separation.
Investigation reveals that the inherent permeance of large areas of graphene results from the presence of micron-scale tears and nanometer-scale intrinsic defects. Stacking multiple graphene layers is shown to reduce leakage exponentially.
A model is developed for the inherent permeance of multi-layer graphene and shown to
accurately explain measured flow rates. Applying this model to membranes with created selective pores, it is predicted that by proper choice of the support membrane beneath graphene or adequate leakage sealing, it should be possible to construct a selectively permeable graphene membrane despite the presence of defects.
Interfacial polymerization and atomic layer deposition steps during membrane fabrication are shown to effectively seal micron-scale tears and nanometer-scale defects in graphene. The support membrane is designed to isolate intrinsic defects and reduce leakage through tears.
Methods of creating a high density of selectively permeable nanopores are explored. Knudsen selectivity is achieved using macroscopic three-layer graphene membranes on polymer supports
by high density ion bombardment. Separation ratios exceeding the Knudsen effusion limit are
achieved with single-layer graphene on optimized supports by low density ion bombardment followed by oxygen plasma etching, providing evidence of molecular sieving based gas separation through centimeter-scale graphene membranes.
Thesis Co-Supervisor: Rohit Karnik
Title: Associate Professor of Mechanical Engineering Thesis Co-Supervisor: Nicolas G. Hadjiconstantinou Title: Professor of Mechanical Engineering
Acknowledgements
This work would not have been possible without the guidance of my advisors, Prof. Rohit Karnik and Prof. Nicolas G. Hadjiconstantinou, who constantly proposed creative solutions, suggested new directions, and provided thoughtful insights. I am also grateful for the advice provided by my other thesis committee member, Prof. A. John Hart, particularly during the membrane fabrication method development stages of this work.
I would like to thank the members of Prof. Karnik's lab for their help and suggestions.
Most notably, I am grateful to Sean C. O'Hern for developing a graphene transfer process to polycarbonate membranes and constantly sharing his findings related to the development of similar membranes for liquid-phase separation applications; Doojoon Jang also for sharing results on liquid-phase separation with graphene membranes and in particular for experiments he performed to determine the pore size distribution created by oxygen plasma etching; Piran R. Kidambi for his work tailoring graphene synthesis to membrane applications and providing me with a constant supply of graphene; Luda Wang for sharing insights gained from single pore and high pressure experiments with graphene membranes and his generosity in sharing equipment; Tarun Jain for constantly sharing ideas on graphene membranes and beyond; Suman Bose for his work developing an interfacial polymerization process for graphene membranes; and Jongho Lee for helpful discussions on transport phenomena and sharing his experience with anodic aluminum oxide membranes.
I would also like to thank the membranes of Prof. Hadjiconstantinou's lab for their support. I am particularly appreciative of the work by Harold Au and Chengzhen Sun exploring gas
transport through graphene membranes by means of molecular simulation, which has contributed to gas transport models presented here.
Prof. William J. Koros at the Georgia Institute of Technology provided helpful recommendations for membrane sealing during gas permeance measurements.
Scanning transmission electron microscopy was conducted by Juan-Carlos Idrobo, Sean C. O'Hem, and Doojoon Jang at Oak Ridge National Laboratory's (ORNL) Center for Nanophase Materials Sciences, which is a DOE Office of Science User Facility.
This work was performed in part at the Center for Nanoscale Systems (CNS), a member of the National Nanotechnology Coordinated Infrastructure Network (NNCI), which is supported by the National Science Foundation under NSF award no. 1541959. CNS is part of Harvard University.
This work made use of the MRSEC Shared Experimental Facilities at MIT, supported by the National Science Foundation under award number DMR-1419807.
Financial support for this work was provided by the US Department of Energy, Office of Basic Energy Sciences under award no. DE-SC0008059; the MIT Energy Initiative Seed Fund; and the Natural Sciences and Engineering Research Council of Canada Doctoral Postgraduate Scholarship Program.
Table of Contents
1 INTRODUCTION 11
1.1 Gas transport in membranes 14
1.2 Membrane materials and structures 15
1.3 Graphene membranes 19
1.4 Thesis aims 21
2 GRAPHENE MEMBRANE BACKGROUND 23
2.1 Theoretical gas transport work 23
2.1.1 Theoretical predictions 27
2.1.2 Transport pathways 28
2.2 Experimental gas transport work 31
2.3 Modeling gas transport in nanoporous graphene 34
2.3.1 Steric regime model 34
2.3.2 Activated regime model 36
2.3.3 Combined model 38
2.4 Defects 39
2.5 Nanopore creation methods 39
2.6 Graphene's potential 42
3 INHERENT PERMEANCE OF GRAPHENE 45
3.1 Gas permeance measurements 46
3.2 Membrane synthesis 47
3.3 Characterizing membrane structure 50
3.4 Inherent permeance of graphene 51
3.5 Conclusions 52
4 GRAPHENE PERMEANCE MODELING 53
4.1 Resistance model 53
4.1.1 Average intrinsic defect spacing 57
4.1.2 Resistance model weighting factors 61
4.1.3 Intrinsic defect permeance 61
4.1.4 Selective nanopore penneance 62
4.2 Model agreement with measurements 62
4.3 Further model validation 64
4.3.1 Model comparison 70
4.4 Contribution of interlayer transport 74 4.4.1 Interlayer flux resistance model 74
4.4.2 Interlayer diffusion model 77
4.5 Conclusions 81
5 DEFECT TOLERANT MEMBRANE DESIGN 83
5.1 Feasibility of selectivity with defective graphene 84
5.2 Simplified single-layer graphene membrane model 88
5.3 Model insights into graphene membrane operation 92
5.4 Support membrane selection 96
5.5 Defect tolerant membrane development 98
5.6 Conclusions 99
6 DEFECT DENSITY REDUCTION 101
6.1 Graphene quality 101
6.1.1 Graphene selection 105
6.1.2 Graphene synthesis methods 106
6.2 Multi-layer graphene 106
6.3 Intrinsic defect sealing 108
6.3.2 ALD formation on graphene 110
6.3.3 ALD effectiveness 113
6.4 Tear sealing 114
6.4.1 Interfacial polymerization 115
6.4.2 Ammonium chloride precipitation 120
6.5 Conclusions 123
7 SUPPORT MEMBRANE TUNING 125
7.1 Support membrane resistance tuning 125
7.2 Small pore diameter commercial supports 129
7.2.1 Small pore diameter PCTEM graphene transfers 131
7.2.2 Small pore diameter PCTEM resistance 134
7.2.3 Other small pore diameter membranes 137
7.3 Support membrane modification attempts 137
7.3.1 Laminate support membranes 138
7.3.2 Particle filled or coated support membranes 139
7.4 Dense, permeable polymer film 140
7.4.1 Polymer film resistance model 142
7.4.2 Polymer film coating over graphene 144 7.4.3 Polymer film coating over multi-layer graphene 146
7.4.4 Polymer film structure 147
7.4.5 Graphene transfer to a dense, permeable polymer film 148
7.5 Isotropic pore AAOs 149
7.5.1 AAO polishing 150
7.5.2 Graphene transfer to AAO 152
7.6 Conclusions 154
8 SELECTIVE NANOPORE CREATION 157
8.1 Ion bombardment 157
8.1.1 Ion bombardment methodology 157
8.1.2 Graphene damage due to ion bombardment 160
8.1.3 Selectivity of bombarded three-layer graphene 160
8.2 Potassium permanganate etching 163
8.2.1 Estimated nanopore selectivity by KMnO4 etching 163
8.2.2 Methodology for pore creation by KMnO4 etching 165
8.2.3 Gas permeance measurements on KMnO4 etched membranes 165
8.3 UV ozone etching 166
8.4 Oxygen plasma etching 167
8.4.1 Pore creation and enlargement by oxygen plasma etching 168
8.4.2 Estimated nanopore selectivity by oxygen plasma etching 169
8.4.3 Performance of sealed graphene membranes 171
8.4.4 Selectivity of plasma etched graphene on AAOs 172
8.5 Further development 188
8.6 Conclusions 196
9 CONCLUSION 197
9.1 Summary 197
9.2 Recommendations and future work 200
9.3 Perspective 203
APPENDIX A COMPILING GRAPHENE GAS TRANSPORT DATA 207
A.1 Extraction of pore area (simulations) 207
A.2 Extraction of pore area (experiments) 208
A.3 Pore permeance 208
A.4 Pressure estimation 209
APPENDIX B GAS PERMEANCE MEASUREMENT METHODS 211
B.1 Measurements of graphene on PCTEMs 212
B.2 Measurements of graphene on AAOs 214
B.3 Measurement system verification 215
APPENDIX C EXPERIMENTAL UNCERTAINTY ESTIMATES 217
Chapter 1
Introduction
Separating the components of a gas mixture is an important step in several industrial
processes."2 Natural gas is purified prior to distribution to enhance quality, improve safety, and
increase revenue. This involves the removal of carbon dioxide (C02), nitrogen (N2), hydrogen
sulfide (H2S), water vapor (H20), and heavier hydrocarbons from methane (CH4). The production
of ammonia for fertilizer and some oil refinement processes require H2. This is commonly
produced by stream reformation of CH4. H2 is separated from carbon monoxide (CO) in the
resulting syngas. H2 recovery from light hydrocarbons, Ar, and N2 are other gas separation
processes that can improve efficiency in oil refinement and ammonia production. N2 is often
employed in applications where a dry inert gas is required, such as food storage, high temperature
manufacturing, and fire safety systems. It is produced by separation from air. Oxygen (02) / air
separation is also important for oxy-combustion in high thrust propulsion, welding, and high
temperature furnaces used for glass production. Carbon capture systems for reducing the
environmental impact of industrial processes require CO2 / N2 separation. Organic vapor
Gas separation is accomplished by sorption, distillation, or membrane processes.3 Sorption
based systems use a sorbent material that can accumulate a large volume of one gas species to
remove it from a mixed gas stream. Activated carbon and zeolites are examples of solid sorbents
that have very high surface area for gas adsorption. The primary means of removing CO2 and H2S
from natural gas is absorption into liquid amines.2 These processes require regeneration of the
sorbent, which is energy intensive.
Distillation systems separate mixtures based on differences in the boiling points of the
constituent gases.3 Heating and cooling the mixture is also energy intensive; distillation columns
for separating hydrocarbons use 40-60% of the total energy consumed by oil refineries.2
Membranes separate gases using a material that is selectively permeable to certain
components of the mixture.3 These systems have low energy costs compared to sorption and
distillation methods. However, there is an inherent trade-off between the permeance and
selectivity4'5 of conventional membranes operating by a solution-diffusion mechanism that has
traditionally limited gas separation membranes to systems requiring relatively low production rates
or to mixtures with high impurity concentrations in the feed gas.' 3 Box 1-1 summarizes important
terms related to gas separation membranes.
Membranes have found use primarily in N2 / air, C02 / natural gas, H2 / Ar, H2 / N2, and
H2 / CH4 separations.1,2 Increasing the share of membrane technology in the gas separation market
requires further improvements in permeance to meet the production needs of industrial
processes."2 For example, existing membranes for C02 / N
2 separation have selectivities of 30 to
60, sufficient for carbon capture, but the achievable permeances are prohibitively low for this
application. Novel membrane materials have the greatest potential to produce the significant
Box 1-1. Membrane gas transport definitions, key equations, and length scales. Definitions of transport properties
Permeance:
Q
= i/Am AP [mol m-2 s-1 Pa'; GPU], where ft [mol S-1] is the netmass/volume/molar flow rate across area Am [in2
] of the membrane. Gas permeance is
often reported in gas permeation units (GPU) instead of SI units, where 1 GPU
3.35 x 10⁻¹⁰ mol m-2 s-' Pa-' (Ref. 21).
Selectivity: S E QA/QB, where QA and QB are the membrane permeances of species A and B, respectively (flow rates of one species may be influenced by another).
Pore permeation coefficient: Fl = A/AP [mol s- Pa'], where AP [Pa] is the pressure
difference (or more generally, any driving force) across the pore.
Pore effective area: Aeff = Hl/Jideal gas [iM2
], where JiAdeal gas [mol m-2 s1 Pa'] is the ideal gas flux.
Relevant parameters3 0
Ideal gas mean free: A = kBT/V2irdP [m] where kB [J/K] is Boltzmann's constant, T [K] is the absolute temperature, d9 [in] is the gas molecule diameter, and P [Pa] is
the pressure.
Knudsen number: Kn = A/d, where d [m] is the support pore diameter.
Transport eguations130
Ideal gas flux: Jideal gas = AP/ 2nMRT [mol m-2 s-], where M [kg mol-] is the
molecular weight of the gas and R [J mol- K-'] is the universal gas constant. A =
JiAdeal gasTd 2/4 [mol s-].
Knudsen diffusion: A = ird3 AP/3L 27TMRT [mol s-], where L [m] is the pore
length.
Poiseuille flow: A = (wd4/128pL)AP(P/RT) [mol s1] where It [Pa s] is the dynamic viscosity and P [Pa] is the average of the upstream and downstream pressure.
Fickian diffusion: ft = K7Td 2 P/4L RT [mol s-], where D [M2 s-] is the diffusion
coefficient.
Length Scales
Graphene: Carbon van der Waals diameter: 2Rdw = 3.4 A. Carbon bond length in graphene: a = 1.42 A. Area of a hexagonal ring in graphene: A, = 5.24 A2.
Pore geometry: D, is pore diameter defined by centers of edge atoms. D DC
-Dvdw /V is the pore diameter used for gas transport.
Gases (kinetic diameter [A], molecular weight [g/mol]): He (2.6, 4.00), H20 (2.65,
18.02), Ne (2.75, 20.18), H2 (2.89, 2.02), NO (3.17, 30.0 1), CO2 (3.3, 44.01), Ar (3.4,
39.948), 02 (3.46, 32.00), H2S (3.6, 34.08), SO2 (3.6, 64.07), Kr (3.6, 83.80), N2 (3.64,
While developing these novel membranes, it is important to consider their scalability from the
laboratory to industrial systems. Industrial gas separation plants typically use membranes that have
areas of 1000 to 500,000 m2
, last for 3 to 5 years, and cost less than 50 USD/m 2
.2
1.1
Gas
transport in membranes
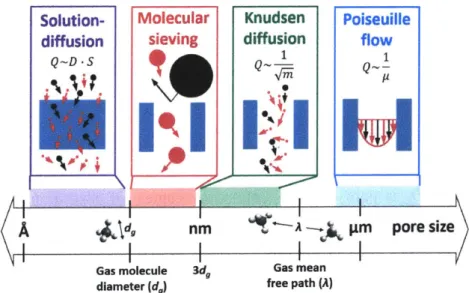
Gas separation membranes are generally classified as dense or porous. Dense membranes
operate by a solution-diffusion mechanism6 in which bulk gas on the high pressure side is dissolved
into the membrane, diffuses through the material, and emerges on the low pressure side
(Fig. 1-1). 2,4,5,7-11 Selectivity results from differences in gas solubility (s) and diffusivity (K) in the
membrane (QA/QB KA/KB) (SA/SB), where subscripts A and B correspond to different gases).
Porous membranes have defined passages throughout the membrane.3 These include
membranes with pores patterned into the material as well as inherently porous structures. When
the pore diameter is smaller than approximately three times the kinetic diameters of the gas
molecules, gas transport is in the molecular sieving regime.4 The pores are sufficiently small that
Solution- Molecular Knudsen Poiseuille
diffusion sieving diffusion flow
Q~D-S 1 1
(A
ld,
nm A m pore sizeGas molecule 3dg Gas mean diameter (d) free path (A)
Figure 1-1. Simple membrane gas transport regimes. Here, Q is permeance, D is diffusivity, S is solubility, m is molecular mass, and p is viscosity.
the flow of larger gas molecules is strongly impeded compared to smaller gas molecules, due to
size restriction, resulting in high selectivity.
For membranes with pores larger than a few kinetic diameters but still much smaller than the mean free path in the gas, gas flow is in the Knudsen diffusion regime.4,12 Both the smaller and
larger gas molecules are all able to flow in the membrane pores at high rates. Lighter molecules
have higher permeances since they move at higher average speeds than heavier molecules
(QA/QB ~ MB
MA)-As the pore size is increased further towards the micron-scale, the transport mechanism
transitions from Knudsen diffusion to Poiseuille flow.13 In this limit, transport rates are dominated
by viscosity. Single species permeance measurements are inversely proportional to viscosity
(QAIQB- Y
BIPA)-In general, since the rate of diffusion is inversely proportional to a characteristic membrane
thickness, thin active layers are desirable.
1.2 Membrane materials and structures
Currently, all commercial gas separation membranes are polymeric solution-diffusion
membranes, made from materials such as polyimide, cellulose acetate, and polysulfone.2 In these, diffusivity is related to the material structure;47"10"1 4 more tightly packed or highly cross-linked
molecules tend to provide greater restriction to gas molecule motion in the material. Since the diffusivities of all gas species are affected by the material structure, choosing a more permeable material typically produces lower selectivity.45 This leads to an observed upper bound in the
membrane permeance-selectivity relation (Fig. 1-2). This bound has been quantified for several
mixed matrix structures can further enhance the performance of membranes above this
limit.4'8"' 15-17
Dense metallic membranes, often made from palladium alloys, are an extreme case of
solution-diffusion membranes in which the tight crystal lattice makes it more favorable for
hydrogen to dissociate before dissolving and diffusing through the membrane. 5 This results in low
permeance but high selectivity.
Porous molecular sieving membranes include carbon molecular sieves (CMSs), inorganic
molecular sieves such as zeolites and metal organic frameworks (MOFs), and very high free
volume polymers.18"19 Zeolites are nanoporous aluminosilicate minerals, which have a crystal
structure with well-defined pores resulting in high surface area. MOFs have similar nanoporous
structures created by coordination bonding between organic molecules and metal ions or clusters.
CMSs are made by carbonization of MOFs or zeolites. It should be noted that "CMS" is also
sometimes used to describe ultra-microporous carbon used for gas adsorption; this material is
formed by pyrolysis of carbon precursors and has larger pores and very high surface area. Zeolites,
10Q5 104
graphene
N
potential
"103 0 102a0
l00 W 101 F CO 0polymer
100 f -J 10-8 10-8 10-4 10-2H
2Permeance
[mol/m
2-s-Pa]
Figure 1-2. Polymer membrane performance compared to the predicted performance of graphene. Polymer membrane data from Ref. 4. Graphene potential based on Refs. 33,59.
MOFs, and CMSs have highly structured pores (Fig. 1-3). In contrast, very high free volume
polymers, such as PTMSP (poly[ 1 -(trimethylsilyl)- 1 -propyne]), have unstructured pores, still with
a size similar to gas molecule diameters.4,8,9,15,20-22 Surface diffusion of adsorbed molecules within
the pores of molecular sieves can be significant and selectivity can result from differences in
adsorption affinities.41,
Membranes with patterned pores larger than 5 nm are also available for particle filtration. These include polymer track etched membranes (PCTEM)23 and anodic aluminum oxide (AAO) membranes.2 4 Knudsen selectivity is possible at the smaller end of the pore size range available
for these membranes.
panC Gra ene Oi A -disordered 3,gsnIc Framework & Zeoite Carbon no
Structure
Figure 1-3. Membrane structure-thickness map. Image sources: polymer solution-diffusion membranes (reprinted from Ref. 131, with permission from Elsevier); carbon molecular sieves (reproduced in part from Ref.
132 with permission of The Royal Society of Chemistry); carbon nanotube (from Ref. 25, reprinted with permission from the American Association for the Advancement of Science); anodic alumina (from Ref. 133
0 IOP Publishing. Reproduced with permission. All rights reserved); graphene oxide (from Ref. 134, reprinted
with permission from the American Association for the Advancement of Science); metal organic framework & zeolite (reproduced from Ref. 135 with permission of The Royal Society of Chemistry); carbon nanomembrane (Reprinted with permission from Ref. 136. Copyright 2013 American Chemical Society); and graphene (reprinted
by permission from Macmillan Publishers Ltd: Ref. 137, copyright 2012).
1 pm 100 nm-10 nm -U' U) S E U I' hm S S U S C,) I mw 1 ordered
Other novel carbon-based membrane structures are currently being researched. These
include carbon nanotube membranes (CNT),25-27 graphene oxide (GO) membranes, 28,29 carbon
nanomembranes (CNMs),3 0 and graphene membranes.31-34 The motivation behind such
membranes is the potential to produce precisely controllable pore structures, so that selectivity can
be maintained, in ultra-thin membranes, resulting in high permeance (Fig. 1-3).
CNTs are hollow cylinders of carbon that can be arrayed in parallel in a material such as
epoxy to form a CNT membrane.25-2 7 Micron-scale membrane thicknesses with CNT diameters as
small as 2 nm can be achieved. These membranes have high gas permeance and well defined pores.
Graphene oxide flakes are two dimensional, micron-scale structures containing carbon, oxygen, and hydrogen.2 8
,29 These flakes can be assembled into a membrane by vacuum filtration or spin coating, with thickness ranging from less than 2 nm to microns. The primary gas transport
pathway through these membranes is believed to be interlayer transport between GO flakes.2 8
Selectivity can result from differences in adsorption affinity within these spaces, possibly resulting
from gas molecule interactions with epoxy, hydroxyl, or carboxyl groups on the GO flakes. These
membranes show strong interaction with C02. GO membranes have been prepared that selectively
reject C02, with H2 / CO2 selectivities of 3400.29 GO membranes have also been prepared that selectively permeate C02.29
CNMs are prepared by electron-radiation-induced cross-linking of self-assembled
monolayers.30 This forms periodic structures with well-defined pores in layers as thin as 1 nm.
Creating pores small enough for molecular sieving of gas molecules in these membranes remains
1.3 Graphene membranes
Graphene, single atom thick carbon arranged in a two dimensional sheet, is a potential
membrane material at the ultimate limit of thinness (Fig. 1-3). Graphene is impermeable to gases
in its pristine state,31 can support sub-nanometer pores for molecular sieving,3 2
,3 3 and will pose
minimal resistance to gas flow by virtue of its atomic thickness.3 2
,3 3 This gives nanoporous
graphene the potential to surpass current membrane permeance and selectivity limits.31,3 2
The state-of-the-art in graphene membranes for gas separation is reviewed in Ch. 2. The
most significant accomplishments to date are (1) the experimental demonstration by Koenig et al.34
of molecular sieving through a single nanopore in mechanically exfoliated two-layer graphene,
with H2 / CH4 selectivity exceeding 104 , and (2) achieving near Knudsen selectivity with high
permeance through a membrane with 106 patterned 7.6 nm pores in two-layer graphene by Celebi
et al.12 However, fabricating graphene membranes for gas separation applications will require a
larger array of sub-nanometer pores to simultaneously achieve high permeance and high
selectivity. Accomplishing this requires overcoming two main challenges: material defects and
nanopore size variation.
Large areas of graphene are known to contain defects in the nanometer size range
(Fig. 1-4).35 Because graphene is atomically thin, these defects can create non-selective leakage
pathways for gas molecules. These defects can compromise membrane performance, and therefore
need to be addressed.
While single pores in the molecular sieving size range can be produced,34 and arrays of
sieving size range. The pore size distribution will determine the gas pairs that can be separated and
the overall selectivity. The pore density will determine membrane permeance.
Ii
Figure 1-4. Intrinsic defects in large area CVD graphene (scanning electron microscope images reprinted with permission from Ref. 35. Copyright 2012 American Chemical Society).
1.4 Thesis aims
The overall objective of this research is to develop macroscopic graphene membranes for gas separation. Towards this goal, this thesis focuses on the following aims:
Aim 1. Investigate gas transport through intrinsic defects in single-layer and multi-layer
graphene membranes;
Aim 2. Develop graphene membrane permeance models and apply them to delineate the
parameter space for the design of selectively permeable membranes; and
Aim 3. Fabricate defect-tolerant nanoporous graphene membranes and demonstrate
high-flux gas separation.
Background and prior work on graphene membranes for gas separation is detailed in Ch. 2.
The inherent permeance of single and multi-layer graphene is investigated in Ch. 3 (aim 1). A
model for gas transport through macroscopic areas of graphene is developed and applied to
selective membrane design in Ch. 4 and 5 (aim 2). Membrane fabrication methods to achieve selective transport are developed in Ch. 6-8 (aim 3). Membrane performance is also
Chapter 2
Graphene membrane background
Bunch et al.31 experimentally demonstrated the impermeability of single-layer graphene to gases including helium. In their experiment, the change in deflection of pristine mechanically
exfoliated graphene suspended over a pressurized silica microcavity was measured to determine
the leakage rate (Fig. 2-1 a,b). They showed that the measured leakage could be accounted for by
diffusion through the silica substrate, with negligible contribution coming from flow between the
graphene and substrate or due to quantum tunneling through the graphene lattice. The
impermeability of pristine graphene in combination with the atomic thickness of the material led
Bunch et al.3' to propose graphene as a membrane material. Subsequent simulations quantified the
potentially high permeance and selectivity by molecular sieving through graphene.36-38
2.1 Theoretical gas transport work
A large number of simulations have since been performed, predicting the gas permeance
d0
Figure 2-1. Illustrations of some graphene membrane gas transport work. a, Diagram of experimental setup of Bunch et al.3' showing graphene on a silica microcavity. b, Atomic force microscope image of graphene nanoballoon of Bunch et al.31 retaining gas (a,b, reprinted with permission from Ref. 31. Copyright 2008 American Chemical Society). c, Visualization from simulations of Tao et al.40 of a pore in PG-ES1 (Porous Graphene-E-Stilbene-1) along with H2, N2, CO, and CH4 molecules. H, C, N, and 0 atoms are shown in white, gray, blue, and
red, respectively, and the 0.02 A3 electron density isosurface is shown in yellow (reprinted with permission from
Ref. 40. Copyright 2013 American Chemical Society). d, Snapshot of molecular dynamics simulation of H2 / CH4
separation (Reprinted with permission from Ref. 70. Copyright 2013 American Chemical Society).
used to compute gas permeance and selectivity of graphene nanopores: (1) the energy barrier
method and (2) molecular dynamics simulations.
In the first approach, the energy barrier to crossing the pore is calculated for the gas
molecules of interest (Fig. 2-2, 2-1c) and used in an Arrhenius rate law to estimate selectivity,
32,37-56
e E1/kBT (2-1)
e -E2/kBT
where S is the selectivity, kB is Boltzmann's constant, T is the temperature, and E1 and E2 are the
energy barriers for the two molecules to cross the pore. In some studies, permeation rates are also
estimated from the energy barrier3 2
,
38
,
3 9,48,50,5 2,56 following the method of Schrier.38 In this method,
the transmission probability is calculated as the fraction of incident gas molecules with
Maxwell-Boltzmann velocity distribution that have sufficient velocity normal to the pore to overcome the
energy barrier. The single component Maxwell-Boltzmann velocity distribution is
m
f (v,) = e-u uT(2-2)
where f(v,) is the probability that a molecule has x-component of velocity, vo. The fraction of molecules with speed greater than Vx,min = 2E/m is therefore,38
e-'e /2kBT dv, = -erfc ( (2-3)
Jideal gas Vx,min 2irkBT 2 kBT
where E is the energy barrier (for E/kBT >> 1, J/Jideal gas ~V kBT/WE e-E/kBT
Note that Eq. 2-1 and 2-3 give only order of magnitude approximations for permeance and selectivity from calculated energy barriers. The details of transport are not simulated in either
calculation. Notice also that the selectivity from Eq. 2-3 for E/kBT 1 is S =
J1/12 ~ dm2E2/m1 E1 e -E/kBT -E2/kBT .Comparing to Eq. 2-1, it is apparent that the order one
pre-factor to the exponential terms is neglected. Since both Eq. 2-1 and 2-3 neglect the details of gas transport, and reported selectivities are often very large (S >> 1), neglecting such factors is reasonable. C 0.5 E 0 H2 Z -0.5 N2 -1 -1.5 .!-2-b -2.5 0 -15 -10 -5 0 5 10 15 Z-Zgraphene[A]
Figure 2-2. Example of a potential energy profile across a graphene nanopore. a, Definition of z-axis, which molecule traverses. b, Selected pore geometry. c, Corresponding potential energy profiles for hydrogen and nitrogen computed using a Lennard Jones potential.
Density functional theory (DFT) is commonly used to calculate the energy barrier,3 2,3 7,4 2
-56 although, some studies use a post-Hartree-Fock method.38,39 Most often, the position and
orientation of the gas molecules are constrained in calculating the energy profile and barrier
heights, however, some studies perform more involved transition state searches.38,39,485 0, ,52,56
In the second approach, the gas dynamics are simulated to calculate the number of
molecules crossing the nanopore per unit time (Fig. 2-1d, 2-3).32,36,40,41,44,46,57-73 Selectivities are
then calculated as the ratio of computed permeances. Classical molecular dynamics (MD) is used
almost exclusively for this approach, although first principles molecular dynamics results have
also been reported.32
Due to restrictions on the total simulated time, MD has been limited to predicting
selectivities of less than 100 to 1000,32,36,40,41,44,46,57-73 with the high end achievable only at elevated pressures. Often, no molecule crossings are observed if the nanopores are more selective than this.
He H2 CO2 Ar N2 CH4 SF6
c10
So measurement, 34A cut-offpore
0 measurement, 4.9 A cut-off pore
[
10 MD zero permeability uncertaintyMD prediction, 6 atom hole
E0 MD prediction, 10 atom hole
10 22 MD prediction, 16 atom hole
CL
2 10-24
0
a 6 atom 1o atom 16 atom
3.1 A 5.o A 6. A
3.0 4.0 5.0 6.0
Kinetic diameter [A]
Figure 2-3. Comparison of single pore transport measurements by Koenig et al.33 to molecular dynamics simulation results of Au"9 for various pore sizes. Shaded regions show estimated uncertainty in molecular dynamics simulation results. Measurements are shown for pores with estimated molecular size cut-offs of 3.4 and 4.9 A. Simulated pore geometries also shown (reproduced from Ref. 59).
DFT predictions of selectivity of up to 1078 has been reported.3 2,37-16 However, the precise
permeance and selectivity, which would include prefactors to the Arrhenius rate law for different
gases, are not obtained by DFT calculations. For these reasons, it is common to use DFT to estimate
selectivity and MD to estimate permeance.32,40,4 1,44,46,72,73
The majority of simulations fix the two-dimensional lattice when computing the energy barrier or simulating the molecular dynamics. However, some studies have allowed for lattice
deformations.37,59,67,70-72 In DFT calculations, lattice deformation due to the presence of a gas
molecule has been accounted for by re-optimizing the in-plane lattice structure when traversing a gas molecule across the pore to obtain potential energy profiles.37 In molecular dynamics
simulations, the AIREBO (Adaptive Intermolecular Reactive Empirical Bond Order) potential has sometimes been used, allowing for deformation and thermal fluctuations in the graphene lattice. 9,67,707 2 By both methods, comparisons with the corresponding results for a fixed lattice
indicate that neglecting lattice motion can yield selectivities that are several orders of magnitude too high.7 72
2.1.1 Theoretical predictions
Simulations have been performed on nanopores with diameters up to 11
A,
32,375632,36,40,41,44,46,57-73 with various pore edge groups (C4 2,4 3,5 1,55,57-59,62,66,68,70,72,73,
H32,36-41,44-46,48,49,52-56,60,63,65,67-71,73, N32
,36,3 7,41,48,49,52,63,65,68,71, F52,7 3
, 041,52) and on a variety of gas species (CH4 32,3 7,38,40,43-46,50,5,53-55,57,59,60,62,63,66,67,70-72 Co 23741',45,46,50,53-56,63,65-68,71,73, H232,36,37,40,43-45,47,50,51,53-60,63,70,72, N237,40,41,43,46,50,55,56,58,63,65-68,70-73, CO 40,4 3 ,45,50,51,53-57,73, H2S62,71, 0237,46,55,56,66,67, NH356, H20 45,50, SO273, Ar4 546'56'63, SF659'6 6, Ne38,46,56, alkanes69, 3He38,3 9,4 8,4 9,52, 4He3 8 ,3 9,46,4 8,49,52,55,56,59,70, 2 35UF
639 2 3 8UF639, D247, Kr46, Xe46, Rn46, and various atomic species4 2).
simulations have also been performed for various other two-dimensional materials with nanopores
suitable for molecular sieving, including porous graphene with various
modifications, 38,40,46,47,54,60,67,69 graphdiyne,4 35 15 7 graphyne,43 polypheneylene,395,3,7 4 porphyrin,4 1
silicene,50 and hexagonal boron nitride.4 4 This general class of membranes will be referred to as
nanoporous atomically thin membranes (NATMs). Figure 2-4 summarizes all of the available
simulation data on gas transport through nanopores in atomically thin materials.3 2,36-3 8,40,41,4 3-46,48
-60,62,63,65,67-73 Appendix A details how these data were complied.
For the majority (-75%) of simulated pores the permeation coefficient of the most permeable molecule is in the range 10-23-10-19 mol/s-Pa. For a pore density of 1012 cm-2, this
corresponds to a membrane permeance of 10-7-10-3 mol/m2-s-Pa (I02-106 GPU). However, some simulations involve pore densities of up to 8.5x 1014 cm2, resulting in permeances of up to
10-1 mol/m2-s-Pa (108 GPU).
2.1.2 Transport pathways
Simulations have provided insights into the gas transport pathways across graphene
nanopores.7576 Several separation mechanisms have been reported. Specifically, selectivities are
affected by differences in molecule size,36,55,57-60,62
,63
,65-7 3,75,76 mass,70 adsorption affinity,45
,58,66
-70,72,74,76,77 with functional on the 32,37,40,41,44-47,49,52,54,62,63,65,67,68,71,73,74
interaction wtfucinlgroups ontepore rim,
configurational entropy,6 9 and tunneling rates. 38,39,42,4749,52 These are described below.
Size-sieving occurs when the effective pore size significantly limits the permeance of the
larger molecules compared to the smaller molecules.36,55,57-60,62,63,65-73,75,76 Compared to typical
kinetic energies of the gas molecule, the barrier height for smaller molecules is low whereas that
a
10 0
-20 (U 0 WU l-40 0 -01060
U e0-80 m10
1021040
A -A & AI& 112 00 10 ' . e T 2 A 10.--4 . - U100-1
-6 V 3 + 0 2-2
0
2
4
D - Dm [A
1O10
0dAeffIAO
Figure 2-4. Predicted and measured performance of graphene nanopores.3 2,36-38,40,41,4 3-46,48-60,62,63,65,67-73 a, Effective pore area (Box 1-1). b, Selectivity. Details on transport regime models are presented in Section 2.3. The procedure for extracting simulation and experimental data to construct these plots is detailed in Appendix A.
b
Mod-s
<- V A 4 W 4hAi
A4 + e IW 101U10
-.10
Experiments x Koenig et al. (2012) + Wang et al. (2015) .*. . . .* Celebi et al. (2014) a' aSimulations
0 Au (2012)' Cranford & Buehler (2012) * Du et al. (2011)
A Huang et al. (2014) 4 Leietal. (2014) V Liu tal. (2015
* Liu et al. 2013a)
- Activated model * Liu et al. (2013b)
- Steic model I Qin et al. (2013)
MD 4 Schrier ( 2)
ab initio y Shan et al. (2012)
ab Initlo / MD 0 Solvik (201
Measured a Sun et al. 014
Measured upper * Sun et al. 201
bound A Wen et al. 2015)
4s8 Wu et al. (2014)
4 6 8 4 Ambrosetti & Slvestrelli (2014)
y Blankenburg et al. (2010)
6
8
10
o Brockway & Schrier (2013)A Hauser et al. (2012)
]4
Hauser & Schwerdtfeger (2012a)4 Hauser & Schwerdtfeger (2012b)
y Hu et al. (2013)
el (H2 CH4) 4) o a Jiao et al. (2011)Jiang et al. (2009)
toei / stoe .alatha et al. (2015)
teric / activated A Li et al. (2010
ctivated / activated t. Lu et al. (201 )
o Schrer (2010)
Gas pairs * Tao et al. (204) @ H2/CH4 A Tian et al. (2015) S C02 / CH4 4 Zhang et a. (2012) * C02/N 2 V Zhang et al. (2015) a N2 / CH4 , o H2/CO a 02/N2 a H2 / N2 * He /N2 * He/ CH4 A H2/C0 2 a He / CO2
1
-F5
Partial charges on functional groups on the nanopore edge can also interact with the gas
molecules, affecting permeance. 32,36-41,4347,49,51-54,56,57,60,62,63,65,67,68,71,73,74 These interactions have
been found to be particularly important in the transport of molecules with polar bonds.65 67,68 Differences in molecule mass give rise to separation because lighter molecules move at
higher average speeds than heavier molecules, resulting in a higher flux of the lighter molecules
across the nanopore. Mass differences result in selectivity even for nanopores too large for
size-sieving.70
In addition to molecules approaching the nanopores from the bulk gas, molecules also tend
to adsorb on graphene and diffuse in two-dimensions towards the pore (Fig. 2-5c).45,58,66-70,7 2,7 4,76,7 7
This can increase the rate of attempted molecule crossings, enhancing permeance. The significant
absorption of gas molecules on graphene is illustrated in Fig. 2-6, in which the molecular dynamics
simulation results of Au59 have been processed to show adsorption layers on a graphene membrane.
Simulations show that permeance is enhanced in the order SO274 > C0267
,68,74 > CH467
,70
,74 >
H2074
> N258,67,68,70,7 2,74 & 026 7'7 4 > H258,70,72 > He70, and H2S74 > CH4, and paraffins > olefins69. It has
further been suggested that molecules in a mixture with higher adsorption affinity will tend to
displace other molecules from the surface, reducing that gas's permeance.7 2
For long hydrocarbon chains, it has been shown that separation can result from differences
in configurational entropy in the vicinity of the pore.69 This can result in selective transport of
shorter hydrocarbon molecules compared to longer ones69
At low temperatures, where the energy barrier is very high compared to typical kinetic
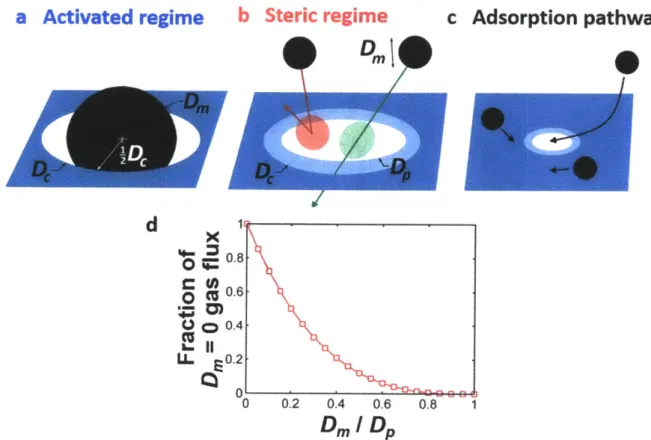
a Activated regime
b Steric regime
C Dmc Adsorption pathway
d
0 C 0 C9) LLx
S0.8 CU 0.6 0) o 0.4 0. 0.2 0 0.2 0.4 0.6 0.8 1Dm
IDp
Figure 2-5. Prevalent transport mechanisms through graphene nanopores. Illustration of the a, activated and
b, steric transport regimes as well as of the c, adsorption pathway. d, Steric regime calculation of the fraction of
ideal gas flux permeating the pore for a given ratio of molecule to pore diameter. The data were generated from Monte Carlo simulations discussed in Section 2.3.1. The equation for ideal gas effusion through an area accounts for the rate of incidence of the center of mass of gas molecules on that area. However, for small pore areas, the non-zero size of the gas molecule colliding with the pore rim reduces the flux of molecules through the pore. The fraction of the incident flux on area irDp/4 that passes through the pore is plotted against molecule size in this
panel. Plot shows simulation results (markers) and an interpolating curve.
significantly higher than classical permeation rates.3 9,42,47-49,5 2 This has been proposed as a method
of separating helium isotopes.48
2.2
Experimental
gas
transport work
Koenig et al.33
successfully demonstrated molecular-sieving through graphene nanopores. They created nanopores in bi-layer graphene suspended over microcavities by ultraviolet induced oxidative etching. They measured gas permeance based on changes in membrane deflection or
a Reflective Wall b 15 C 15
Condition * -aH2 -a- H2
0a CH4 - CH4 Periodic A 10 10 Boundaries . Initially I atm ,,' -5 I 5 Partial Pressures of 4 H2 and CH4 0 0 --- - --- 0---Domain Size P 3 x 3 x 900 nm o - 5 One Fixed
-Carbon Atom c -10 -10Initially Vacuum 10 atom 16 atom
-15 '-15
0 1 2 3 4 5 6 0 1 2 3 4 5 6
Reflective Wall Average Molecules Average Molecules
Condition
Figure 2-6. Adsorption of gas molecules, obtained from the molecular dynamics simulations of Au59. a, Simulation domain of Au5 9. b,c, Number of adsorbed molecules within 1 A horizontal slices of the total 1600 molecules per gas species divided between 16 replicate simulations. Pore geometry inset (pore geometry images reproduced from Ref. 59).
resonant frequency over the pressurized cavity. The permeance of H2 and CO2 increased by two
orders of magnitude after etching while the permeance of the larger Ar, N2, and CH4 molecules
was unchanged, demonstrating molecular-sieving with a pore size of approximately 3.4 A
(Fig. 2-7a). The maximum permeances they report were in the range 5x 10-23 to 10-21 mol/s-Pa, with selectivities of greater than 104. On similarly fabricated single-layer porous graphene membranes, Wang et al.78 report gas permeance in the range 10-23 to 10-22 mol/s-Pa. Predictions from simulations are consistent with these measurements (Fig. 2-3, 2-4).
Wang et al.78 further observed unexpectedly high permeances of C02 and N20 compared to He, Ne, H2, and Ar. They attributed this to interactions between functional groups on the pore edge and polar groups, which have been found to significantly affect transport rates for such gas molecules in simulations.6 56,7,68 In this system, Wang et al.7 8 discovered stochastic switching
S10-22 0 E 0 0 ""U 0 10 2 3 10Q-24 10-25 10-26 4 l27 2.8 3.0 3.2 3.4 3.6 3.8 4.0
Kinetic diameter
[A]
U
C', 5 4 3 2 . ... . 0 H2 Co 2 Ar N2 CH4 - -Pristine -q- Etched bFigure 2-7. Summary of experimental gas transport through graphene pores. a, Experimental demonstration of
molecular sieving through a graphene nanopore by Koenig et al.3
Insets depict experimental setup: graphene over a microcavity with silica allowing selective gas permeation (Reprinted by permission from Macmillan Publishers Ltd: Ref. 33, copyright 2012). b, Selectivity of graphene nanopores measured by Celebi et al.'2
Insets show 7.6 and 1000 nm pores produced (inset from Ref. 12. Reprinted with permission from the American Association for the Advancement of Science).
behavior in which the permeance of the nanopore changes discretely due to changes in pore configuration. Permeance changes of approximately an order of magnitude were recorded, with switching time scales ranging from minutes to hours. By laser heating a graphene membrane with a nanopore covered in gold nanoclusters, Wang et al.7 were able to concentrate the particles over
the pore and reduce gas permeance five-fold. This demonstrates the possibility of graphene nanopore flow control.
Larger nanopores cannot provide size-sieving but still have modest selectivities due to the mass dependence of average molecule speeds. The permeance of such pores is still very high owing to the atomic thickness of the membrane. Celebi et al.12 fabricated membranes with 10 106 pores
of 7.6-1000 nm diameter in two-layer graphene by focused ion beam drilling (Fig. 2-7b). By this
I
1- Knudsen
-- - - -
-0 200 400 600 800 1000
Figure 2-8. Model pore area definition. a, Example image for area calculation. b, Example pore with graphene lattice shown. Circles of van der Waals diameter are plotted in lighter blue and circles with van der Waals diameter scaled by 1/V are shown in darker blue. Pore area, A, is indicated. c, Equivalent circular pore with A,, De, and
D, indicated.
method they produced a membrane with 4.0% porosity having measured H2/CO2 selectivity near
the Knudsen value (4.7) and permeance (~ 10-2 mol/m2-s-Pa) more than three orders of magnitude
higher than existing gas separation membranes with similar selectivity.
2.3 Modeling
gas
transport in nanoporous graphene
The available data for gas transport through graphene nanopores can be further understood
using a simple scaling model. When the gas molecule is relatively large compared to the pore,
transport is treated as being limited by an activation barrier, whereas when the gas molecule is
relatively small compared to the pore, transport is treated as being limited by steric hindrance.
These regimes are both described below, with pore size parameters defined in Fig. 2-8. This model
captures the scaling observed from experiments and simulations (Fig. 2-4).
2.3.1 Steric regime model
Relatively large nanopores are approximated as behaving as open areas in a rigid barrier.
The gas molecules are treated as rigid spheres with the kinetic diameter of that gas and a
through if no part of the sphere intersects the rigid barrier along the molecule's trajectory (Fig.
2-5b). This is the model proposed by Sun et al.70 The pore is approximated as being circular with diameter DP = V4Ap/rw, where Ap is the pore area. As described in more detail in Section A. 1,
the pore area (Ap) is defined here as the in-plane open area within the pore when atoms in the
NATM are taken to be spheres with diameter equal to their van der Waals diameter divided by
V2
(Fig. 2-8a,b). The '2_ factor gives an approximate collision cross-section for the pore rim
atoms.70 79 Although pore area definitions vary in the literature, the data in Fig. 2-4 have been
converted to this definition.
A Monte Carlo simulation is used to compute the fraction of gas molecules incident on the
open area that pass through as a function of Dm/DP, where D, denotes the molecule kinetic
diameter. The point in the plane of the pore that the center of the sphere crosses is selected
randomly within the pore area. The incident angle of the molecule is also selected randomly,
however, the sample distribution accounts for the fact that molecules approach with greater
frequency from steeper angles (P(0) = sin 20, where P(O) is the probability density of the
incident molecule approaching the pore at angle 0 from the normal to the graphene plane).80 As
the sphere traverses the pore it sweeps out an elliptical contact area with the plane of the pore.
Example in-plane areas are shown in Fig. 2-5b in green for one molecule and red for another. A
crossing is counted if this area is completely within the circular pore. For example, in Fig. 2-5b,
the molecule sweeping out the green area is counted as crossing the pore whereas the molecule
sweeping out the red area is rejected. After many samples, the fraction of molecules that cross the
pore for a specified Dm/Dp is computed as,
J Number of crossings
This calculation is described further by Sun et al.70
This model neglects some important effects. Notably, it neglects adsorptive flux, geometric
details of the pore and gas molecules, three dimensionality of the pore, and non-hard sphere
interactions between the membrane and the gas molecules.
2.3.2 Activated regime model
Nanopores with relatively small effective open areas could provide almost complete steric
exclusion if the molecules were rigid. However, it is important to consider that the pore rim and
gas molecules are not rigid. The intermolecular potential allows the centers of these molecules to
be closer than a hard sphere potential would permit. However, the repulsive nature of the potential
at close range means that there is an energy barrier to the gas molecule center being close enough
to the pore rim molecule centers to cross through the pore.
In this model, the energy barrier for a molecule to pass through a pore is estimated using a
Lennard-Jones potential to describe the molecule-pore interactions. The pore is approximated as a
circular aperture of diameter D, with a continuous linear density of pore rim atoms (i.e., a torus, Fig. 2-8c).
In the Lennard-Jones potential, the interaction energy depends on the center-to-center
distance of atoms. The appropriate interatomic distance in this model is D,/2, the distance from a
gas molecule at the center of the pore to the center of a carbon atom on the pore rim (Fig. 2-8c).
However, pore diameter has been defined based on the steric model as DP = 4Ap/7r (Fig. 2-8b).
This estimate, as shown in Fig. 2-8b, is based on an effective pore area that excludes the effective
collision cross section of carbon atoms in the graphene lattice. D, can therefore be approximately calculated from Dp as follows: D, = DP + Dvdw/V.
Table 2-1. Lennard-Jones parameters used in permeance scaling model.129
Parameter Molecule pair
C-C H2-H2 CH4-CH4 C-H2 C-CH4
c [A]
3.385 2.827 3.758 3.106 3.5715[eV/K] 2.637 x 10⁻³ 5.144 x 10⁻³ 12.805 x 10⁻³ 3.683 X 10⁻³ 5.811 x 10⁻³
The energy barrier encountered by a molecule at the center of this pore is approximately
given by,
E~ 4D- (E1 /r) 6] (2-5)
a (DcI/2 ) Dc/2
The wDc/a prefactor approximates the number of carbon atoms on the rim of a pore of that size, where a is the distance between adjacent atoms (in Fig. 2-4, a = 1.42
A,
the bond length in graphene). Lorentz-Berthelot mixing rules were used to compute the o and E parameters fromthose for carbon and equivalent single point interaction models for the gas molecules. The values
used are provided in Table 2-1.
From this energy barrier, the transmission probability is calculated by the method of Schrier38 discussed above,
J
- erfc(
(2-6)Jideal gas Ap 2 kBT
This gives the transmission probability at the center of the pore.
The activated regime model also neglects some effects. Notably, it neglects adsorptive flux
2.3.3 Combined model
The steric regime model does not apply to very small pore sizes. For example, it predicts
zero transmission probability as DP - Dm goes to zero. However, since the pore is not made of
perfectly hard molecules, there is still a nonzero probability of transmission in this case. At the
other extreme, the activated regime model does not apply for relatively large pore sizes. When the
energy barrier is zero or negative, it predicts that there is no obstruction to crossing the pore. The
effective area needs to be adjusted by a factor accounting for the geometric hindrance of the pore
rim in this case.
The steric and activated regime models are combined into a single continuous pore
permeance coefficient versus pore size curve for each gas molecule in a simple way. The steric
model is used for pore diameters down to the size at which the activated model predicts a lower
permeance, and then that model is used for all smaller pore sizes. This change-over point depends
on the gas molecule, allowing some pores to operate in the steric regime for smaller gas molecules
and in the activated regime for larger gas molecules. This is the ideal operation for high permeance
and high selectivity.
Both regime models give transmission probabilities. To convert to pore permeance
coefficient, they are multiplied by the ideal gas flux. To obtain the pore permeation coefficient, they need to be further multiplied by an appropriate pore area. In the steric regime, this area is
A= D2/4, by the way the steric regime transmission coefficient was defined. In the activated
regime, the appropriate area is less apparent since the transmission probability is calculated at a
single point within the pore. Here, the same area (Ap) is used as in the steric regime. It should be