HAL Id: hal-01604329
https://hal.archives-ouvertes.fr/hal-01604329
Submitted on 26 May 2020
HAL is a multi-disciplinary open access
archive for the deposit and dissemination of sci-entific research documents, whether they are pub-lished or not. The documents may come from teaching and research institutions in France or abroad, or from public or private research centers.
L’archive ouverte pluridisciplinaire HAL, est destinée au dépôt et à la diffusion de documents scientifiques de niveau recherche, publiés ou non, émanant des établissements d’enseignement et de recherche français ou étrangers, des laboratoires publics ou privés.
Complex plant community responses to modifications of
disturbance and nutrient availability in productive
permanent grasslands
Frédérique Louault, Julien Pottier, Priscilla Note, Denis Vile, Jean-François
Soussana, Pascal Carrère
To cite this version:
Frédérique Louault, Julien Pottier, Priscilla Note, Denis Vile, Jean-François Soussana, et al.. Com-plex plant community responses to modifications of disturbance and nutrient availability in pro-ductive permanent grasslands. Journal of Vegetation Science, Wiley, 2017, 28 (3), pp.538-549. �10.1111/jvs.12509�. �hal-01604329�
Version postprint
Accepted
Article
This article has been accepted for publication and undergone full peer review but has not been through the copyediting, typesetting, pagination and proofreading process, which may Received Date : 18-Jan-2016
Revised Date : 03-Dec-2016 Accepted Date : 12-Dec-2016 Article type : Research article
Co-ordinating Editor : Hans Henrik Bruun
Title:
Coordinating Editor: Dr. Hans Henrik Bruun
Complex plant community responses to modifications of disturbance and nutrient
availability in productive permanent grasslands
Authors:
Frédérique Louault1, Julien Pottier1, Priscilla Note2, Denis Vile3, Jean-François Soussana4, Pascal Carrère1
Louault, F. (corresponding author, frederique.louault@inra.fr) 1 Pottier, J. (julien.pottier@inra.fr) 1 Note, P. (priscilla.note@inra.fr) 2 Vile, D. (denis.vile@inra.fr) 3 Soussana, J-F. (Jean-Francois.Soussana@inra.fr) 4 Carrère, P. (pascal.carrere@inra.fr) 1 1
INRA, UREP, Unité de Recherche sur l’Ecosystème Prairial, 5 chemin de Beaulieu, F-63039 Clermont-Ferrand, France
2
INRA UE1414 Herbipôle, site de Theix, F-63122 Saint-Genès-Champanelle, France 3
UMR759 INRA-SupAgro, Laboratoire d’Ecophysiologie des Plantes sous Stress Environnementaux (LEPSE), 2 pl. Pierre Viala, Bât 7, F-34060 Montpellier Cedex 2, France
Version postprint
Accepted
Article
4
INRA DS Environnement INRA, 147 rue de l’Université, F-75007, Paris, France
Printed journal page estimate:
6092 words (6092/800: 7.6 pages), tables (n=2) 0.5 pages, figures (n=4) 1.4 pages, total 9.5 pages.
Abstract:
Question(s): Do the effects of grazing and fertilisation on taxonomic and functional diversity
follow the dynamic equilibrium model?
Location: Long-term observatory of permanent upland grasslands in Massif-central, France.
Methods: Over eight years, we monitored vegetation changes in 24 experimental plots in
two productive grasslands after modification of grazing intensity (including abandonment) or fertilisation regime (including cessation of fertilisation). Botanical surveys and plant trait measurements (leaf dry matter content, LDMC; specific leaf area, SLA and reproductive plant height) were performed within each plot. We analysed taxonomic responses using principal response curves and functional responses from observed temporal changes of community-weighted mean traits and Rao index.
Results:
Grazing abandonment led to significant reductions in species richness and functional convergence toward taller plants with higher LDMC in both grasslands. Intermediate and high grazing pressure did not differ but showed strong variations in taxonomic diversity between-years. Changes in functional vegetation structure were mostly driven by species turnover and weakly influenced by intraspecific trait variability.
Community responses to modified fertilization regime were more complex with strong differences between the two mown grasslands. Species richness did not change significantly
Version postprint
Accepted
Article
although species evenness decreased in the highly-fertilised treatments (NPK), particularly in the most productive grassland. Here, functional changes were largely driven by intraspecific trait variability. Both functional divergence and convergence were found for different traits. In NPK, grassland assemblages converged toward taller plants while SLA diverged.
Conclusions:
In our upland study system, the different components of grassland diversity responded differently, in terms of direction or rate of change and mostly under extreme modifications of management. Following abandonment, the observed patterns suggest a prominent and consistent role of competitive exclusion as expected under the DEM. However, our findings also suggest the role of additional processes especially the importance of niche differentiation for our mown grassland under NPK. Timing and net effects of these combined assembly drivers were sensitive to even slight differences in initial productivity and species composition.
Keywords: land management; plant diversity; plant traits; vegetation; temporal changes;
long-term experiment; fertilisation; grazing.
Nomenclature Tutin et al. (1968-1993)
Abbreviations: CWM = Community-weighted mean; DEM = dynamic equilibrium model;
LDMC = leaf dry matter content; PRC = principal response curves; HRep = reproductive plant height; SLA = specific leaf area
Running head: Grassland diversity response to management changes
Introduction
Grasslands management has strong impacts on local and regional biodiversity and ultimately on ecosystem functioning and services (Balvanera et al. 2006). Predicting the response of
Version postprint
Accepted
Article
grassland diversity to changes in management practices is critical for promoting these services. The dynamic equilibrium model (DEM) suggests that the strength and direction of disturbance effects depend on ecosystem productivity (Huston 1979, 1994). These predictions are used for land management (see examples in Svensson et al. 2012), and are appealing in the case of semi-natural grasslands because disturbance and productivity can both be manipulated by defoliation (i.e. grazing and mowing) and fertilisation.
Although the effects of local treatments on species richness can be modulated by regional processes such as dispersal limitation (Myers & Harms 2009), results from grassland experiments generally support the predictions from DEM. For example, in nutrient-poor ecosystems, lower species richness has been reported in grazed sites compared to ungrazed ones (Waser & Price, 1981) whilst the opposite pattern is observed in nutrient-rich ecosystems (Hartnett et al. 1996). More recently, Laliberté et al. (2013) showed consistent changes in species richness with DEM’s predictions using a long-term factorial manipulation of soil resource and grazing intensity. However, the same patterns do not necessarily hold for other diversity indices since they may not all be driven by the same underlying processes. For example, species evenness is expected to increase with increasing disturbance irrespective of the level of productivity, as disturbance increases colonization rate by new individuals (Svensson et al. 2012). Despite theoretical predictions, evenness declines at high level of disturbances have been reported, likely as a result of dominance by “disturbance-specialists” (see review by Svensson et al. 2012).
According to the DEM, the effect of productivity and disturbance on grassland diversity is mediated by their interactive impact on the rate of competitive displacement. Nevertheless, plant competition may have two opposite, and often mixed effects on functional diversity. Competitive exclusion of some species in productive and/or weakly defoliated grasslands may decrease functional diversity (Gerhold et al. 2013; Grime 2006),
Version postprint
Accepted
Article
whereas niche differentiation may prevent competitive exclusion (MacArthur & Levin 1967). The latter is expected to lead to trait divergence and potentially increased functional diversity in response to fertilisation and/or decreased disturbance (Mason et al. 2011). For example, Niu et al. (2014) reported an increase in functional diversity, while Janeček et al. (2013) observed a decrease, although both studies highlighted a decrease of species richness in response to fertilisation. In addition, functional responses may be inconsistent between traits (Pakeman 2004), depending on their role on direct plant response to disturbance or resource use and indirectly on plant interactions. A better understanding of how grassland communities are driven by defoliation regime and/or nutrient availability may result from comparisons of several facets of diversity, including taxonomic component and trait-specific responses in terms of diversity and mean values.
Grassland experiments are often implemented over short time periods. However, plant community changes may show complex patterns over mid- to long-term time series. Bullock et al. (2001) comparing 4-years and 12-years surveys, showed important changes of grazing effects over time. Laliberté et al. (2012) showed irregular responses, with rapid shifts during the first five years, then a progressive shift back during the next 15 years. Such examples stress the need for long-term experiments for analysing vegetation response to management practices. To date, understanding of timing and dynamics of vegetation responses is lacking.
Here, we manipulated fertilisation and grazing regime in two productive grasslands and monitored taxonomic and functional properties of vegetation over 8 years. Functional properties were derived from three plant traits: i) plant height, related to species competitive ability (Gaudet & Keddy 1988) and recognized to respond to grazing (Diaz et al. 2007); ii) specific leaf area (SLA), correlated with plant relative growth rate and photosynthetic ability, and indicative of species resource-use strategy (Reich 2014); iii) leaf dry matter content (LDMC), used as an indicator of soil fertility (Hodgson et al. 2011) and disturbance (Louault
Version postprint
Accepted
Article
et al. 2005). We examine how taxonomic and functional diversity respond to changes in grazing pressure and fertilization. We also investigate whether diversity changes meet expectations of the dynamic equilibrium model. Based on the DEM and the high initial productivity of our system, we expected species richness and evenness to increase with grazing pressure or following cessation of fertilisation. In the case of increased competition, i.e. abandonment and high fertilization regime, we expect either i) taller plants and reduced trait variability (height, SLA and LDMC) to be associated with a decline of species richness, or ii) increased variability in traits associated with resource use strategy (SLA and LDMC) as a result of niche differentiation, and concurrent maintenance of species richness.
Methods
Study site and experimental design
The experiment was established in 2005 on a site located in the Massif-central region in France (45°43’23”N, 03°1’21”E, 880m a.s.l.). The climate is semi-continental with a mean annual temperature of 8.7°C and rainfall of 770 mm. Soil has developed from a granitic rock substrate at this site and the top soil layer displays spatial heterogeneity with part of the zone, characterized by eutric cambisol and part by colluvic cambisol. The experimental design was therefore repeated on two distinct blocks depending on soil. Differences in soil characteristics are associated with different levels of aboveground production (block 1 being 20% more productive than block 2) and botanical composition (Appendix S1). We therefore consider the two blocks as distinct mesophile grasslands.
Prior to 2003, site management consisted of a mixed regime with cuts for silage or hay, with mineral and organic fertilizer applications, followed by grazing in autumn. In the two years preceding the implementation of the experiment (2003-2004), three annual cuts
Version postprint
Accepted
Article
were applied without fertilisation supply. From 2005 onwards, six treatments were applied, manipulating the level of herbage utilization by cattle rotational grazing without fertilisation (i.e. disturbance gradient; three treatments) and the level of fertilisation under a fixed cutting regime (i.e. nutrient availability gradient; three treatments). Each treatment was repeated twice in each block, resulting in 24 plots. The cattle grazing treatments, applied on 2200 m² plots, consisted of either high stocking density (Ca+; i.e. full herbage utilisation at each rotation leading to targeted short sward residual height, assessed per block) or low stocking density (Ca-; half stocking density compared to Ca+ treatment but same grazing duration). Five grazing periods were applied each year, leading to a mean annual stocking rate of 1.46 livestock units (LU).ha-1 in Ca+ and 0.73 LU.ha-1 in Ca− and a median green sward surface height at the end of each grazing period significantly lower in Ca+ (7.7 cm ± 0.23 se) than in Ca- (15.2 cm ± 0.54 se, P < 0.001). In addition, smaller plots (400m²) were either abandoned (Ab) or used for fertilisation treatments. Fertilised plots were cut three times per year and fertilizer application was fractioned in early spring, after the first and the second cuts. The
treatments were addition of mineral nitrogen, phosphorus and potassium (NPK; 264 kg N.ha
-1
, 33 kg P.ha-1 and 189 kg K.ha-1), addition of mineral phosphorus and potassium (PK; 26 kg P.ha-1 and 143 kg K.ha-1) and no fertilisation (Null). Nutritional status for nitrogen was measured in each plot to assess the effect of treatments on N availability (Appendix S2).
Botanical surveys
We completed plant species inventories in each of the 24 plots, in 2004 (before treatment application), then from 2006 to 2012 (all years except 2009), using 40 pin-points regularly spaced along two to three fixed transects. Presence/absence of species was recorded for each of the 40 pin-points. The frequency of each species was calculated at the plot scale (Grant 1993), then standardized to the sum of all species frequencies and expressed in percentage
Version postprint
Accepted
Article
(i.e. species relative frequency). Within-plot species richness and evenness were estimated according to Pielou (1972).
Plant traits and functional diversity indices
Plant traits were measured in each plots on the most frequent species (accounting for at least 85% of the total cumulated presences). Such approach allowed robust estimation of trait patterns at the plot scale including intraspecific variation in response to the treatments (Appendix S3). An initial species list was established in 2006 comprising 206 items (i.e. one species in a given plot) of 17 species. A complementary list was established each following year and additional traits measurements were carried out for 108 new items. Leaf dry matter content (LDMC, gdry mass gwater-saturated fresh mass-1) and specific leaf area (SLA, cm2.gdry mass-1), were measured on ten vegetative plant units using standard protocols (see methods in Louault et al. 2005). Reproductive plant height (HRep, cm) was measured on mature plants located in exclosures to allow full plant development. .
Ellenberg indicator values N for “nitrogen” (Ellenberg et al. 1992) were assigned to all recorded species.
Community Weighted Means (CWM) for the three measured traits and the Ellenberg indicator values were calculated for each of the 24 plots for years 2006 to 2012 as
CMW =
Pi*variablei Eq. 1Where Pi is the relative contribution of species i to the community, and variablei represents
the trait or Ellenberg value under consideration.
Functional diversity was assessed for each trait in each of the 24 plots using the Rao Q coefficient leading Lepš et al. (2006).
Q =
s i s j j i ijPP d 1 1 Eq. 2Version postprint
Accepted
Article
Where s is the number of species in the community, dij is the trait dissimilarity of species i
and j, calculated as 1- overlap.
Statistical analyses
Statistical analyses were performed for each gradient (disturbance and nutrient availability) separately.
Floristic changes through time in response to the treatments were analysed using Principal Response Curves (PRC) with species relative frequencies estimated prior treatment application as the reference point (Van den Brink et al. 2009). Data were transformed following Hellinger (Legendre & Gallagher 2001) and significance was tested with 9999 Monte Carlo permutations.
Variables describing taxonomic diversity and functional structure of the vegetation were analysed with mixed-models. The models were set for repeated measurements over years with treatment, year and block as fixed factors and plot repetition as a random factor. For species richness and evenness, 2004 estimates (prior to the experiment) were included as a covariate. Since these covariates did not improve model goodness-of-fit, they were removed from the analyses.
Data analyses were conducted under the R 3.0.1 environment (R Development Core team 2012). Mixed models were performed with the lme4 package and PRC with the vegan package (Oksanen et al. 2015).
Version postprint
Accepted
Article
Results
Community composition
We found significant vegetation changes along the first principal component of the PRC for each gradient and block (all P < 0.01). Along the disturbance gradient, PRC showed progressive divergence between treatments (Fig. 1a, b) with larger differences between high stocking density (Ca+) and abandonment (Ab). This pattern was consistent between the two blocks. Along the nutrient gradient, PRC also showed strong and progressive divergence between the treatments (Fig. 1c, d), chiefly between NPK fertilisation and PK fertilisation or no fertilisation (Null). These patterns were also consistent between blocks.
Treatment effects (both gradients included) on species turnover between 2004 and 2012 were driven by species replacement rather than by changes in species richness (Appendix S4).
Taxonomic diversity
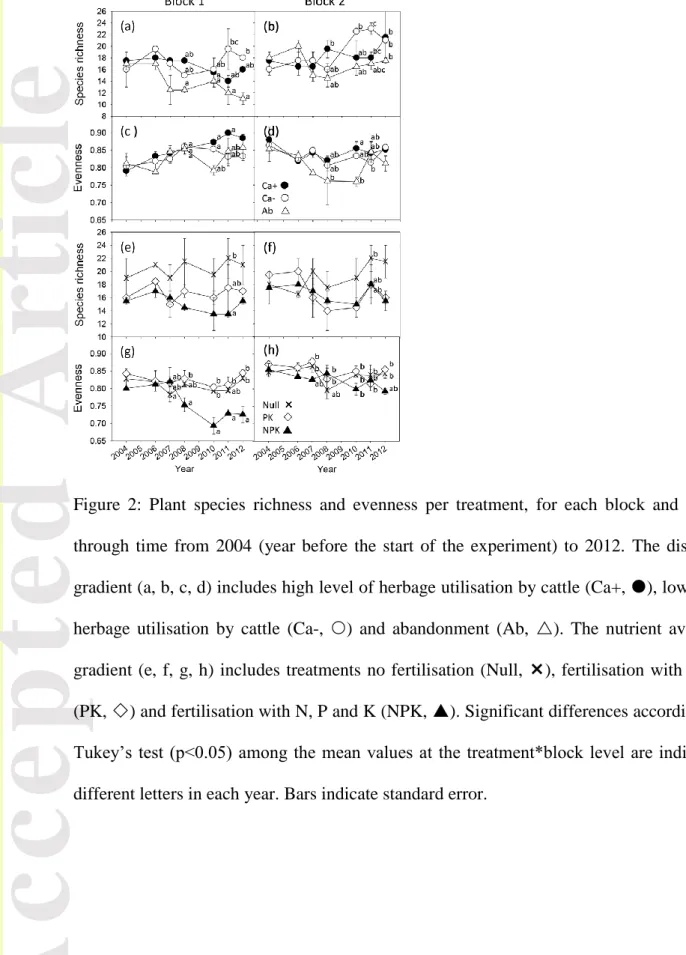
Along the disturbance gradient, species richness remained significantly higher in block 2 (18.2 ± 0.51 species) than in block 1 (15.7 ± 0.48 species) on average. Mixed model analysis revealed a significant interaction between years and treatments (Table 1), with decreases in species richness in Ab compared with Ca- and Ca+ by 2011 (Fig. 2a, b). Species evenness showed significant but weak differences between the two blocks across treatments and time (0.84 ± 0.01 in block1 and 0.82 ± 0.01 in block2). A significant treatment effect was found, indicating slightly lower evenness values in Ab than in Ca+ and Ca-. Complementary analyses and comparisons of 2004 data indicate that there is no sampling bias due to plot size differences between grazed and abandoned treatment (data not shown).
Version postprint
Accepted
Article
Along the nutrient gradient, a significant year effect was found only for species richness (Table 1). Treatment x year was marginally significant (P = 0.083), indicating a slight increase of richness by 2011 in Null plots (21.3 ± 1.60 in 2012) compared to NPK (15.5 ± 0.65 in 2012). Species evenness became significantly lower in NPK over time (Table 1 Fig. 2e, f), but mainly in block 1 as indicated by the significant treatment x year x block term. At the start of the experiment, species evenness was lower in block 1 than in block 2 (0.82±0.01 and 0.86±0.01, respectively).
Community-weighted means (CWM)
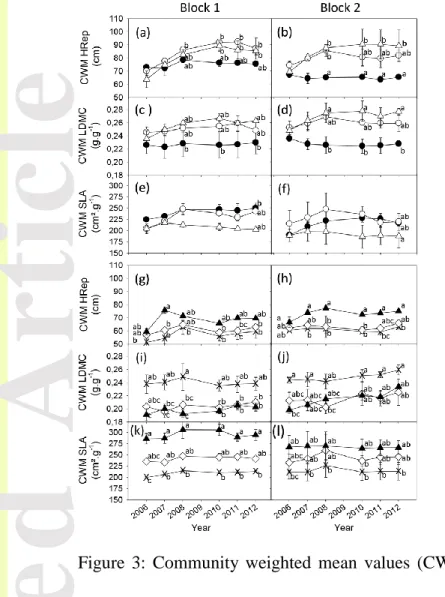
Along the disturbance gradient, the treatment x year interaction was significant or marginally significant for the three investigated traits (Table 2). CWM-HRep became progressively higher in Ab and Ca- than in Ca+ in the two blocks (Fig. 3a, b), reaching CWM values of 70.7 cm (± 1.6) in Ca+ and 86.6 cm (± 1.4) in Ab and Ca- from 2008 to 2012. CWM-SLA became lower in Ab (195.1 ± 11.6 cm².g-1) than in Ca+ and Ca- and (232.1 ± 7.1 cm².g-1; Fig. 3e, f) and CWM-LDMC was lower in Ca+ 0.227 g.g-1 ± 0.004) than in Ca- and Ab (0.263 g.g-1 ± 0.002) along the 2008-2012 period (Fig. 3c, d). Patterns for LDMC and SLA were consistent between blocks. No significant effect was found for CWM-N (Table 1, Appendix S5).
Along the nutrient gradient, we found independent treatment and years effects for the three traits (Table 2). CWM-HRep was higher in NPK than the two other treatments over the entire period, but showed considerable fluctuations between years (Fig. 3g, h). CWM-SLA was clearly different between the three treatments in both blocks with noticeable between-years variations as well (Fig. 4k, l). CWM-SLA averaged over blocks and between-years were 212 cm².g-1 ± 3 in Null, 242 cm².g-1 ± 4 in PK and 281cm².g-1 ± 5 in NPK. CWM-LDMC was significantly higher in Null than PK and NPK (Fig. 3i, j). However, these differences
Version postprint
Accepted
Article
decreased slightly through time, especially in block 2 (significant block x year interaction, Table 2). CWM-N was higher in block 1 than in block 2 (Table 1). It became higher in NPK than in PK and Null in block1, whereas CWM-N in NPK and PK treatments became higher than CWM-N in Null treatment in block2.
Functional diversity
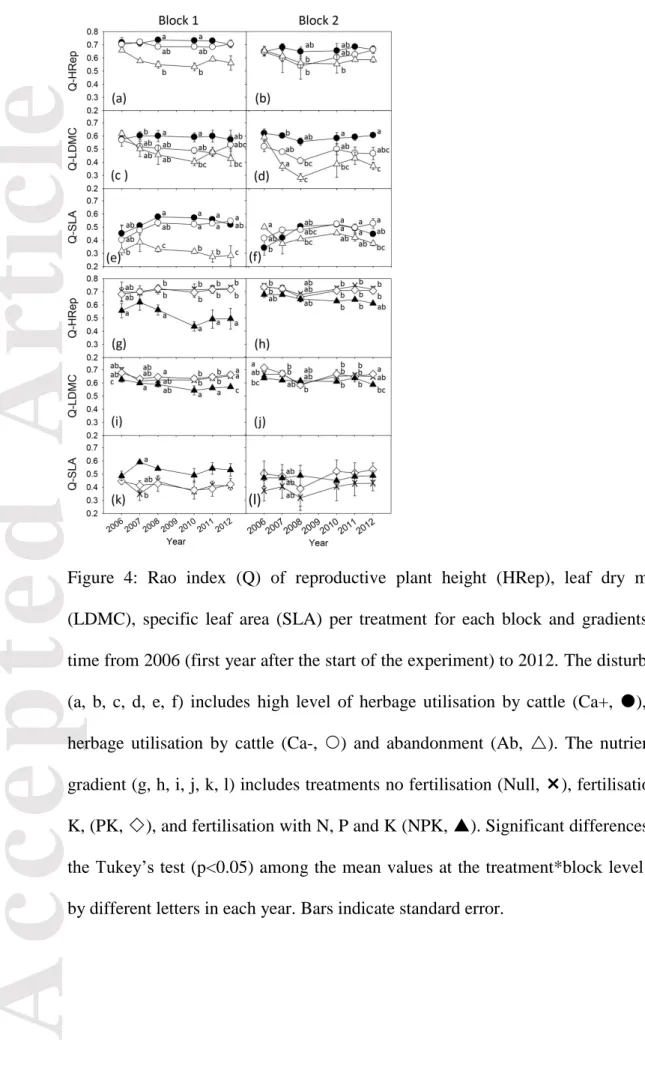
Along the disturbance gradient, the Rao index for plant reproductive height (Q-HRep) displayed a significant but weak response to treatment only (Table 2), with lower values in Ab than in the two grazed treatments. We found significant treatment x year interactions for
Q-SLA and Q-LDMC, leading to lower variation of both traits in Ab than in grazed
treatments (Table 2, Fig. 4c, f). The divergence of SLA, was stronger in block1 than in block 2. Between-year variations, independent from long-term trends, showed greater amplitude in block 2 especially for Q-LDMC.
Along the nutrient gradient, we found significant treatment x year and year x block interactions on Q-HRep (Table 2). Q-HRep was lower in NPK than in PK and Null since 2006 in both blocks (Fig. 4g, h). In block 1, Q-HRep showed an abrupt decline from 2007 to 2010 and then stabilised, as opposed to block 2 where it progressively declined. Such differentiation of Q-HRep in NPK and the two other fertilisation treatments over time tended to be more pronounced in block 1 than block 2, as supported by the marginally significant effect of the three-way interaction term. We found significant treatment x year x block interaction on Q-SLA. By 2007 Q-SLA was higher in NPK than PK and Null in block 1 only. In addition, we found complex between-year variations that differed between the two blocks (Fig. 4k, l). Like the two other traits, Q-LDMC showed greater between-treatment differentiation over time in block 1. However, we found lower values in NPK than PK and Null. This differentiation in block 1 was slow but progressive until 2010, stabilising in 2011
Version postprint
Accepted
Article
and 2012 (Fig. 4i, j). Between-year variations were more complex in block 2. Q-LDMC in NPK differed from PK and Null only in 2006 and 2012.
Discussion
After 8 years of management manipulation we found strong differences in terms of direction, strength and timing of vegetation response between i) components of plant diversity, ii) management gradients and iii) two distinct mesophile grasslands.
Response to changes in disturbance level
Based on predictions from the DEM and Svensson et al. (2012), we expected both species richness and evenness to decrease with decreased disturbance. Our results confirmed this hypothesis in both blocks despite strong initial taxonomic differences in 2004. This is in accordance with other grazing experiments conducted in productive grasslands (De Bello et al. 2006). However, we did not find a monotonic decrease of species diversity with decreased disturbance as predicted by the DEM, but only lower diversity in abandoned plots compared to the grazed treatments.
We suggest that our grasslands represent intermediate levels of productivity in the DEM framework, with Ab and Ca- on the increasing phase of the hump-shaped curve linking species richness to disturbance intensity and Ca+ at the start of the decreasing phase. The lack of difference in species richness between Ca+ and Ca- could also reflect species pool limitation. Increased disturbance is expected to enhance recruitment opportunities (Myers & Harms 2009). However, greater recruitment opportunities in Ca+ than Ca- may have not been filled by new species if seed arrival from the surrounding habitat matrix is not strong enough. This hypothesis is realistic in the case of tall grasslands because seed dispersal is limited to
Version postprint
Accepted
Article
short distances and plants mostly regenerate vegetatively (Benson & Hartnett 2006). In addition, thick stubble and litter layers associated to quick regrowth may prevent individual recruitment in productive grasslands (Laliberté et al. 2013).
Regarding functional diversity, our results support our expectation, i.e. a reduced variability of height, SLA and LDMC with decreasing disturbance. These changes were mostly driven by species compositional changes, as we observed no treatment effect on trait values at the species level (Appendix S3) but strong changes at the community level.
Observed changes in species richness and functional diversity were generally consistent, although between-years variations were far more pronounced for species richness compared with trait variability. This suggests that community changes were strongly influenced by demographic stochasticity in addition to niche-based processes.
Together, changes in taxonomic and functional indices indicate a greater importance of competition for light in abandoned plots where traits converged toward tall plants with high LDMC, lower SLA especially in the more productive block 1, lower species richness and stronger species dominance compared to Ca+ and Ca-. This is in accordance with our statement since competition for light is expected to be size asymmetric and more intense as soil resource availability increases (DeMalach et al. 2016). Filtering of tall species in weakly disturbed grasslands has already been reported (Louault et al. 2005; Janeček et al. 2013), reflecting the success of most competitive species (Gaudet & Keddy 1988). The dominance of tall plants with high LDMC has also already been observed under low herbage utilisation (Louault et al. 2005; Laliberté et al. 2012), likely reflecting the increased investment in structural tissue in tall plants. Higher values of community-level LDMC may also result from the larger grass contribution under lower disturbance treatment (data not shown) since grasses display higher LDMC values than forbs (Cruz et al. 2002).
Version postprint
Accepted
Article
In the grazed treatments, the weak increase in CWM-SLA may simply reflect the negative relationship between SLA and LDMC (Hodgson et al. 2011). Alternatively, the higher CWM-SLA under more intensive grazing pressure may promote compensatory growth after defoliation, recognized as a mechanism of tolerance to herbivory (Tiffin 2000). In addition, functional divergence in grazed treatments may be linked to increased spatial heterogeneity driven by patchy selective grazing previously observed in the experimental fields (Rossignol et al. 2011). Since spatial heterogeneity is generally considered to support mechanisms of coexistence, patchy grazing has been positively related to within-plot diversity (reviewed by Bloor & Pottier 2014).
In summary, grazing abandonment reduced both species and functional diversity as expected with increased plant competition for light. Prolonged grazing promoted the maintenance of species richness and differentiation of species resource-use strategies as indicated by the observed functional divergence and species turnover through time. The origin of such functional differentiation requires further investigation.
We are confident that the reported changes in taxonomic and functional diversity resulted from disturbance effect and not changes in plot fertility. Indeed, productivity, nitrogen nutrient index (Appendix S2) and CWM-N (Table 1, Appendix S5) remained high in the disturbance treatments. This is consistent with Bullock et al. (2001) who stress that grazing is not a useful method to decrease soil nutrients in fertile pastures.
Response to modifications of nutrient availability
During the experimental period, modifications of nutrient availability by fertilisation were effective, leading to higher productivity and nitrogen nutrition index in NPK compared with PK and Null (Appendix S2). Therefore, we expected species richness to increase in Null compared to PK and NPK treatments, as predicted by the DEM. But, we observed only a
Version postprint
Accepted
Article
marginally significant effect of treatment on species richness, providing little support for this hypothesis. Furthermore, species evenness did not increase asymptotically with cessation of fertility as expected with the Svensson et al. (2012) model. Instead, we found that species evenness decreased in the most fertilised treatments (NPK) of the most productive block (block1).
Loss of species and or greater species dominance have often been reported as consequences of fertiliser application (Laliberté et al. 2013; Niu et al. 2014). Discrepancies between results obtained in the present study and those previously reported in the literature could stem from a number of factors. It is possible that fertiliser application may have rather increased nutrient availability than simply maintained it to the level prior the experiment. If so the observed decrease of evenness in block1 is consistent with a decrease of species diversity in response to increased productivity. Alternatively, different response for species evenness between block with no differentiation between treatments in the less productive block 2 may nevertheless be in accordance with Svensson et al. (2012). Since this latter predict that species evenness increases asymptotically as productivity decreases, the treatments in block 2 may have reached the asymptote, which appears earlier along the productivity gradient as disturbance severity increases, leading to lack of differentiation between treatments. Moreover, response of species richness may have been hidden by the strong between-years fluctuations, and may take longer time period to differentiate between treatments. Such timing argument also holds for the lack of effects in the less productive block2, in accordance with Janeček et al. (2013) who found that the effect of fertilisation was faster in productive meadows than on less productive ones.
Responses of functional traits (CWM and Q) provide mixed support for an effect of nutrient availability on competitive exclusion under fixed cutting regime, and functional changes were mostly driven by intraspecific variability. In 2006, CWM of LDMC and SLA
Version postprint
Accepted
Article
were already differentiated between the treatments, despite limited compositional changes. Between 2006 and 2012, these CWM values remained fairly stable, with convergence toward taller plants in NPK, in accordance with previous findings (Janeček et al. 2013). Such functional patterns associated with greater species’ dominance under N fertilisation are consistent with stronger competition. Although strong competition often translates to species loss over time, an additional mechanism may have prevented, or at least slowed down, competitive exclusion in our experiment. It is notable that SLA diverged through time in NPK of block 1. Trait divergence is interpreted as a consequence of an increased niche differentiation promoting stable coexistence of species (MacArthur & Levins 1967; Mason et al. 2011). In grasslands, such a phenomenon has previously been reported by Niu et al. (2014) using the same index (Q) but constructed with multiple traits and associated to species loss. In our study, the cutting regime may also have reduced the strength of competitive interactions and slowed down competitive exclusion.
In summary, we report both convergence and divergence when looking at different traits. In the most productive plots, increased competition may have led to the observed increase of dominance and selection of tall species but species exclusion was likely prevented by species differentiation in their resource use strategy via intraspecific trait plasticity.
Implications for grassland management
Improving diversity of productive or previously intensively-managed grasslands is an important issue because grasslands cover large geographic area and support a large panel of ecosystems services. We report patterns which are largely consistent with theoretical expectations, and may help anticipate the effect of disturbance and ecosystem productivity on grassland diversity. However, from a management perspective, promoting grassland diversity by modifications of fertilisation or grazing regime remains challenging.
Version postprint
Accepted
Article
Our findings highlight four issues. First, not all components of plant diversity may show the same direction or rate of change to modified management. This suggests that managers should decide which components they intend to modify in priority according to the grassland’ services they would like to promote. For example, according to Pakeman (2014), herbage productivity in grasslands is related to mean LDMC whereas resilience appears related to its variance. Second, diversity responses seem to be very sensitive to initial productivity, at least along the fertilisation gradient. The role of initial productivity is at the core of the DEM and has been suggested to explain between-study discrepancies (Pakeman et al. 2011). Unlike previous studies that consider highly contrasted situations, we show that small differences of initial productivity may also lead to contrasted dynamics. This emphasises the need to accurately assess initial conditions before considering changes in management practices. Third, temporal patterns show significant differences between diversity components and management gradients. Since slow and/or stochastic processes may drive species richness responses, other components, like functional diversity may be more rapidly affected by management modifications. This may explain why many studies fail to restore species-rich mown grasslands after cessation or decrease of fertilisation despite strong shifts in plant species composition (Pavlü et al. 2011; Marriott et al. 2004).
Finally, only strong changes of management practices affected patterns of plant diversity, with intermediate treatments confounded with one or the other end of the gradients. For refined management of plant diversity patterns, further research should consider combined modifications of both grazing and fertilisation regimes.
Acknowledgements
We thank the staff of INRA-UE1414 Herbipôle, M. Frain and I. Bosio, B. Pons, O. Darsonville, V. Guillot, E. Viallard, J.M. Vallée, P. Pichon and S. Toillon from
INRA-Version postprint
Accepted
Article
UR0874 for their technical expertise in field measurements. We also thank anonymous referees and the editor for insightful comments on previous version of the manuscript, and Juliette Bloor for constructive comments and English rewriting in the revised version. The experiment is part of the SOERE-ACBB project (http://www.soere-acbb.com) funded by Allenvi and the French National Infrastructure AnaEE-F through ANR-11-INBS-0001. This work was supported by the ANR-DISCOVER project grant.
References
Balvanera, P., Pfisterer, A.B., Buchmann, N., He, J.S., Nakashizuka, T., Raffaelli, D. & Schmid, B. 2006. Quantifying the evidence for biodiversity effects on ecosystem functioning and services. Ecology Letters 9: 1146–1156.
Benson, E.J. & Hartnett, D.C. 2006. The role of seed and vegetative reproduction in plant recruitment and demography in tallgrass prairie. Plant Ecology 187: 163–178.
Bloor, J.M.G. & Pottier, J. 2014. Grazing and spatial heterogeneity: implications for grassland structure and function. In: Mariotte, P & Kardol, P (eds) Grassland
Biodiversity and Conservation in a Changing World, pp. 135–162. Nova Publisher.
Bullock, J.M., Franklin, J., Stevenson, M.J., Silvertown, J., Coulson, S.J., Gregory, S.J. & Tofts, R 2001. A plant trait analysis of responses to grazing in a long-term experiment. Journal of Applied Ecology 38: 253–267.
Cruz, P., Duru, M., Therond, O., Theau, J-P., Ducourtieux, C., Jouany, C., Al Haj Khaled, R. & Ansquer, P. 2002. Une nouvelle approche pour caractériser les prairies naturelles et leur valeur d’usage. Fourrages 172: 335-354.
De Bello, F., Lepš, J. & Sebastia, M-T., 2006. Variation in species and functional plant diversity along climatic and grazing gradients. Ecography 29: 801-810.
Version postprint
Accepted
Article
DeMalach, N., Zaady, E., Weiner, J. & Kadmon, R. 2016. Size asymmetry of resource
competition and the structure of plant communities. Journal of Ecology 104: 899–910. Diaz, S., Lavorel, S., Mc Intyre, S., Falczuk, V., Casanoves, F., Milchunas, D.G., Slarpe C.,
Rusch, G, Sternberg, M. (…) & Campbell, B.D. 2007. Plant trait responses to grazing – a global synthesis. Global Change Biology 13: 313–341.
Ellenberg, H., Weber, H. E., Düll, R., Wirth, V., Werner, W., & Paulissen, D. 1992. Zeigerwerte von Pflanzen in Mitteleuropa. Scripta Geobotanica 18: 1-258.
Gaudet, C.L. & Keddy, P.A. 1988. A comparative approach to predicting competitive ability from plant traits. Nature 334: 242-243.
Gerhold, P., Price, J.N., Pussa, K., Kalamees, R., Aher, K., Kaasik, A., & Partel, M. 2013. Functional and phylogenetic community assembly linked to changes in species diversity in a long-term resource manipulation experiment. Journal of vegetation
Science 24: 843-852.
Grant, S.A. 1993. Resource description: vegetation and sward components. In: Davies, A., Baker, R.D., Grant, S.A. & Laidlaw, A.S. (eds.) Sward Measurement Handbook, 2nd ed. pp. 69-97. British Grassland Society, Reading, UK.
Grime, J.P. 2006. Trait convergence and trait divergence in herbaceous plant communities Mechanisms and consequences. Journal of vegetation Science 17: 255-260.
Hartnett, D.C., Hickman, K.R. & Walter, L.E.F. 1996. Effects of bison grazing, fire and topography on floristic diversity in tallgrass prairie. Journal of Range Management 49: 413-420.
HilleRisLambers, J., Adler, P.B., Harpole, W.S., Levine, J.M. & Mayfield, M.M. 2012. Rethinking community assembly through the lens of coexistence theory. Annual
Version postprint
Accepted
Article
Hodgson, J.G., Montserrat-Martí, G., Charles, M., Jones, G., Wilson, P., Shipley, B., Sharafi, M., Cerabolini, B.E.L., Cornelissen, J.H.C., (…) & Royo Pla, F. 2011. Is leaf dry matter content a better predictor of soil fertility than specific leaf area? Annals of
Botany 108: 1337-45.
Huston, M.A. 1994. Biological Diversity: The Coexistence of Species on changing
landscapes. Cambridge University Press, Cambridge.
Huston, M.A. 1979. A general hypothesis of species diversity. American. Naturalist 113: 81-101.
Janeček, Š., de Bello, F., Horník, J., Bartoš, M., Černý, T., Doležal, J., Dvorský, M., Fajmon, K., Janečková, P., (…) & Klimešová, J. (2013). Effects of land-use changes on plant functional and taxonomic diversity along a productivity gradient in wet meadows.
Journal of Vegetation Science 24: 898–909.
Janssens, F., Peeters, A., Tallowin, J.R.B., Bakker, R.M., Fillat, F. & Oomes, M.J.M. 1998. Relationship between soil chemical factors and grassland diversity. Plant and Soil 202: 69-78.
Laliberté, E., Shipley, B., Norton, D.A. & Scott, D. 2012. Which plant traits determine abundance under long-term shifts in soil resource availability and grazing intensity?
Journal of Ecology 100: 662–677.
Laliberté, E., Lambers, H., Norton, D.A., Tylianakis, J.M. & Huston, M.A. 2013. A long term experimental test of the dynamic equilibrium model of species diversity. Oecologia 171: 439-448.
Legendre, P. & Gallagher, E.D. 2001. Ecologically meaningful transformations for ordination of species data. Oecologia 129: 271-280.
Lepš, J., de Bello, F., Lavorel, S. & Berman, S. 2006. Quantifying and interpreting functional diversity of natural communities: practical considerations matter. Preslia 78: 481-501.
Version postprint
Accepted
Article
Louault, F., Pillar, V.D., Aufrère, J., Garnier, E. & Soussana, J-F. 2005. Plant traits and functional types in response to reduced disturbance in a semi-natural grassland.
Journal of Vegetation Science 16: 151-160.
MacArthur, R. & Levins, R. 1967. The limiting similarity, convergence, and divergence of coexisting species. American Naturalist 101: 377–385.
Marriott, C.A., Fothergill, M., Jeangros, B., Scotton, M. & Louault, F. 2004. Long-term impacts of extensification of grassland management on biodiversity and productivity in upland areas. A review. Agronomie 24: 447–461.
Mason, N.W.H., de Bello, F., Dolezal, J. & Lepš, J. 2011. Niche overlap reveals the effects of competition, disturbance and contrasting assembly processes in experimental grassland communities. Journal of Ecology 99: 788-796.
Myers, J.A. & Harms, K.E. 2009. Seed arrival, ecological filters, and plant species richness: a meta-analysis. Ecology letters 12/ 1250–60.
Niu, K., Choler, P., de Bello, F., Mirotchnick, N., Du, G. & Sun, S. 2014. Fertilization decreases species diversity but increases functional diversity: A three-year experiment in a Tibetan alpine meadow. Agriculture, Ecosystems, Environment 182: 106-112. Oksanen, J., Blanchet, G., Kindt, R., Legendre, P., Minchin, P.R., O'Hara, R.B., Simpson,
G.L., Solymos, P., Stevens, M.H.H. & Wagner, H. 2015. Community Ecology
Package. R package version 2.2-1
Pakeman, R.J. 2004. Consistency of plant species and trait responses to grazing along a productivity gradient: a multi-site analysis. Journal of Ecology 92: 893–905.
Pakeman, J.R. 2014. Leaf dry matter content predicts herbivore productivity, but its functional diversity is positively related to resilience in grasslands. PLos One 9: e101876.
Version postprint
Accepted
Article
Pakeman, R.J., Lennon, J.J. & Brooker, R.W. 2011. Trait assembly in plant assemblages and its modulation by productivity and disturbance. Oecologia 167: 209-218.
Pavlü, V., Schellberg, J. & Hejcman, M. 2011. Cutting frequency vs. N application: effect of a 20-year management in Lolio-Cynosuretum grassland. Grass and Forage Science 66: 501–515.
Pielou, E.C. 1972. Niche width and niche overlap: a method for measuring them. Ecology 53: 687-692.
Reich, P.B. 2014. The world-wide ‘fast-slow’ plant economics spectrum: a traits manifesto.
Journal of Ecology 102: 275-301.
Rossignol, N., Chadoeuf, J., Carrère, P. & Dumont, B. 2011. A hierarchical model for analysing the stability of vegetation patterns created by grazing in temperate pastures.
Applied Vegetation Science 14: 189–199.
Svensson, J.R., Lindegarth, M., Jonsson, P.R. & Pavia, H. 2012. Disturbance–diversity models: what do they really predict and how are they tested? Proc. R. Soc. B., doi:10.1098/rspb.2011.2620
Tiffin, P. 2000. Mechanisms of tolerance to herbivore damage: What do we know?
Evolutionary Ecology 14: 523–536.
Van den Brink, P.J., Den Besten, P.J., Bij de Vaate, A. & Ter Braak, C.J.F. 2009. Principal response curves technique for the analysis of multivariate biomonitoring time series.
Environmental Monitoring and Assessment 152: 271–81.
Waser, N.M. & Price, M.V. 1981. Effects of grazing on diversity of annual plants in the Sonoran desert. Oecologia 50: 407-411.
Version postprint
Accepted
Article
Supporting Information
In the online version of this article:
Appendix S1: Mean characteristics of plots in block 1 (n=12 plots) and in block 2 (n=12 plots) of the
experimental site.
Appendix S2: Nitrogen nutrient Index in 2012 and annual productivity according to
treatment under disturbance and fertilisation gradients
Appendix S3: Traits values at species level
Appendix S4: Species turnover between 2004 and 2012 assessed by Sorensen index
Appendix S5: Community Weighted Mean values of N Ellenberg indicator
TABLES
Table 1: Test of fixed effects (Treatment, Year, Block and interactions; F and P value) on species richness, evenness and cumulated weighted mean N Ellenberg indicators along (a) the disturbance gradient and (b) the nutrient gradient.
F P F P F P F P F P F P F P
(a) Disturbance (Ca+, Ca-, Ab)
Richness 8.99 0.0157 2.28 0.0723 12.81 0.0116 2.87 0.0124 1.57 0.2829 2.10 0.0934 0.65 0.7608 Evenness 6.54 0.0311 2.01 0.1063 6.30 0.0458 1.76 0.1134 0.96 0.4344 2.18 0.0828 1.43 0.2137 CWM Ell. N 1.49 0.2977 1.43 0.2436 0.77 0.4131 0.69 0.7259 0.45 0.6562 1.56 0.2020 1.30 0.2775
(b) Nutrient (Fertilisation Null, PK, NPK)
Richness 4.11 0.0753 3.73 0.0096 0.00 0.9956 1.91 0.0828 0.48 0.6402 1.48 0.2267 0.87 0.5741 Evenness 10.56 0.0108 4.71 0.0027 23.26 0.0029 2.77 0.0150 1.72 0.2574 1.53 0.2100 2.58 0.0216 CWM Ell. N 17.35 0.0032 6.44 0.0004 17.87 0.0055 5.56 0.0001 1.43 0.3103 2.42 0.0584 1.63 0.1449
T x B Y x B
Version postprint
Accepted
Article
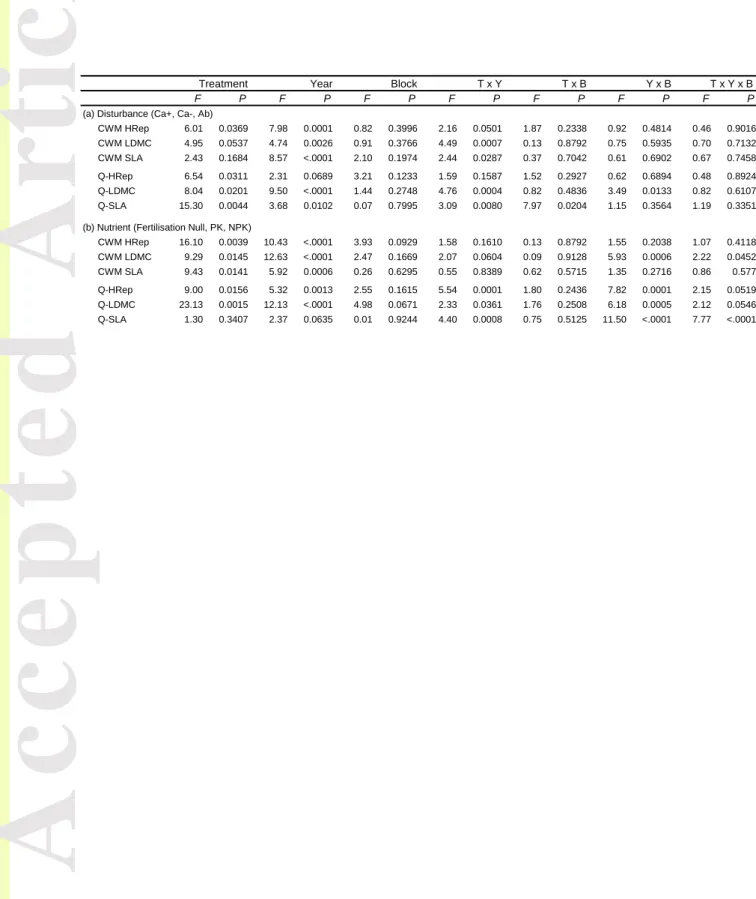
Table 2: Test of fixed effects (Treatment, Year, Block and interactions; F and P value) on community cumulated weighted mean (CWM) and Rao index (Q) on reproductive plant height (HRep), leaf dry matter content (LDMC) and specific leaf area (SLA) along (a) the disturbance gradient and (b) the nutrient gradient.
F P F P F P F P F P F P F P
(a) Disturbance (Ca+, Ca-, Ab)
CWM HRep 6.01 0.0369 7.98 0.0001 0.82 0.3996 2.16 0.0501 1.87 0.2338 0.92 0.4814 0.46 0.9016 CWM LDMC 4.95 0.0537 4.74 0.0026 0.91 0.3766 4.49 0.0007 0.13 0.8792 0.75 0.5935 0.70 0.7132 CWM SLA 2.43 0.1684 8.57 <.0001 2.10 0.1974 2.44 0.0287 0.37 0.7042 0.61 0.6902 0.67 0.7458 Q-HRep 6.54 0.0311 2.31 0.0689 3.21 0.1233 1.59 0.1587 1.52 0.2927 0.62 0.6894 0.48 0.8924 Q-LDMC 8.04 0.0201 9.50 <.0001 1.44 0.2748 4.76 0.0004 0.82 0.4836 3.49 0.0133 0.82 0.6107 Q-SLA 15.30 0.0044 3.68 0.0102 0.07 0.7995 3.09 0.0080 7.97 0.0204 1.15 0.3564 1.19 0.3351 (b) Nutrient (Fertilisation Null, PK, NPK)
CWM HRep 16.10 0.0039 10.43 <.0001 3.93 0.0929 1.58 0.1610 0.13 0.8792 1.55 0.2038 1.07 0.4118 CWM LDMC 9.29 0.0145 12.63 <.0001 2.47 0.1669 2.07 0.0604 0.09 0.9128 5.93 0.0006 2.22 0.0452 CWM SLA 9.43 0.0141 5.92 0.0006 0.26 0.6295 0.55 0.8389 0.62 0.5715 1.35 0.2716 0.86 0.577 Q-HRep 9.00 0.0156 5.32 0.0013 2.55 0.1615 5.54 0.0001 1.80 0.2436 7.82 0.0001 2.15 0.0519 Q-LDMC 23.13 0.0015 12.13 <.0001 4.98 0.0671 2.33 0.0361 1.76 0.2508 6.18 0.0005 2.12 0.0546 Q-SLA 1.30 0.3407 2.37 0.0635 0.01 0.9244 4.40 0.0008 0.75 0.5125 11.50 <.0001 7.77 <.0001 T x B Y x B T x Y x B Treatment Year Block T x Y
Version postprint
Accepted
Article
FIGURES
Figure 1: Principal response curves of the treatments, with initial situation in 2004 as control. Canonical coefficients and species scores are presented per block and per gradient. Disturbance gradient (a, b) with treatments cattle high level of utilisation (Ca+, ), cattle low level of utilisation (Ca-, ), abandoned plots (Ab, ). Nutrient availability gradient (c, d), with treatments without fertilisation (Null, ), fertilisation with P and K (PK, ), fertilisation with N, P and K (NPK, ). Ac Agrostis capillaris Ap Alopecurus pratense Ae
Arrhenatherum elatius Am Achillea millefolium Cf Cerastium fontanum Cg Cerastium
glomeratum Ch Cardamine hirsuta Dg Dactylis glomerata Er Elytrigia repens Fa Festuca
arundinacea Hl Holcus lanatus Lp Lolium perenne Pa Poa angustifoilia Pp Poa pratensis Pt
Poa trivialis Sm Stellaria media Tf Trisetum flavescens To Taraxacum officinalis Tr
Version postprint
Accepted
Article
Figure 2: Plant species richness and evenness per treatment, for each block and gradient, through time from 2004 (year before the start of the experiment) to 2012. The disturbance gradient (a, b, c, d) includes high level of herbage utilisation by cattle (Ca+, ), low level of herbage utilisation by cattle (Ca-, ) and abandonment (Ab, ). The nutrient availability gradient (e, f, g, h) includes treatments no fertilisation (Null, ), fertilisation with P and K (PK, ) and fertilisation with N, P and K (NPK, ). Significant differences according to the Tukey’s test (p<0.05) among the mean values at the treatment*block level are indicated by different letters in each year. Bars indicate standard error.
Version postprint
Accepted
Article
Figure 3: Community weighted mean values (CWM) of reproductive plant height (HRep), leaf dry matter content (LDMC), specific leaf area (SLA), per treatment for each block and gradients and through time from 2006 (first year after the start of the experiment) to 2012. The disturbance gradient (a, b, c, d, e, f) includes high level of herbage utilisation by cattle (Ca+, ), low level of herbage utilisation by cattle (Ca-, ) and abandonment (Ab, ). The nutrient availability gradient (g, h, i, j, k, l) includes treatments no fertilisation (Null, ), fertilisation with P and K (PK, ) and fertilisation with N, P and K (NPK, ). Significant differences according to the Tukey’s test (p<0.05) among the mean values at the treatment*block level are indicated by different letters in each year. Bars indicate standard error.
Version postprint
Accepted
Article
Figure 4: Rao index (Q) of reproductive plant height (HRep), leaf dry matter content (LDMC), specific leaf area (SLA) per treatment for each block and gradients and through time from 2006 (first year after the start of the experiment) to 2012. The disturbance gradient (a, b, c, d, e, f) includes high level of herbage utilisation by cattle (Ca+, ), low level of herbage utilisation by cattle (Ca-, ) and abandonment (Ab, ). The nutrient availability gradient (g, h, i, j, k, l) includes treatments no fertilisation (Null, ), fertilisation with P and K, (PK, ), and fertilisation with N, P and K (NPK, ). Significant differences according to the Tukey’s test (p<0.05) among the mean values at the treatment*block level are indicated by different letters in each year. Bars indicate standard error.