HAL Id: hal-01797013
https://hal.archives-ouvertes.fr/hal-01797013v2
Submitted on 11 Sep 2018
HAL is a multi-disciplinary open access
archive for the deposit and dissemination of
sci-entific research documents, whether they are
pub-lished or not. The documents may come from
teaching and research institutions in France or
abroad, or from public or private research centers.
L’archive ouverte pluridisciplinaire HAL, est
destinée au dépôt et à la diffusion de documents
scientifiques de niveau recherche, publiés ou non,
émanant des établissements d’enseignement et de
recherche français ou étrangers, des laboratoires
publics ou privés.
application in opportunistic networking
Adrián Sánchez-Carmona, Frédéric Guidec, Pascale Launay, Yves Mahéo,
Sergi Robles
To cite this version:
Adrián Sánchez-Carmona, Frédéric Guidec, Pascale Launay, Yves Mahéo, Sergi Robles. Filling in the
missing link between simulation and application in opportunistic networking. Journal of Systems and
Software, Elsevier, 2018, 142, pp.57 - 72. �10.1016/j.jss.2018.04.025�. �hal-01797013v2�
between Simulation and Application
in Opportunistic Networking
Adrián Sánchez-Carmona
1, Frédéric Guidec
2, Pascale Launay
2, Yves Mahéo
2, Sergi Robles
11: Universitat Autònoma de Barcelona (UAB) 2: IRISA (UMR 6074) / Université Bretagne Sud
Abstract—In the domain of Opportunistic Networking, just like in any other domain of computer science, the engineering process should span all stages between an original idea and the validation of its implementation in real conditions. Yet most researchers often stop halfway along this process: they rely on simulation to validate the protocols and distributed applications they design, and neglect to go further. Their algorithms are thus only rarely implemented for real, and when they are, the validation of the resulting code is usually performed at a very small scale. Therefore, the results obtained are hardly repeatable or comparable to others.
LEPTON is an emulation platform that can help bridge the gap between pure simulation and fully operational implementation, thus allowing developers to observe how the software they develop (instead of pseudo-code that simulates its behavior) performs in controlled, repeatable conditions.
In this paper we present LEPTON, an emulation platform we developed, and we show how existing opportunistic networking systems can be adapted to run with this platform. Taking two existing middleware systems as use cases, we also demonstrate that running demanding scenarios with LEPTON constitute an excellent stress test and a powerful tool to improve the opportunistic systems under test.
I. INTRODUCTION
Opportunistic networks constitute a category of mobile ad hoc networks in which the sparse or irregular distribution of mobile devices (or nodes) yield frequent link disruptions and network partitions [1]. In such conditions, the store, carry and forward principle of Delay Tolerant Networking (DTN [2], [3]) helps bridge the gap between non-connected parts of the network. Whenever a transient contact occurs between two nodes, this contact can be exploited opportunistically by these nodes to exchange messages. The messages received by a node during a contact are stored in a local cache, so they can be carried physically as the node is moving, and forwarded later to other mobile nodes.
Developing middleware and applications for opportunistic networks is a challenge, because message delivery is often not guaranteed, and because this delivery can be delayed by minutes, hours, or days, as it depends on the wanderings of benevolent mobile carriers. In order to meet this challenge developers must follow a rigorous procedure, that ideally should involve all the steps shown in Figure 1.
First comes the initial idea, the conception of the mecha-nisms. After this initial phase, the idea must be reified into a
particular model, which can then be analyzed formally. During this analysis, the mechanisms and procedures can be checked, some theoretical results can be obtained, and limitations can be identified. The next stage is typically simulation. In a simulator, the system can be tested in a given set of scenarios. Even if these scenarios involve datasets that come from the real world (e.g., traces of real taxi cabs, or positions of real people evacuating a stadium), or even if the simulator is assumed to simulate very accurately all the layers of the protocol stack, the system under evaluation is usually executed based on pseudo-code. This does not prove that the system being designed can eventually be deployed and used for real. Results obtained through simulation can be deceptive, creating a misleading feeling of scientific correctness. Indeed, as observed in [4], the credibility of simulation results tends to decrease as the use of simulation increases. The final validation of an opportunistic networking system should thus always be based on real full-featured code (accounting for example for memory management or concurrency issues), rather than on the pseudo-code used in simulations.
Testing real code in real conditions can be painstaking, or even impossible, especially when these real conditions involve the mobility [5] of hundreds of nodes over hundreds of hours. Emulation is an approach that can help with this respect, as it makes it possible to run real code in tightly controlled (and repeatable) conditions. The emulation stage can be seen as the missing link in the engineering process of most existing opportunistic networking systems. This stage is crucial to make sure that the code under test —with its bugs and limitations— is scalable, and that it can correctly integrate and interact with the other components of the system (such as users, for instance). Using an emulator, these properties can be verified under the desired conditions, and results can be reproduced and compared to others at convenience [6].
CONCEPTION Idea ANALYSIS Model SIMULATION Pseudo-Code EMULATION Real Code DEPLOYMENT Application
Figure 1. Engineering process of an opportunistic networking system. Briefly put, we could say that emulation is more apt than simulation to evaluate real code, and easier and cheaper than full-scale field experimentation. Therefore, we propose to complement (not to substitute) simulation and experimentation with emulation, hence putting the emphasis on an engineering step in the development of an opportunistic system that could
reveal itself especially useful as the complexity of this system grows.
In this paper we present LEPTON (Lightweight Emulation PlatTform for Opportunistic Networking), an emulation plat-form that has been primarily designed to allow the developers of opportunistic networking software (i.e., middleware and/or applications) to run their real software systems with simulated mobility. With LEPTON, an implementation can run in real time, either on a real device (e.g. smartphone, tablet, laptop) or on a virtual one.
LEPTON also constitutes an interesting demonstration tool, since participants in a demo session can use an opportunis-tic application deployed on smartphones or tablets, while a display screen shows the simulated mobility of all devices.
In this paper our main contribution is the description of LEPTON, our lightweight emulation platform for opportunis-tic networking. In order to show its usefulness, we also use it to compare two existing Opportunistic Networking (OppNet) middleware systems, using the same scenario and mobility traces.
The remainder of this paper is organized as follows. Related work is discussed in Section II. In Section III we provide an overview of LEPTON and of its salient features. In Section IV we present briefly the two OppNet systems we considered as use-cases for our proof of concept, and we explain how each system was adapted to be used with LEPTON. Experimental results are presented in Section V, and Section VI concludes this paper.
II. RELATED WORK
Simulation is the lightest approach to observe how oppor-tunistic networking protocols or applications can perform at runtime. General-purpose discrete event network simulators such as ns-2 [7], ns-3 [8], OMNeT++ [9], QualNet [10] or Riverbed Modeler [11] include modules that can simulate the mobility of nodes in a wireless network. Most of these sim-ulators implement standard wireless MAC layers (e.g., IEEE 802.11, 802.15.1, 802.15.4), and they can optionally simulate physical phenomena observed on the wireless medium, such as shadowing, free space path loss, fading, co-channel inter-ference, etc.
Because of its ease of use, the simulator ONE [12], [13] has become the tool of choice for simulating opportunistic networks. It supports a variety of mobility models, and contact or mobility traces such as those available in the CRAWDAD database [14] can be imported with little effort. Unlike many other simulators, ONE does not attempt to simulate the PHY and MAC protocol layers accurately. Communication is message-based, rather than packet-based or frame-based. A message is transferred between two nodes if these nodes are considered as neighbours at the time the message is sent. Optionally, the delivery of a message can be delayed so as to account for a set transmission bitrate. A commonly praised feature of ONE is that several of the major DTN routing pro-tocols (e.g., First Contact, Epidemic dissemination, Spray and Wait, MaxProp, Prophet) have already been implemented for this simulator, so they are immediately available for running
simulations. Yet these protocols are implemented in such a way that no control messages are ever exchanged between nodes during a simulation run. Comparing the results obtained in such conditions therefore makes little sense, as the overhead induced by control traffic is simply ignored.
A simulator is indeed a convenient tool for the developer of a new protocol or distributed algorithm, as simulation makes it possible to observe how this protocol or algorithm performs in a virtual setup in which everything is fully repeatable and controllable. This setup can include hundreds or thousands of nodes, which would hardly be practical in real settings. Yet the validity of results obtained with a simulator is always debatable, for every single part of a simulated system can be deemed as being not realistic enough. For example, the mobility models used in simulators can hardly reproduce the diversity of real mobility patterns. Usually, this is mitigated by using contact or mobility traces instead of pure algorithmic models, but these traces have often been captured in very specific conditions (e.g., people moving around in a conference building, taxi cabs roaming city streets, etc.). Radio channel modeling is also debatable, as models cannot mimic all the complexity of real wireless medium characteristics, such as radio wave reflection on obstacles (e.g., walls, furniture, etc.) or interferences due to neighbouring electronic devices. However, the main drawback is that the protocols or distributed algorithms tested in simulators are often coded as pseudo-code (it is not possible to execute the real code in a discrete event-driven simulation), and are thus significantly simpler than the real code that could be deployed on real mobile devices. With discrete event simulators, the time required to react to an event is neglected, for event processing is performed atomically. When developing code for real execution, though, attention must be paid to ensuring that concurrent events can be processed as smoothly and efficiently as possible.
Since simulation results can only provide an indication of how a system should perform in real life, testing this system in real conditions is the ultimate way to confirm that it indeed performs as expected. Yet running experiments in real con-ditions requires deploying testbeds, possibly at a large scale. While everything is virtual in a simulation, everything is –or at least should be– real in a testbed. Indeed, a testbed is simply a perfectly normal instance of the system that is under study in a particular experiment [15]. Running experiments in a testbed offers the greatest degree of realism (since everything is running “for real”), but deploying and managing hardware and software in a testbed is a costly and time-consuming endeavor. To the best of our knowledge no large testbed has ever been deployed specifically for opportunistic networking, besides DieselNet, which itself was part of the DOME testbed [16]. Some general-purpose large-scale network testbeds such as ORBIT [17] can support mobile nodes, though.
Simulation and testbeds lie on opposite ends of the ex-perimentation spectrum. Simulation allows repeatability, tight control, large scale, and cost-effective tests. But because of the high level of abstraction it offers, most results it produces should only be considered as qualitative assessments [18]. In contrast, the drawbacks of experiments conducted in testbeds are the lack of repeatability and tight control, as well as limited
scalability.
Emulation fits between simulation and testbeds, as it in-volves real elements used along with simulators. Several emulation systems for mobile ad hoc networks have been proposed during the last decade. As a general rule, the mobility of network nodes and transmissions on the wireless medium are simulated, and network nodes are either physical nodes ([19], [20]) or virtual nodes ([21], [22]), or a mix of both kinds of nodes.
Using node virtualization makes it possible to run experi-ments involving large populations of nodes. For this reason, virtualization is also used in many testbeds (which thus cease to be pure testbeds) as a means to provide scalability.
With node virtualization, the code that should normally be executed on a pool of real distinct mobile devices is instead executed in virtual (fixed) machines. The TUNIE emulation testbed [21] thus uses a XEN virtual machine hypervisor to coordinate virtualized OppNet nodes. Similarly, EmuS-tack [22] uses the Docker container technology, MoViT [23] uses KVM (Kernel-based Virtual Machine), and HYDRA [24] uses VirtualBox.
Whether using real or virtual nodes, the code running on each node includes application code, possibly some mid-dleware implementing high-level protocols and services, and the OS with its entire protocol stack. Instead of sending and receiving frames directly through a wireless interface, though, a virtual interface is created (using for example the TUN/TAP driver) in order to intercept traffic at either packet or frame level. This traffic is then tunneled to a centralized controller whose role is to simulate the wireless medium. This controller drives the communication between all network nodes according to their simulated mobility. In EmuStack, standard Unix utilities such as Netfilter (iptables) and Traffic Control (tc) are used to control and shape the traffic between pairs of nodes, thus simulating network connectivity and radio channel conditions. In MoViT and HYDRA, traffic shaping is not performed by a centralized controller, but each virtual node processes its own outgoing traffic locally, based on di-rectives received from a coordination system [23]. In TUNIE, traffic flows through OpenFlow-enabled Ethernet switches and wireless access points, that delegate forwarding decisions to a remote controller [21], [24]. In TWINE [25], which is focused on studying cross-layering techniques, an emulation layer is inserted directly in the Linux kernel, between the network layer and the device driver. This additional layer includes several components that simulate for example mobility and wireless propagation. In [26], a static-grid testbed is used, and it is application code that moves from node to node in the grid in order to simulate the mobility of devices.
In TROWA [20], APIs are provided at application, transport and network layers. Using these APIs, applications or proto-cols running on real or virtual devices can send all traffic to a mobile network simulator, this traffic being tunneled via TCP. HINT [27] uses a quite similar approach, as it defines a User Link Layer (ULL) that abstracts communication be-tween applications (running on real devices) and a centralized mobile network simulator. In both cases, the code that must be tested must be modified, since instead of using standard
LEPTON
LEPTON
LEPTON
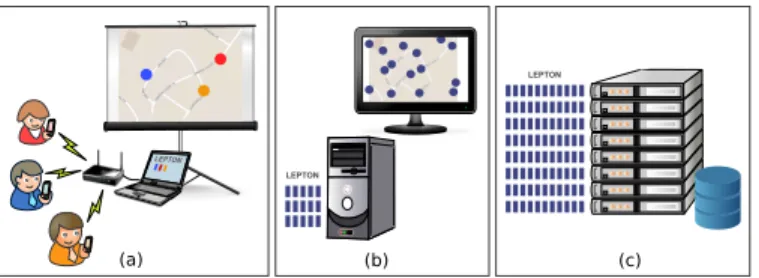
(a) (b) (c)
Figure 2. LEPTON’s main deployment modes: a) Demonstration session using real devices; b) Small-scale experiment on a single workstation; and c) Large-scale experiment on a cluster of workstations.
communication APIs (such as TCP or UDP sockets) it must use those provided with the emulation system.
All the above-mentioned emulation systems, except
TROWA and HINT (that require to use their specific communi-cation API), require either specific hardware (e.g., OpenFlow-enabled devices), a specific software environment (e.g., virtual machines or containers, or a modified OS kernel), and some-times a combination of specific hardware and software. In fact most of these systems are actually testbeds extended with node and link virtualization. For the developer of an opportunistic networking protocol or algorithm, accessing one of these testbeds or deploying an equivalent platform for testing his/her code is hardly an option, at least not for early experimentations while the code is still under development. A lighter solution is needed, even if using this solution implies trading off a bit of transparency and accuracy, against availability and ease of use.
The LEPTON emulation platform is meant to provide this solution. LEPTON is a lightweight, easily deployable emulation platform that does not require exotic networking equipment, and that does not even require deploying and managing virtual machines on one or several hosts. Besides, it is openly distributed and documented, so it is readily available for any interested user. A simple laptop or desktop workstation running Linux can easily support emulation-based experiments involving up to a couple hundred nodes, and larger experi-ments can be run on any cluster of Linux machines.
III. THELEPTONEMULATION PLATFORM
LEPTON is implemented as Java code, and it is distributed under the terms of the GNU General Public License. Its prime function is to simulate the mobility of nodes in an oppor-tunistic network while conducting transmissions between these nodes based on their relative positions. Being an emulator rather than a simulator, LEPTON drives the communication between full-featured instances of an OppNet system, each instance determining the behaviour of one node during the simulation. In the remainder of this paper we will use the term System Node (SN) to refer to an instance of the OppNet system. SNs are not a part of LEPTON, but of the system under evaluation. An SN is typically composed of application code combined with communication middleware, which itself requires to run on top of a standard protocol stack. An SN can be executed on real devices, such as smartphones, tablets, or wireless sensors (see Fig. 2.a). The ability to
LEPTON Node A Middleware Application Node B A B C E D F API Software Hub Protocol stack Middleware Simulation Engine Real traces Mobility models Node C Node D Node E
Figure 3. Multiple nodes interacting with LEPTON. Nodes interact through the software hub, which itself is controlled by the simulation engine that models the mobility of the nodes.
run experiments involving real devices makes it possible to confirm that the software being tested can indeed run smoothly on such devices. It also comes in handy in demo sessions, since attendees can then use real devices that implement the system that is being presented, while observing on a display screen what would be the effects of mobility... if they were actually moving.
When an experiment must involve a large number of SNs, running the system under test on real devices is often imprac-ticable. Multiple SNs can then be executed concurrently on a single desktop workstation (Fig. 2.b), or on the nodes of a computer cluster (Fig. 2.c). The important point here is that the code implementing each SN is not pseudo-code, but full-featured code that would run equally well on a real mobile device.
In any case, the role of LEPTON is to simulate the mobility of the SNs and to control the communication between them accordingly.
Since interacting with real instances of an opportunistic system cannot be done in a discrete-event simulator, LEPTON has been designed to emulate the mobile network in real time, moving nodes either according to a given mobility policy, or based on mobility or contact traces.
A. General architecture
Every LEPTON’s experiment involves the network emulator and System Nodes (SNs), as shown in Fig. 3. The SNs are not part of LEPTON: they are implementations of the system to be tested (more details in Section IV). The emulator itself is structured in two main parts: a simulation engine and a software hub. The simulation engine determines if any pair of nodes should be considered as neighbours at any specific time during an experimentation run. The software hub plays approximately the same role as a switched hub in an Ethernet LAN: it relays every message it receives from an SN to its destination, and to that destination only. Yet in order to decide whether this destination is indeed accessible, the hub must consult the simulation engine.
...
st 8500 // Time step (ms)
an N1 x=87.90 y=50.20 // Add N1 an N2 x=87.80 y=51.60 // Add node N2 ae E1-2 N1 N2 // Add edge N1-N2 ...
st 13200 // Time step (ms)
cn N1 x=76.00 y=50.20 // Change node (N1 has moved) cn N2 x=69.80 y=50.40 // Change node (N2 has moved) ...
st 27600 // Time step (ms)
cn N1 x=66.40 y=47.20 // Change node (N1 has moved) cn N2 x=64.20 y=37.40 // Change node (N2 has moved)
de E1-2 // Delete edge N1-N2
...
st 120600 // Time step (ms)
dn N1 // Delete node N1
...
Figure 4. Illustration of the DGS file format.
B. The simulation engine
The role of the simulation engine is to model the wireless network as a dynamic graph, whose nodes represent SNs, and whose edges represent radio links between SNs. The imple-mentation of this dynamic graph in the simulation engine relies on facilities offered in the GraphStream library [28], which provides elaborate data types and algorithms for dynamic graph modelling, analysis, and visualization. The simulation engine is also responsible for driving the dynamics of the graph according to a given mobility model, or based on mobility and/or contact traces.
Several traditional mobility models (Random Waypoint, Levy Walk, Map-based mobility, etc.) have already been implemented for LEPTON, and new models can be included as and when needed. A manual mobility model is available, that is especially useful in demo sessions. With this model, nodes do not move spontaneously, but the dynamic graph that represents the connectivity between nodes can be adjusted manually by dragging and dropping nodes and edges on a display screen.
LEPTON can also run experiments based on pre-defined mobility or contact scenarios. In that case, the simulation engine simply reads a DGS file, whose format is described in the next section.
The simulation engine can calculate radio contacts at run-time (i.e., while running an experiment). Alternatively, these contacts can be calculated in advance and be inserted in the DGS file that will be played during an experiment. Radio contact between two mobile nodes is determined by a user-defined function. The default function is very simple: two nodes are in radio contact if they are within a fixed distance of each other. Yet this simple function can be replaced by a more accurate one (accounting for obstacles for example) as desired.
A file format for dynamic graphs : The GraphStream library defines an event-oriented file format called DGS (Dy-namic Graph Stream) for describing dy(Dy-namic graphs. With this format the evolution of a graph is described using events such as adding, deleting or changing a node or an edge, as illustrated in Figure 4. Reading a DGS file, therefore, comes down to reading a stream of such events.
mobil-ity model, rather than by reading a pre-defined DGS file, LEPTON can record all graph events in DGS format, thus recording how nodes have appeared or disappeared during the experiment, how they have moved, and how radio contacts have been established and lost between neighbour nodes. The resulting DGS file can then be used to repeat the experiment as and when needed.
C. The software hub
In a real mobile network, neighbour SNs can exchange mes-sages directly with one another. When running an experiment with LEPTON, each message sent by an SN must be directed through the software hub. Interfacing an existing opportunistic system with LEPTON therefore requires:
1) Making sure that all SNs explicitly redirect their traffic to the software hub, which from their viewpoint will be seen as some kind of a proxy.
2) Developing an appropriate software hub for that system, and making sure that this hub will consult the simulation engine in order to decide what to do about each message received.
The first requirement is usually easy to meet. Instead of sending beacons to a multicast group, and gossiping with peers through unicast communication, each SN must redirect its transmissions explicitly to the software hub. Depending on the opportunistic system considered, this may require changing slightly the code of SNs, or simply changing a parameter in a configuration file.
Developing a dedicated software hub for a system may require a little more work, but since most existing systems rely on UDP and TCP for their transmissions1, LEPTON comes with Java templates that can be easily adapted to fit the needs of a particular system. These templates are presented briefly below and illustrated in pseudo-code.
LEPTON can also support opportunistic systems that use non-IP transmissions (e.g., Bluetooth, XBee, ZigBee). How-ever, interfacing with such a system requires developing a specific software hub for the transmission technology.
Forwarding UDP traffic: The general behaviour of the software hub regarding UDP traffic (which is often used for beaconing) is depicted in Alg. 1. Upon receiving a datagram, the hub learns about the identity, IP address, and port number used by the sender’s beaconing service (lines 1 and 2). The information thus collected is stored in a registry (line 4), so it can later be used to forward messages to that SN. With some opportunistic systems, the datagram may contain an indication of the TCP port number the sender’s gossiping service is listening to. In that case, this port number must be replaced in the datagram by the port number of the TCP socket the hub is listening to (line 6), so the target SN can later open a gossiping session through the hub rather than directly with a peer SN. These operations may be omitted in systems that do not rely on TCP-based gossiping, or that systematically use the same number for UDP and TCP ports.
1Many opportunistic systems implement a neighbour discovery mechanism
based on UDP multicast or broadcast, while the exchange of control and data messages between neighbour nodes is based either on UDP or TCP.
Every datagram received from an SN can then be forwarded to all neighbours of the sender, the list of these neighbours being provided by the simulation engine. Note that Alg. 1 allows datagrams to be addressed either in unicast mode to a single neighbour (lines 13-14), or in broadcast (lines 8-9) or multicast (lines 10-12) mode. In all cases, the software hub delivers a copy of the datagram to any SN that is identified as a receiver for this datagram (lines 18-21).
Algorithm 1 Processing of UDP datagrams received by the software hub
1: upon receiving beacon from (@ip, udpPort)
2: extract (idsrc, idtgt, [tcpPort]) header from beacon
3: // Record (or update) sender’s info in registry 4: peerRegistry.put(idsrc, @ip, udpPort, [tcpPort])
5: if tcpPort != null then
6: substitute tcpPort by localTcpPort in beacon 7: // Look for targets
8: if idtgt == broadcast then
9: target = SimulationEngine.getPeers(idsrc)
10: else if idtgt == multicast then
11: allPeers = SimulationEngine.getPeers(idsrc)
12: target = filterMulticastPeers(allPeers, idtgt)
13: else if SimulationEngine.arePeers(idsrc, idtgt) then
14: target = {idtgt}
15: else
16: target = {}
17: // Iteratively send to all targets 18: for id in target do
19: if peerRegistry.contains(id) then
20: (@ip, udpPort) = peerRegistry.get(id)
21: send beacon to (@ip, udpPort)
Forwarding TCP traffic: When message passing is based on TCP sessions, the situation is a bit more tricky (Alg. 2). Indeed, when a contact is established in “real life” between two SNs, a TCP session is established directly between these nodes, and all subsequent messages are then exchanged via that TCP session. Depending on the characteristics of the OppNet system considered, such a TCP session is maintained either as long as possible (i.e., until the contact is disrupted), or only for the duration of the transaction. When running in emulation mode, an SN that wishes to start gossiping with another SN must actually open a TCP session to the software hub, which in turns opens another TCP session to the target SN, provided the simulation engine confirms that the target SN is a neighbour of the initiator. Two TCP sessions must thus be maintained by the hub for each pair of neighbour SNs that are engaged in gossiping, the hub ensuring that everything it receives from one SN is forwarded to its peer (line 18), with the simulation engine’s assent (line 16). When one of these SNs decides to close the session opened (through the hub) with its neighbour (line 21), both TCP sessions are closed simultaneously by the hub (line 22). Likewise, if the hub receives something from an SN and learns from the simulation engine that the target peer is not a neighbour of the sender anymore, then both TCP sessions are closed (line 20). Note that the software hub should never close TCP sessions
authoritatively as soon as the contact is lost between two SNs, because a TCP session can be maintained between two hosts even when there is no connectivity between them, as long as no attempt is made to transfer data via that session. Closing TCP sessions authoritatively as soon as the contact is lost between two SNs would introduce a bias, since TCP sockets would be closed earlier during emulation-based experiments than in real life. The initiative to close a TCP session must therefore always be taken by an SN, not by the software hub.
Algorithm 2 “Bridging” between two TCP sessions by the software hub
1: main
2: upon receiving opening request from (@ip, tcpPort)
3: iSocket = accept incoming session
4: extract (idsrc, idtgt) header from input stream
5: // Check that idtgt is a neighbour of idsrc
6: if SimulationEngine.arePeers(idsrc, idtgt) then
7: (@ip, tcpPort) = peerRegistry.get(idtgt)
8: oSocket = open session with (@ip, tcpPort)
9: spawn StreamManager(iSocket, oSocket)
10: spawn StreamManager(oSocket, iSocket)
11: else
12: close incoming session
13: thread StreamManager(iSocket, oSocket) 14: upon receiving data from iSocket
15: // Check that idsrc and idtgt are still neighbours
16: if SimulationEngine.arePeers(idsrc, idtgt) then
17: (@ip, tcpPort) = peerRegistry.get(idtgt)
18: forward data to oSsocket
19: else
20: close both sockets
21: upon receiving close request from iSocket or oSocket
22: close both sockets
Algorithms 1 and 2 describe the general behaviour of a software hub that can fit most opportunistic systems, provided these systems rely on UDP for beaconing, and either UDP or TCP for gossiping.
Consideration about the software hub: In order to im-plement a software hub that uses a different communication technology, the only parts of the templates that need to be modified are those that extract meta-information from UDP datagrams (line 2 in Alg. 1), or from the input stream in TCP sessions (line 4 in Alg. 2).
Moreover, since all traffic must flow through the software hub during an experiment, the workload imposed on the node running that hub can be high. It is legitimate to wonder if this node may constitute a bottleneck at runtime. Fortunately, measurements confirm that both the CPU workload and net-work throughput observed on that node remain quite low (more details in Section V). For very large experiments, several software hubs could be instantiated to distribute the workload. These hubs would then only communicate together to update the state of their registry (as presented in [29]).
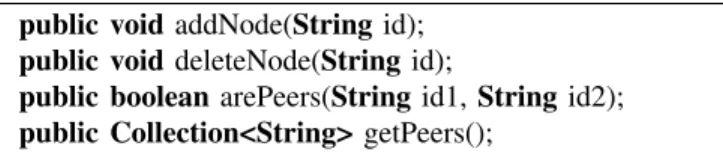
The simulation engine API: The API used by the software hub to interface with the simulation engine is quite simple
public void addNode(String id); public void deleteNode(String id);
public boolean arePeers(String id1, String id2); public Collection<String> getPeers();
Figure 5. API that allows the software hub to interact with the simulation engine.
(Fig 5). With functions addNode and deleteNode the hub can notify the simulation engine that it has detected the presence or the loss of an SN. Upon receiving a message from an SN, the software hub can also consult the simulation engine in order to determine what to do about this message. The software hub can thus either check that the message’s destination node is currently a neighbour of the source node (using function arePeers), or it can obtain the list of all current neighbours of the sender (using function getPeers).
Considerations about the addressing scheme: When de-veloping a software hub for an opportunistic system, special attention should be paid to the addressing scheme used in this system. Indeed, redirecting all messages to the hub implies that identifiers for the source and destination of a message should be included in the message itself. An IP address, for example, cannot be used to identify the actual source or destination of a message, since this message will first be sent to, and then received from, the software hub. Fortunately, most opportunistic systems use a high-level addressing scheme, based for example on textual node ids, which provides the required decoupling between “network-level” addresses (such as IP addresses) and “system-level” addresses (such as node ids). LEPTON can thus relate the messages received by the hub to the mobile nodes whose whereabouts are determined by the simulation engine.
D. Modes of operation
LEPTON supports several modes of operation that can be applied to the two following types of experiments:
• An experiment involving real devices: when real devices (and thus, possibly, real users) are involved during an experiment (see Fig. 2.a), LEPTON must discover the presence of each device at runtime. Upon receiving a message (typically a beacon) from a new device, the software hub notifies the simulation engine about this discovery. The simulation engine then adds a node to the dynamic graph it maintains and starts moving this node according to a pre-defined mobility model (Random Waypoint, Levy Walk...). A mobile device is considered as “lost”, and is thus removed from the dynamic graph, if the software hub does not receive any message from that device for a while. This mode of operation is very useful during demo sessions, when the dynamic graph is displayed in real time on a screen, so the users can observe how they are assumed to “move”, as seen from the simulation engine’s viewpoint. This mode is also useful to obtain energy consumption measurements of the protocols under evaluation while they are executed on real devices.
• An experiment involving virtual nodes: in the absence of real devices, each SN runs as a Unix process containing at least the implementation of an opportunistic networking system and of the application code. This application code is the real application code, unless the application is interactive (in this case a simulated user’s behaviour must obviously be added). As with real devices, the software hub discovers the presence of every node when their first message is received, and it notifies the simulation engine to add it to the dynamic graph. Hundreds of nodes can be executed on a single desktop workstation or laptop, as shown in Fig. 2.b). When the number of virtual SNs is very large, these SNs can be distributed on the nodes of a computer cluster (Fig. 2.c), with a distribution based on a round-robin policy, so the workload is statistically balanced between all cluster nodes.
When the experiment involves a stable population of SNs, multiple SNs can be created by LEPTON at the beginning of an experiment. Alternatively, the lifecycle of the SNs can be dictated by a DGS file. SNs are then created and terminated dynamically, according to the events observed in that file. While reading the file the simulation engine can trigger the creation or termination of an SN at the appropriate time.
These modes of operation can be combined when neces-sary. For example, an experiment may involve virtual nodes (running as concurrent processes on a host platform) as well as real nodes (running on real devices), thus scaling up to a large population of nodes, while creating, terminating and simulating the mobility of these nodes according to a DGS file.
E. Visualization
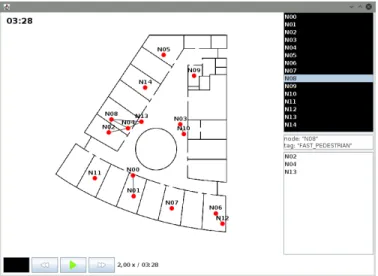
The GraphStream library provides advanced support for graph visualization. LEPTON can use these features to display the evolution of the wireless network (see Figure 6). This visu-alization can be done on-the-fly while an experiment is running (which provides for nice demo sessions), when replaying an experiment, or in order to produce videos. Examples of such videos are available on LEPTON’s web page2.
Replaying a simulation consists in reading the DGS file that has been produced earlier during an experiment. This can be done at any desired speed, including step by step, and it makes it possible to observe what has happened in the network at a specific time during the simulation. The history of the radio contacts of a specific node can, for example, be retraced that way. Moreover, when the information contained in the DGS file is combined with middleware-level or application-level information gathered from execution logs, advanced analysis can be performed. For example, the multi-hop propagation of a specific message during an experiment can be observed in detail.
2http://www-casa.irisa.fr/lepton/videos.html
Figure 6. Snapshot of LEPTON’s GUI during an emulation run involving 15 devices moving in an office floor, assuming a transmission technology with very short transmission range (in that case, 5 meters). The SNs are depicted as red dots, and the thin black lines depict radio links.
F. Additional tools
In addition to the simulation engine and the software hub, LEPTON comes with a set of tools that can be used either when preparing an experiment, or after an experiment has been conducted. This toolset notably includes format converters to manipulate traces, as well as programs that can be used to analyze a mobility scenario.
Input and output of trace sets: Mobility or contact trace sets such as those available in the CRAWDAD database [14] can be converted to the DGS file format used by LEPTON. Converters are notably available for trace sets that use the file formats defined for well-known simulators (e.g., ONE, Legion), but ad hoc converters can also be devised for trace sets that use exotic formats.
Sometimes the trace set considered as input contains in-formation about both node mobility and radio contacts, but sometimes it only contains information about node mobility. In the latter case programs available in LEPTON’s toolset can be used to calculate radio contacts, so information about these contacts gets inserted directly in the output DGS file. When reading such a file, LEPTON’s simulation engine will simply drive communication according to these pre-calculated contacts, rather than calculating them at runtime.
Analysis of mobility/contact scenarios and experimental results: Several programs provided in LEPTON’s toolset make it possible to analyze a mobility scenario in details (based on the corresponding DGS file), but also the log files pro-duced during an experiment. With these programs traditional statistical results about the number of nodes, of neighbours, of contacts and inter-contacts, etc. can be produced easily.
The toolset also includes analysis tools that make it possible to investigate a scenario, or the results of an experiment, at a very fine grain. The dissemination of a single message can for example be examined in details, or the evolution of the neighbourhood of a single node. With such tools, the results produced by different experiments (run with the same
scenario) can be compared, and these results can also be compared with the theoretical behaviour that can be expected from the system under test. Predicting the expected behaviour of the system under test is indeed an important feature of LEPTON’s toolset, as it provides a reference to which actual results can be compared.
LEPTON’s toolset implements an algorithm that can deter-mine the propagation horizons of messages [30]. Basically, the horizon of a message sent at (S, tS) is the set of all
potential receivers for that message, considering the evolution of the network graph starting from tS. A node R is a potential
receiver for a message sent at (S, tS)if there exists at least one
journey (or temporal path) from (S, tS)to (R, tR), with tR≥tS.
Computing the horizon of a message therefore provides input about the “ideal” propagation of that message. It also provides a reference to which the actual propagation of the message, as reported in log files, can be compared after an experiment. An illustration of how this algorithm helps analyze experimental results is provided in Section V.
IV. INTEGRATING OPPORTUNISTIC SYSTEMS WITH
LEPTON
Wireless network emulation with LEPTON is expected to be an excellent way to validate the code of a full-featured opportunistic system, as well as a way to compare the perfor-mances observed with different systems in similar conditions. In order to confirm this expectation, two existing systems have been tested using LEPTON, using the same mobility scenario and the same application scenario.
These two systems were chosen for three reasons: 1) be-cause they can both support content-based networking3, that is, a model where information flows towards interested receivers rather than towards specifically set destinations; 2) because the two systems use a similar communication pattern, as they rely on UDP beaconing for neighbour discovery, and on TCP sessions for the gossiping; and 3) because they have originally been designed and implemented by two different research groups, targeting different kinds of hardware, so they may require slightly different adaptations in order to interface with LEPTON.
While considering these two systems, our main objective is not to compare them, but to show how different systems can be adapted to run with LEPTON4.
In the remainder of this section we present the two systems, and we explain how we developed the SN (and the required software hub) we used to evaluate each system through LEP-TON.
A. DoDWAN
DoDWAN (Document Dissemination in mobile Wireless Ad hoc Networks) is an open-source middleware system that can support content-based networking [33] in partially or
3LEPTON can also support destination-based OppNet systems: an adapter is
already available for IBRDTN [31], and another adapter is under development for DTN2 [32].
4Further details about this integration process are available on http://
www-casa.irisa.fr/lepton/doc/howtos/emulated_nodes.html.
intermittently connected wireless networks [34], [35]. It is implemented as Java code, and it is distributed under the terms of the GNU General Public License, together with documenta-tion for users and developers5. Binaries of an application suite
based on DoDWAN are also available as a demonstrator for Android smartphones and tablets [36].
Application services running on a mobile device can interact with DoDWAN through a pub/sub (publish/subscribe) API. The objects that can be published and subscribed for through this API are called documents. A document is basically a payload, and meta-information characterizing this payload (content type, author(s), production date, keywords, etc.).
In order to be able to receive documents, an application service must first subscribe with DoDWAN, and provide a selection pattern that characterizes the kinds of documents it is interested in. When several application services run on the same host, their selection patterns together define the host’s interest profile. DoDWAN uses this profile to identify documents that must be exchanged whenever a radio contact is established between two hosts.
A gossiping algorithm drives interactions between neigh-bour nodes in an opportunistic way, leveraging every radio contact between two nodes to allow these nodes to exchange documents according to their respective interest profiles. This gossiping algorithm takes inspiration from the Autonomous Gossiping (A/G) algorithm [37], which itself defines a selec-tive version of the epidemic routing model proposed in [38]. In DoDWAN’s gossiping algorithm, though, special attention has been paid to avoiding any unnecessary transmission be-tween neighbour hosts, while ensuring maximal reactivity to connectivity changes observed on the wireless channel.
DoDWAN is most commonly used with Wi-Fi interfaces running in either managed or ad hoc mode. Over the last few years it has also been tested with a variety of alternative wireless technologies, such as Bluetooth, XBee, and VHF battlefield radios used in military tactical networks [39].
Integration of DoDWAN with LEPTON: Since DoDWAN
can rely on different kinds of wireless technologies, no as-sumption is made about the format of the addresses used to identify mobile hosts at data link or network level. Indeed, assuming that a node is always identified by an IP address would be contrived when running for example with Bluetooth or XBee radio modules. DoDWAN’s implementation therefore assumes that each wireless host is identified by a unique identifier, expressed as a character string. This identifier is embedded in the beacons used for neighbour discovery, and in the messages used in gossiping transactions.
Developing a software hub capable of receiving and for-warding traffic for DoDWAN nodes, based on the templates presented in Section III-C, is therefore straightforward. Be-sides, no modification of DoDWAN’s source code is required to redirect all transmissions to this software hub. This is because the configuration file that determines how a DoDWAN node should interact with peer nodes is quite flexible. For example the IP addresses and port numbers used for the bea-coning and gossiping services are defined in that configuration
file (assuming IP is used), so redirecting all transmissions to a software hub only requires changing that file.
B. Active-DTN
The variety of routing protocols defined for mobile and opportunistic networks over the last decades suggests that no general-purpose routing strategy can satisfy the requirements of all applications at once. Active-DTN (or aDTN for short) is a Bundle Protocol [40] compliant open-source middleware system that can help meet the different needs of multiple applications that share the same wireless network, by allowing these applications to specify how their messages should be processed while traversing the network [41]. aDTN extends the structure of bundles so they can carry routing code together with plain data. More specifically, aDTN messages use the Mobile code Metadata Extension Blocks (MMEB, defined in RFC 6258 [42]) to carry their own routing code, lifetime control code and bundle prioritisation code. These codes are executed by any node that receives a bundle, in order to decide what neighbours the bundle should be forwarded to, if it should be dropped instead, and the priority it must receive. The system has been implemented in C++, and it is distributed with libraries that allow the development of DTN applications in C, Java, or Python.
Active-DTN was designed to demonstrate the feasibility of this paradigm of bundles that carry executable codes, and to obtain data from low-scale field experiments. Several such experiments have been run successfully on the Autonomous University of Barcelona (UAB) campus, involving up to 10 Raspberry Pi nodes that were carried either by pedestrians, bus shuttles, cars, and a drone.
Integration of aDTN with LEPTON: By default aDTN uses UDP multicast for neighbour discovery and TCP sessions for the transfer of bundles between neighbour nodes. The main difference with DoDWAN with that respect is that a transient TCP session is established whenever a bundle must be transferred between two aDTN nodes, while a single TCP session is maintained between two DoDWAN nodes as long as these nodes are neighbours.
The software hub needed to interface aDTN with LEPTON simulation engine was developed by making small adaptations to the templates presented in Section III-C.
Additionally, as aDTN is not as configurable as DoDWAN, the code of the aDTN system had to be slightly modified, so that an aDTN node could redirect the messages to the software hub. First of all, the neighbour Discovery module was modified so this module could listen to a UDP socket bound to a unicast address, rather than to a multicast address. Conversely, the beacons sent through that socket are addressed to the hub, rather than to a multicast group.
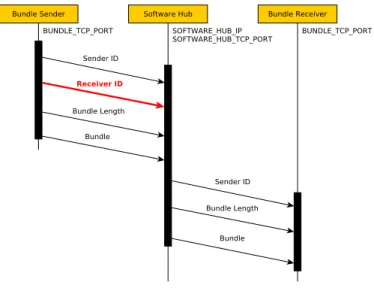
The Bundle I/O module was also modified so that messages sent to the hub carry the identity of their real destination. In the original implementation of aDTN, bundles sent directly to a neighbour node are preceded by a short header that only specifies the sender’s ID and the bundle’s length. The ID of the receiver node is not specified since this is by construction the node that receives the message. However, when a bundle is
Figure 7. Sequence diagram of the relay of one bundle by the software hub between an aDTN node and a neighbour. The Bundle I/O module was modified to add the receiver ID to every message, because the software hub requires it to know the intended destination.
relayed through the software hub, the header that precedes a bundle must be extended so the ID of the receiver is also specified in the message’s header. Figure 7 illustrates this process.
V. LEPTONIN PRACTICE
As explained in Section I, the engineering process of any OppNet system (after the initial design and modeling phases) should ideally include a simulation phase (possibly based on pseudo-code), an emulation phase (based on real code), and ultimately a deployment phase (in a real-life setting, with real devices and, possibly, real users). In order to demonstrate that none of these phases should be neglected, we show in this section that submitting an OppNet system to a stress-test in an emulation platform such as LEPTON is an excellent means to pinpoint weaknesses that would not necessarily appear with a discrete-event simulator. We also show that, unlike a simulator, an emulation platform can provide testing conditions that closely mimic real-life conditions.
In Section V-A we first present the scenario we defined to evaluate the two OppNet systems (DoDWAN and aDTN) presented in the former section. In Section V-B we present results we obtained after simulating both DoDWAN’s and aDTN’s behaviours with the ONE simulator. We then present in Section V-C the results obtained after running the im-plementations of both OppNet systems with LEPTON, and show that unlike pure simulation, emulation helped differen-tiate these systems, and pinpoint and correct an unexpected weakness in aDTN’s code. Finally, in Section V-D we describe a small-scale field experiment we performed with mobile devices running DoDWAN, and show that this scenario could be reproduced very accurately with LEPTON.
Figure 8. Overview of the subway station. There are two different levels that are connected between them by a pair of stairs (depicted with dotted lines).
A. Scenario considered for both simulation and emulation runs
Mobility scenario: For this evaluation we used mo-bility traces available in the CRAWDAD database [14], in the kth/walkers dataset [43]. This dataset includes mobility traces that have been produced using the Legion Studio simulator [44], for both an outdoor scenario (pedestrians in the Östermalm area of central Stockholm) and an indoor scenario (pedestrians in a two-level subway station) [45]. We selected the subway scenario, that comes pre-defined with Legion Studio, and that models a train platform connected via escalators to the upper entry-level (see Fig. 8). Pedestrians can arrive from several entry points of the subway station, or when trains arrive at the platforms. They can likewise leave the station through an exit point, or by boarding a train. In the trace set the location of each walker is defined every 0.6 seconds, and the trace set covers exactly one hour.
This scenario is interesting because, unlike many scenarios based on algorithmic mobility models, it involves a contin-uously changing population of mobile nodes that move in a relatively restricted area (1921 m2). Indeed, most walkers
that enter the station only stay there for a few minutes. The challenge when considering such a scenario for wireless network emulation is that instances of mobile nodes must be created and deleted continuously during the whole duration of an experiment. Besides, the density of mobile nodes in the subway station is high, for each node can be in radio contact with dozens of other nodes at any time, even when considering a short radio range.
The subway station scenario is analyzed in detail in [45] (assuming 10 m and 30 m radio range) and in [46] (assuming 10 m and 50 m radio range). For our evaluation, we only considered the 10-meter range. Since the kth/walkers dataset only provides information about nodes positions, one of the programs available in LEPTON’s toolset was used to pre-calculate radio contacts, thus producing a DGS file containing both nodes positions and radio contacts.
Application scenario: Besides the mobility scenario, we have defined the following simple topic-based application scenario (topic-based messaging can be considered as the simplest form of content-based networking). The messages produced during the experiment will pertain to five different topics, numbered 0 to 4, each message about a single topic. Each mobile node is assumed to be interested in only one topic, and is thus willing to receive and forward only messages about that topic. The population of mobile nodes is thus split into five distinct groups, each group including all nodes that share an interest for the same topic. Since nodes in the subway trace set are numbered from 0 to 3299, we decide that node #i is interested in topic #(i mod 5). As soon as it starts running, each node sets a subscription in order to receive all messages about the topic it is interested in. Because of the OppNet model, nodes that are interested in topic #j will therefore serve as both receivers and carriers for all messages about that topic. During the experiment, a number of messages must be pub-lished, and we are interested in analyzing how these messages propagate in the network. No message is published during the first five minutes of the experiment. This bootstrapping interval allows for the first mobile nodes to populate the simulation area. Likewise, no message is published during the last 15 minutes of the experiment. This allows for the last published messages to propagate for a while before the experiment completes. Messages are thus published during a 40 minute time window, which goes approximately from time t=5’ to time t=45’ during the experiment. More specifically, the first node to enter the subway station during the time window is node #200, and the last one is node #2679. Only 20 % of the nodes created in this time window are allowed to publish a message, each publisher node publishing a message about the topic it is itself interested in. In order to determine which node can act as a publisher, we use the following simple method: for node #i, if (i mod 25) <= 5, then node #i is a publisher for topic (i mod 5).
With this simple application scenario, 500 messages are published during the experiment (100 messages for each topic).
The analysis tools available with LEPTON have been used to examine the DGS file produced from the subway trace set. Some of the figures thus obtained are summarized in Table I. Besides these statistical data, the horizons of the 500 messages considered in our application scenario have been computed using LEPTON’s horizon calculator (mentioned in Section III-F). Figure 9 shows the number of potential receivers for each of these messages. It can be observed that the later a node is created during an experiment, the fewer the potential receivers for a message published by this node.
As explained in Section III-F, computing the horizon of a message provides input about the “ideal” propagation of that message. Indeed, the actual number of nodes that can be expected to receive a message is a key requirement for calcu-lating delivery ratios, once experimental results are available. B. Simulating the subway scenario
In order to observe how the two middleware systems pre-sented in Section IV (i.e., DoDWAN and aDTN) can perform
Metric Values (* = min / max / avg / stdev values)
Duration of the experiment 3,600”
Nb. of nodes created during the experiment 3,300 Nb. of active nodes per experiment step 2 / 325 / 180 / 57(*)
Activity duration per node 6.000” / 11’53.400” / 3’15.366” / 1’39.301”(*)
Number of radio contacts 384,465
Number of neighbours per node 0.7 / 73.8 / 25.25 / 11.8(*) Durations of radio contacts 0.600” / 6’01.200” / 24.486” / 34.776”(*)
Number of inter-contacts 78,591
Durations of inter-contacts 0.600” / 6’11.400” / 27.114” / 44.424”(*)
Table I
STATISTICS ABOUT THE SUBWAY STATION SCENARIO,ASSUMING10METER RADIO RANGE.
150 200 250 300 350 400 450 500 550 600 650 0 500 1000 1500 2000 2500 3000 Nb. of receiver s Sender ids
Figure 9. Number of receivers accessible from each message publisher, according to the horizon calculation. As expected, the later a node enters the scenario, the lesser the amount of accessible receivers it can reach.
when running the subway scenario, simulations have first been run using the ONE simulator [12], [13].
Simulation setup: We have converted the DGS files mentioned in Section V-A into the format required by ONE’s ExternalEventQueue(for the establishment of connections and the creation of messages) and ExternalMovement (for the nodes’ movement) Java classes. We also extended ONE’s
ActiveRouter to develop a DoDWANRouter class and an
ADTNRouter class that replicate DoDWAN’s and aDTN’s
behaviour. This way, we have been able to evaluate how DoDWAN and aDTN should behave on the subway scenario. As all the simulation events are deterministic (because all movement, connectivity and message creation events are fixed, and none of the two OppNet systems introduce any randomness by design), all the experiments we performed have generated the same results. During these experiments the transmission rate was 250 kB/s, and each message carried a payload of 200 bytes and had an unlimited lifetime.
Message delivery ratios: In order to improve the preci-sion of the delivery ratio metric, we use results of the horizon computation as a reference for message delivery. Thus, for each message and for each middleware system, we calculated the delivery ratio as NRO/NRI, where NRI is the number
of potential receivers (or “ideal” number of receivers), as
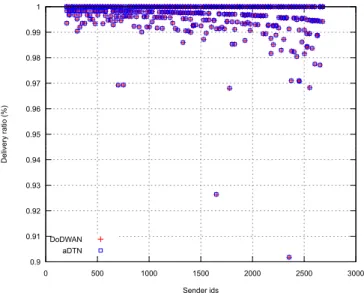
0.9 0.91 0.92 0.93 0.94 0.95 0.96 0.97 0.98 0.99 1 0 500 1000 1500 2000 2500 3000 Deliver y ratio (%) Sender ids DoDWAN aDTN
Figure 10. Delivery ratio obtained by DoDWAN (red cross) and aDTN (blue square), relative to the amount of potential receivers. Note that the two systems perform exactly the same during simulations.
predicted by the horizon computation, and NROis the number
of effective receivers, as observed from the simulator’s log (or “observed” number of receivers).
As shown in Figure 10, both DoDWAN and aDTN have delivered exactly the same amount of messages to the same receivers (they both delivered a message to 99.7% of the potential receivers). This was not unexpected. The reason is that, although DoDWAN uses a publish/subscribe strategy based on topics of interest, while aDTN uses mobile code to make routing decisions, in the described application scenario both systems operate using the very same logic. Therefore, both systems take the same routing decisions and, when facing the same situation, they both forward or deliver the messages to the same nodes. Besides, since processing time and buffer management are not accounted for in a discrete event-based simulator (because time “stops” when a node has to make a decision, and only transmission delays are considered) there is nothing that differentiates one OppNet system from the other from the simulator’s point of view.
Other metrics: One of the advantages of using a sim-ulator is that it makes it easy to collect global statistics of certain metrics. In this case, we have used some of ONE’s Reportclasses to build Table II (that shows some typical metric statistics about the experiment) and Figure 11 (that shows the
Metric Value Started relay events 204,663 Finished relay events 203,223 Aborted relays 1,440 Average latency 961.49 s Average hop count 14.01 hops
Table II
SOME OF THE MAIN METRICS OBTAINED USING THEONE’S
MessageStatsReport. SIMULATIONS PERFORMED WITHDODWANAND ADTNHAVE OBTAINED EXACTLY THE SAME VALUES.
0 50 100 150 200 250 300 350 400 450 00:00 00:30 01:00 01:30 02:00 02:30 03:00 Amou nt of contacts Contact duration (mm:ss)
Figure 11. Contact duration time. About two thirds of the contacts last less than 15 seconds, and most of them last less than 30 seconds.
distribution of contact durations).
Regarding the high amount of aborted relays, it is very interesting to study contact durations, because all abortions are due to premature disconnections between transferring nodes. Note that 7.7% of the contacts last less than 2 seconds, so missing a contact is very easy if one of the nodes is busy transmitting a bunch of messages. This is what happened with messages #1650 and #2354, that could not be delivered to some early carriers because they were occupied, causing that, respectively, 27 and 22 potential receivers never received these messages.
These contacts would be exploited (or not) to forward mes-sages depending on the system implementation’s performance. Additionally, 16.7% of the contacts last less than 5 seconds. This is the beaconing period that both DoDWAN and aDTN use, so all those very short contacts could also be missed by their neighbour discovery modules.
However, these factors (and many others) have not been considered in this experiment, for ONE does not simulates beaconing (it directly notifies a node when a new connection is created) and it processes routing decisions as atomic op-erations. Therefore, there is no way to know the impact of those factors on the overall performance of the two compared systems using simulation.
These results show that simulation is a good tool to confirm that both aDTN and DoDWAN should perform equally well in the subway scenario, and that their designs do not contain
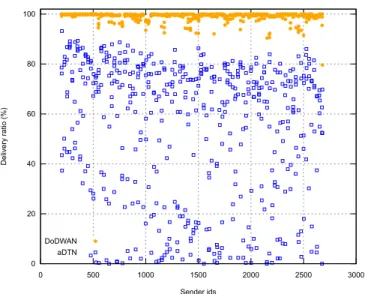
0 20 40 60 80 100 0 500 1000 1500 2000 2500 3000 Deliver y ratio (%) Sender ids DoDWAN aDTN
Figure 12. First set of delivery ratio results observed with systems aDTN (blue squares) and DoDWAN (orange dots). For almost all senders, DoDWAN nodes delivered their messages to more than 90% of the possible destinations, while aDTN nodes performed erratically, their delivery ratios ranging from 0% to 90%.
any obvious incompatibilities or flaws. But while simulation alone proves unable to differentiate such systems, emulation will make it possible to see how they differ when implemented in real code.
C. Emulating the subway scenario
Both DoDWAN’s and aDTN’s real implementations have been used to run the subway scenario, using LEPTON as an emulation platform. Note that our prime objective here is to present how the conclusions thus obtained differ from those obtained with pure simulation. Performing an exhaustive analysis and comparison of DoDWAN and aDTN is out of the scope of this paper.
Emulation setup: Experiments were run using virtual nodes with the two middleware systems. In all experiments the systems were configured so as to use a beaconing period of 5 seconds, and to assume unlimited cache capacity. As in the simulations, messages were published with 200 bytes of payload, and unlimited lifetime.
Message delivery ratios: Again, we have calculated the delivery ratio in relation to the amount of potential receivers we obtained from the horizon computation. Figure 12 shows the delivery ratios observed after running the same application scenario with aDTN nodes, and with DoDWAN nodes. Note that these are not statistical results, as they present figures obtained after one experiment run for each of the two systems considered.
In this figure it appears that aDTN performs quite poorly. The average delivery ratio observed with this system is actually 54.6%, while that observed with DoDWAN is 98.9%. These first results came as a surprise, since before running with LEP-TON, aDTN had first been extensively tested using the ONE simulator, as well as using a dozen of Raspberry Pi micro-computers as experimentation platforms. Every time aDTN
70 75 80 85 90 95 100 0 500 1000 1500 2000 2500 3000 Deliver y ratio (%) Sender ids DoDWAN aDTN
Figure 13. Second set of delivery ratio results observed with systems aDTN (blue squares) and DoDWAN (orange dots), after correcting aDTN’s issue (note that the y-axis now starts at 70%). Although DoDWAN slightly outperforms aDTN, the overall results are now very similar.
seemed to perform quite satisfactorily. It is only when being tested with LEPTON that aDTN proved unable to support the workload imposed by a demanding scenario such as that of the subway station. After a detailed examination of the imple-mentation of aDTN, it appeared that the buffer management system in aDTN sometimes maintained duplicates of messages on the same node. This error was easily corrected, and another experiment was run with LEPTON and aDTN. The new delivery ratios obtained with aDTN are shown in Figure 13 (together with those obtained earlier with DoDWAN), and this time it can be observed that both systems show roughly similar performances. Indeed, the average delivery ratio observed with aDTN is 97.1%, against 98.9% for DoDWAN.
This experiment confirms that running an OppNet mid-dleware system in emulation mode is an excellent stress test for the system considered. Bad or weak implementation choices can be revealed in such conditions, while they could remain undetected when running pure simulations, or when running real code on a handful of experimentation platforms. Besides, this experiment confirms that, even when simulation shows that both systems should perform equally well, their actual implementations play a key role in differentiating them. Although the delivery ratios obtained with both systems are quite similar, there are obvious differences between them that were not spotted with pure simulation, and these differences may be crucial when running in real conditions.
Interestingly, Figure 13 also shows that the amount of undelivered messages increases with time during an exper-iment. This is because when the system under test fails to exploit a contact between two SNs, the chance to compensate for this failure by exploiting later contacts gets weaker as the simulation gets closer to completion. This phenomenon affects aDTN’s results more heavily than DoDWAN’s, because message delivery latencies (discussed in the following para-graphs) are higher with aDTN than with DoDWAN. aDTN
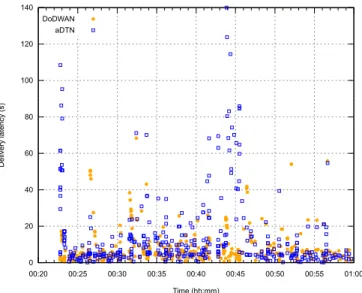
0 20 40 60 80 100 120 140 00:20 00:25 00:30 00:35 00:40 00:45 00:50 00:55 01:00 Deliver y latency (s) Time (hh:mm) DoDWAN aDTN
Figure 14. Delivery latencies observed during the dissemination of message #1251, when running either aDTN (blue squares) or DoDWAN (orange dots) nodes using LEPTON. The obtained latencies are very similar, except in two moments: at the start of the message’s dissemination, and around 00:43, where DoDWAN outperforms aDTN.
nodes, therefore, get fewer chances to compensate missed transmission opportunities.
Message delivery latencies: Another interesting metric to consider when analyzing experimental results is the latency of message delivery, as observed for each receiver. In that particular case we are not interested in the delay between the time a message is published and the time it is received. We are interested in the delay between the time a message could be received by a node (according to the horizon calculation), and the time it is actually received by that node (as recorded in the experiment’s log files). Figure 14 shows the latencies observed (with both aDTN and DoDWAN) for message #1251, and for each of the receivers of that message. In this figure, a symbol that shows, for example, a latency of about 80 seconds at time 00:24 indicates that a receiver that could have received message #1251 at a certain time (according to the horizon computation) actually received it 80 seconds later during the experiment.
In Fig. 14 it can be observed that when running the network emulation using aDTN nodes, about 20 of these nodes did not receive message #1251 as early as possible during the first minute of the message’s dissemination. This did not happen during simulations (see Figure 15, that shows that only four nodes received the message more than 30 seconds later than expected). These nodes that received the message a lot later than expected could not serve as early carriers for the message, which compromised the speed of that message’s dissemination in the subway station. Further investigations (based on a thorough analysis of the log files) would be required in order to explain this phenomenon.
LEPTON’s toolset provides programs that can help perform such fine grain analysis, based on automatic extraction of data from log files. This topic remains out of the scope of this paper, though, since our main objective here is simply
0 20 40 60 80 100 120 140 00:20 00:25 00:30 00:35 00:40 00:45 00:50 00:55 01:00 Deliver y latency (s) Time (hh:mm) DoDWAN and aDTN
Figure 15. Delivery latencies observed during the dissemination of message #1251 using the ONE simulator, when running either aDTN or DoDWAN (which obtained exactly the same results).
to demonstrate how fully-implemented opportunistic systems can run in an emulated environment, thanks to the LEPTON platform, producing a wealth of results that can then be analyzed at a very fine grain.
Considerations about LEPTON’s resource consumption: Experiments based on the subway scenario have been run on a cluster composed of 20 cluster nodes (each node including 2 “6-core” Xeon L5640 processors), interconnected via a Gigabit Ethernet LAN, each cluster node running Linux. In practice, only five nodes of the cluster were used during our experiments. One of these nodes ran the LEPTON emulator (i.e., simulation engine plus the appropriate software hub), and the other four nodes ran instances of the OppNet system considered, which were created dynamically at runtime and interacted via the hub. In our experiments, we deployed only one software hub, combined with the simulation engine, and we have studied the workload imposed on the node on which they were deployed.
Figure 16 shows the evolution of the CPU workload ob-served on that node during an experiment involving DoD-WAN’s SNs. Experiments based on aDTN produced roughly similar results. It can be observed that simulating the mobility of mobile nodes (which is basically the task of LEPTON’s simulation engine), and controlling communication between these nodes (which is that of the software hub), only use a small fraction of the CPU capacity. The CPU load observed on the cluster nodes hosting SNs was also measured during experiments. This workload was even lower than that shown in Figure 16, even though each cluster node had to run dozens of concurrent SNs at any time (with occasional peaks at about 80 SNs per cluster node).
Figure 17 shows the network throughput observed on the same cluster node during an experiment. The maximal throughput observed is slightly above 16 Mbps. This is only a small fraction of the network capacity in this configuration. These figures confirm that LEPTON is indeed a lightweight
0 0.5 1 1.5 2 2.5 3 3.5 4 4.5 00:00 00:10 00:20 00:30 00:40 00:50 01:00 % CPU Timeline (hh:mm)
Figure 16. CPU load observed on the host running LEPTON during an experiment (with DoDWAN nodes).
0 2 4 6 8 10 12 14 16 18 00:00 00:05 00:10 00:15 00:20 00:25 00:30 00:35 00:40 00:45 00:50 00:55 01:00 Mbit/s Timeline (hh:mm)
Figure 17. Network throughput observed in the software hub during an experiment (with DoDWAN nodes).
emulation platform, which makes it possible to run emulation-based experiments on standard laboratory equipment. For simple simulation scenarios an experiment can be conducted on a single workstation or laptop, and for more demanding scenarios a couple of standard workstations (or part of a cluster) can be used.
D. Field experiment with DoDWAN
Whenever running a certain scenario with a simulation or emulation platform, it is always legitimate to wonder whether the results thus obtained bear any resemblance to what could be observed in real conditions. In order to demonstrate that LEPTON makes it possible to run emulation-based experi-ments in conditions that closely mimic real-life conditions, we have conducted a small-scale field experiment based on