Publisher’s version / Version de l'éditeur:
Proceedings 18th International Conference on Port and Ocean Engineering under Arctic Conditions, POAC'05, 3, pp. 1177-1187
READ THESE TERMS AND CONDITIONS CAREFULLY BEFORE USING THIS WEBSITE.
https://nrc-publications.canada.ca/eng/copyright
Vous avez des questions? Nous pouvons vous aider. Pour communiquer directement avec un auteur, consultez la
première page de la revue dans laquelle son article a été publié afin de trouver ses coordonnées. Si vous n’arrivez pas à les repérer, communiquez avec nous à PublicationsArchive-ArchivesPublications@nrc-cnrc.gc.ca.
Questions? Contact the NRC Publications Archive team at
PublicationsArchive-ArchivesPublications@nrc-cnrc.gc.ca. If you wish to email the authors directly, please see the first page of the publication for their contact information.
NRC Publications Archive
Archives des publications du CNRC
This publication could be one of several versions: author’s original, accepted manuscript or the publisher’s version. / La version de cette publication peut être l’une des suivantes : la version prépublication de l’auteur, la version acceptée du manuscrit ou la version de l’éditeur.
Access and use of this website and the material on it are subject to the Terms and Conditions set forth at NRC Catalogue of Local Ice Pressures (CLIP)
Frederking, Robert; Collins, Anne
https://publications-cnrc.canada.ca/fra/droits
L’accès à ce site Web et l’utilisation de son contenu sont assujettis aux conditions présentées dans le site LISEZ CES CONDITIONS ATTENTIVEMENT AVANT D’UTILISER CE SITE WEB.
NRC Publications Record / Notice d'Archives des publications de CNRC: https://nrc-publications.canada.ca/eng/view/object/?id=96f379ca-677a-46b6-b52c-d0853b9788e2 https://publications-cnrc.canada.ca/fra/voir/objet/?id=96f379ca-677a-46b6-b52c-d0853b9788e2
Proceedings 18th International Conference on Port and Ocean Engineering under Arctic Conditions, POAC’05
Vol. 3, (in press), Potsdam, NY, USA, 2005.
NRC CATALOGUE OF LOCAL ICE PRESSURES (CLIP)
R. Frederking and A. Collins Canadian Hydraulics Centre National Research Council of Canada
Ottawa, Ont. K1A 0R6, Canada
ABSTRACT
A Joint Industry Project has been carried out to develop a "Catalogue of Local Ice Pressures". The focus of the project was to determine average local ice pressures on various sizes and shapes of design areas, and to present the data in a form to facilitate probabilistic estimation of local ice pressures. The data are organized in a database to assist extraction of local ice pressures as a function of operational factors and ice conditions. The database includes four digital data sets on ship trials (1994 Louis S. St. Laurent, 1991 and 1996 Oden, and 2001 Terry Fox), two offshore structures (1985-86 Molikpaq caisson and 1990 JZ-20-2-1 jacket structure) and one field test (1995 Grappling Island). An example of the method used to process data from bow measurements during the 1994 Polar transit of the Louis St. St. Laurent is presented.
INTRODUCTION
There is uncertainty in the magnitude and distribution of local ice pressures for application in the design of local structure of offshore platforms for the petroleum industry and ship scantlings for the marine industry. Data exist from a number of offshore structures and ships that have been instrumented to measure local ice
pressures under natural loading conditions. Ice conditions include first-year level ice, ice ridges, multiyear ice and iceberg ice. A JIP was initiated to compile all these data in a systematic fashion to support the development of local pressure-area relations for application in design.
There is more than one definition of a pressure-area relation, so for clarity the
approach used here will be explained. During an impact between an ice feature and a structure the pressure within the contact area is not uniform. Evidence for this
includes measurements on the Louis S. St. Laurent reported by Glen and Blount (1984), showing that local pressures were localized over areas 0.6 m by 0.4 m or smaller. More recently the JOIA Project made detailed measurements of local ice pressures on a wide indenter (Akagawa et al, 1999), which showed the local ice pressure variations in detail. These and other measurements confirm the progressively smaller areas within the contact area were observed to experience higher average pressures. In this study average ice pressures measured on predetermined areas, as defined by the instrumentation on the structure, were analysed. The maximum average pressure was calculated for a variety of predetermined areas of a given size and shape within the larger contact area during an impact. It is these maximum average pressures determined for a range of predefined areas that form the basis for a spatial pressure-area relation. Jordaan et al (1993) described them as the pressure on local areas within a global area. The areas over which local ice pressures are defined are termed design areas. It is pressures on these areas that are required in local structures design.
This paper will review the available local ice pressure data sources, describe the database, explain how data are analysed, and summarize the data in the database.
DATA INVENTORY
The project started by conducting an extensive survey of data sources. The sources were assessed and, depending on their completeness, availability and ease of conversion, acquired. In some cases the data were in an accessible format such as ASCII, however in other cases the digital data were in a less accessible format and had to be converted. In still other cases data were only available in hard copy reports containing time series plots that could be digitized.
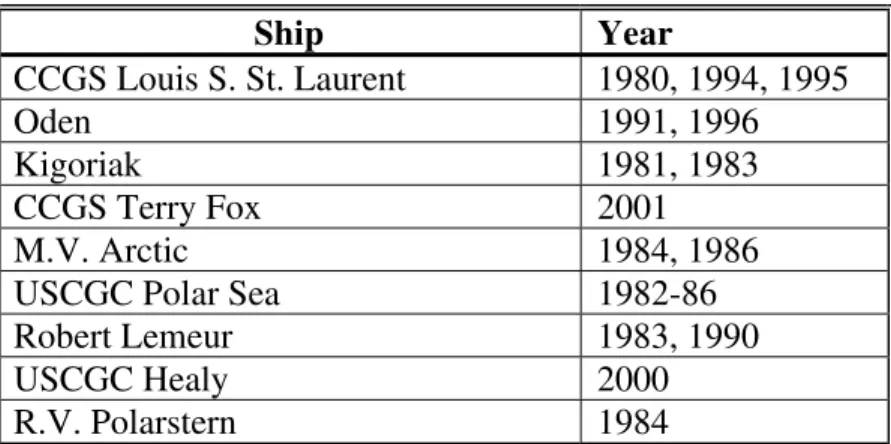
To illustrate this process over 15 sources of ship data were identified, extending back to 1980 (see Table 1). In terms of availability and completeness the Oden 1991 and 1996 and Louis S. St. Laurent 1994 data were attractive. They were for transits where the ships did not deliberately seek out difficult ice but generally reflected normal operation of a ship in ice. In addition to local ice pressure measurements there were systematic observations of ice conditions that could be related to the pressures. These data were well suited for analysis since they provide a good basis for relating local ice pressures to exposure to various ice conditions and ship operations. Some of the other ship data was only available in hard-copy format and information on ice conditions was meagre or absent. The Polar Sea 1982 through 1986 and 2000 Healy data are in digital format, and have good corresponding ice information, but were primarily trials in level ice and ridges, thus not providing a good statistical sample for subsequent analysis. The Terry Fox data were for trials in which deliberate impacts with glacial ice were conducted. These were unique data, and while not statistically
Table 1 Inventory of ship data Ship Year CCGS Louis S. St. Laurent 1980, 1994, 1995 Oden 1991, 1996 Kigoriak 1981, 1983 CCGS Terry Fox 2001 M.V. Arctic 1984, 1986
USCGC Polar Sea 1982-86
Robert Lemeur 1983, 1990
USCGC Healy 2000
R.V. Polarstern 1984
There is a substantial amount of digital data available on structures (Table 2), however much of it is not easily accessible or of good quality. For example the SSDC had extensive local ice pressure measuring instrumentation on the hull, however a grounded rubble field often surrounded the structure, so there were only a few instances of direct ice interaction with the hull. The Molikpaq at Amauligak I-65 measured local ice pressure data, together with systematic ice observations over an 8-month period, thus providing a good basis for relating local ice pressures to a range of ice conditions. The JZ-20 jacket structure in Bohai Bay also provided good data. Table 2 Inventory of structure data
Structure Type Year
Molikpaq – Amauligak I-65 Caisson, 100m wide 1985-86
Tarsiut Caisson, 100 m wide 1981-82, 1982-83
SSDC – Uviluk, etc Caisson, 160 m wide 1982-83 through 1987-88 Yamachiche Lighthouse, 75o cone 1985-86, 1987-88, 1988-89 Curve 1 Lighthouse, 45o cone 1987-88, 1988-89
Confederation Bridge Pier, 52o cone 1997-98 through to 2004-05 LOLEIF/STRICE
-Norströmsgrund
Lighthouse, cylindrical
2000 through to 2003
JZ-20 – Bohai Bay Jacket 1990
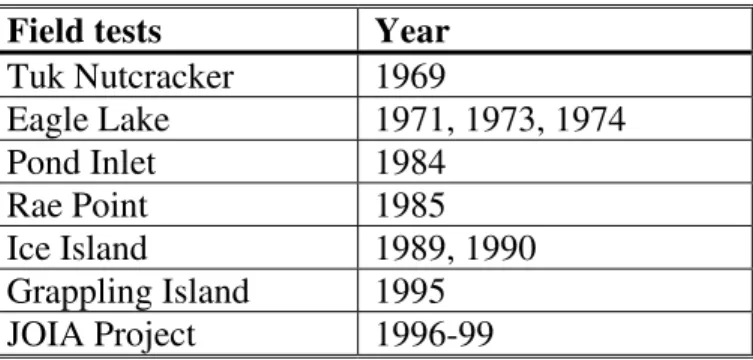
Field tests (Table 3) generally provide unambiguous data on ice forces and ice
conditions, however, the limited number of tests and relatively uniform ice conditions do not provide an adequate basis for establishing a probabilistic characterization of local ice pressures. Also some of the early tests such as the 1969 Tuktoyaktuk
“Nutcracker”, 1971, ‘73 and ‘74 ESSO Eagle Lake tests, 1984 Pond Inlet iceberg tests or 1989 and ‘90 Ice Island tests did not provide suitable local ice pressure data. They are nevertheless valuable for providing insights into the physics of ice failure
processes. It is only the 1995 Grappling Island iceberg impact tests that provide local ice pressure data.
Table 3 Inventory of field tests
Field tests Year
Tuk Nutcracker 1969 Eagle Lake 1971, 1973, 1974 Pond Inlet 1984 Rae Point 1985 Ice Island 1989, 1990 Grappling Island 1995 JOIA Project 1996-99 DATABASE DESCRIPTION
A MicroSoft-Access database was set up to manage the input of the data and to facilitate access of the analysed local ice pressure data. Each data set is uniquely identified by a name and date. For example, measurements made on the bow during the 1994 voyage of the CCGS Louis St. St-Laurent are designated LOUIS_BOW_94.
Data Form Descriptions
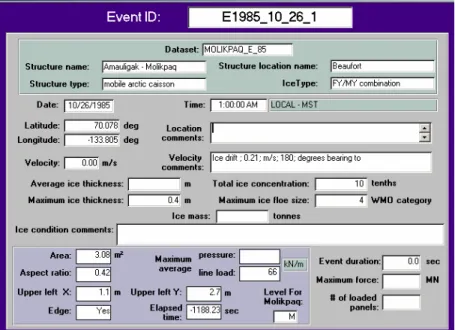
There is one form of introductory information for each data set, one page of which provides general information on the measurement program and the location, and the second page provides information on the ice conditions and instrumentation. These pages were used for data entry, and are also used for searching the database. The first page provides general information about the ship or structure, the name, the test type, dates when the tests were carried out, and the measurement program. The second page provides information on the range of ice conditions in a general sense in a text box and both descriptive and quantitative information on the instrumentation such as type, dimensions and coverage. The second form, illustrated here in Figure 1, describes the attributes of an event and presents the average ice pressure on various areas and shapes. For each event quantitative descriptive information is given to allow for sorting local ice pressure results on the basis of the attributes describing the event. These attributes include:
Date and time of event Location of specified event Ship velocity or ice drift speed Average and maximum ice thickness Ice concentration
Maximum floe size Event duration
Maximum total force.
The lower left corner of this page (shaded area) presents the average pressures for each design area with the following information:
Aspect ratio; shape of the design area
Maximum average pressure on the design area Location of the design area.
The number of design areas depends on the layout of the instrumentation on the measurement area.
Figure 1 Form describing attributes of an event
Data extraction from database
The forms described in the previous section provide a basis on which the database can be filtered to extract a population of average pressures for a particular set of attributes or conditions. The form illustrated in Figure 1 can be used to define the filters in MS-Access to extract ice pressure data. Some familiarity with MS-Access is required to extract data, so a description of the filtering is beyond the scope of this paper.
EXAMPLES OF DATA
To illustrate the process required to analyse data for inclusion in the database, two examples will be presented, one for the ship data and another for offshore structure data.
CCGS Louis S. St. Laurent Polar Transit
The voyage was carried out in the summer of 1994 when the ship transited from Alaska (Chukchi Sea) across the Pole to Svalbard (Fram Strait). The distance from the ice edge to the North Pole was 1420 nautical miles and the total voyage distance in
ice was 2120 nautical miles. The total voyage in ice lasted 35 days, but the actual time the ships were transiting was about 500 hours. Hourly observations of ice conditions were taken from the bridge of an accompanying ship, the Polar Sea. These included ice classification by type, thickness, ridging and partial concentrations for each ice type. Video records from over-the-side and bridge mounted cameras were made, which were later used to verify ice thickness and ice conditions during the voyage. The hourly ice observations and videos provided the basis for the ice information for each event (Ritch et al, 1999).
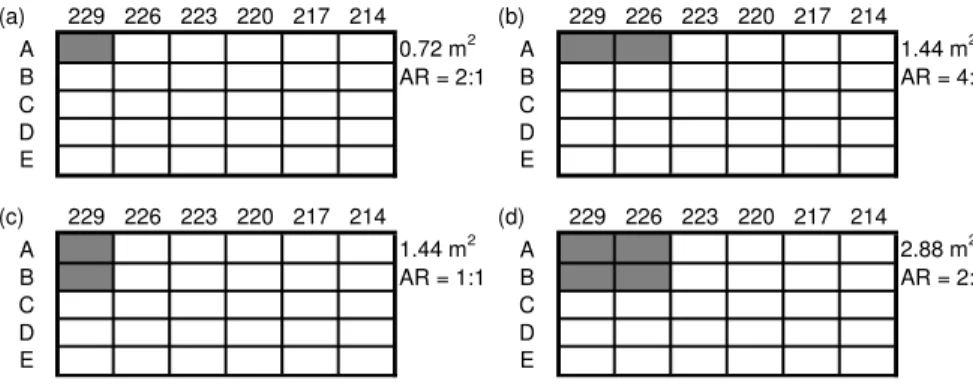
Three areas on the Louis S. St. Laurent were instrumented to measure ice pressures: the bow, shoulder and bottom; however this example will focus on the bow. The instrumented bow area was 7.2 m long by 3 m high and approximately midway between the stem and the shoulder. The top of this area was about 0.7 m below the waterline. Six main frames were instrumented with strain gauges to measure the shear strain difference between six stringers spaced 0.6 m apart vertically. The general layout is illustrated in Figure 2. Thus local pressures on 30 sub-panels, each 1.2 m wide by 0.6 m high (area 0.72 m2) were available for analysis. By summing the output of various groups of immediately adjacent sub panels, average pressures on areas larger than 0.72 m2 could also be obtained. Figure 3 illustrates four of the possible areas and shapes (aspect ratios or AR) over which average pressure could be determined. There are 30 possible areas and shapes. Summing all 30 sub-panels provided a good representation of the total ice force on the portion of the bow that was instrumented.
Frame 229 A B C D E FORWARD AFT Frame 226 Frame 223 Frame 220 Frame 217 Frame 214 3.0 m 0.7 m 7.2 m
Figure 2 Layout of instrumented sub-panels on bow of Louis S. St. Laurent (a) 229 226 223 220 217 214 (b) 229 226 223 220 217 214 A 0.72 m2 A 1.44 m2 B AR = 2:1 B AR = 4:1 C C D D E E (c) 229 226 223 220 217 214 (d) 229 226 223 220 217 214 A 1.44 m2 A 2.88 m2 B AR = 1:1 B AR = 2:1 C C D D E E
The data acquisition system ran continuously, and whenever a threshold strain was exceeded, in this case 200 µm/m shear strain on the frames, a record 6 to 10 seconds long at 100 Hz was stored. Part of the record prior to the trigger was retained, so a time series record of the total event, from start of loading to unloading, was obtained. To obtain the maximum average pressure on a specific design area for an impact event, the average pressure was calculated on each possible position of that design
area, for each time step, and that maximum pressure saved. For example in
Figure 3 (d), there are 5 horizontal positions and 4 vertical positions for a total of 20 possible locations of the 2.88 m2 area with aspect ratio 2:1, so the maximum average pressure from among these 20 locations is saved. Then all time steps were searched for the maximum average pressure on that design area for the event. For other areas and shapes there are other possible numbers of locations. Thus one maximum average pressure was determined for each of the 30 possible design areas for each impact event.
During the transit, a total of 1730 events were triggered for the bow area. For each event local ice pressures on each possible area and shape, ship speed and ice
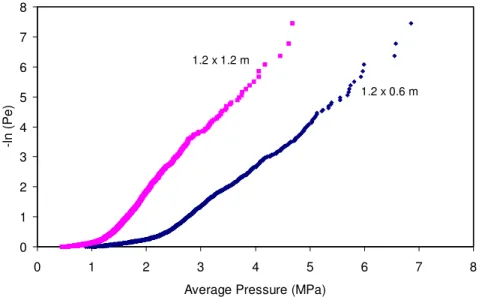
conditions were available. The database can be queried for the population of average pressures that meet a particular set of criteria. To illustrate, a filter of area 0.72 m2 was applied to the LOUIS_BOW_94 data, giving 1730 independent extreme values of average pressure. The same can be done for other areas and shapes. The extreme values of the filtered events were arranged in descending order and plotted using the Weibull plotting position, pe = i/(n+1), where i is the ith ranked data point and n is the total number of data points. As an example the ranked average pressures on two areas, 0.72 m2 and 1.44 m2 were plotted in Figure 4 and show the consistent lower average pressure for a larger area. It includes the results from all 1730 impact events.
0 1 2 3 4 5 6 7 8 0 1 2 3 4 5 6 7 8 Average Pressure (MPa)
-ln (Pe)
1.2 x 1.2 m
1.2 x 0.6 m
Figure 4 Probability of average pressure on hull areas 1.2 m by 0.6 m and 1.2 m by
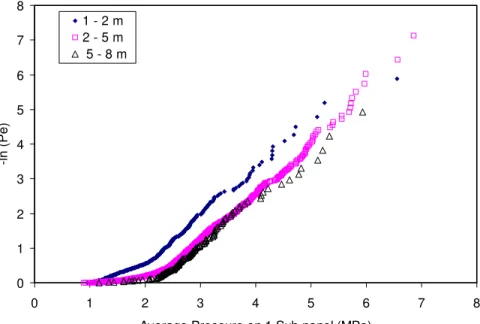
The database facilitates sorting by ice thickness or ship speed, to name just two attributes, to see their effect on local ice pressures. Figure 5 illustrates the effect of ice thickness on the local pressure on a single sub-panel (0.72 m2).
0 1 2 3 4 5 6 7 8 0 1 2 3 4 5 6 7 8 Average Pressure on 1 Sub-panel (MPa)
-ln (Pe)
1 - 2 m 2 - 5 m 5 - 8 m
Figure 5 Ice thickness influence on one sub-panel (0.72 m2) ice pressure
Molikpaq at Amauligak I-65
Data from the Amauligak I-65 deployment of the Molikpaq in 1985/86 cover an entire winter season and a variety of ice conditions, thus providing a good basis for
establishing exposure criteria. The Molikpaq is an annular steel caisson supporting a self-contained deck structure. The annular caisson is ballasted with water and has a sand filled core. More detail on the structure and instrumentation can be found in Timco and Johnston (2003).
Local ice pressures were measured on the face of the Molikpaq using Medof panels (Metge et al, 1983). The panels are 1.135 m wide and 2.715 m high (3.1 m2). They measure the total force acting on the panel regardless of its distribution so it gives an average pressure on the 3.1 m2 area of the panel. The data acquisition system
monitored output of all panels continuously at 1 Hz, and recorded the mean, minimum and maximum average pressure every 5 minutes. The recording period extended from late October 1985 through to early July 1986, so to retain a manageable amount of data, 5154 hourly maximum average ice pressures on various design areas were determined.
Figure 6 shows the location of the panels on the North and East faces of the Molikpaq. Three groups of 4 or 5 panels were located on each face. Each group was 2 panels across and 2 panels vertically, with the water line passing across the lower part of the
upper level of panels. Two groups had a fifth panel directly beneath the other four. Each panel had an area of 3 m2 and the groups had an area of 12 or 15 m2. The width of each face was 60 m so slightly more than 10% of the length of each face was covered with panels. The forces from two or three vertically adjacent panels were summed to obtain a line load, i.e. a force per unit width.
Figure 6 Locations of the Medof panels on north and east faces of the Molikpaq, viewed from outside.
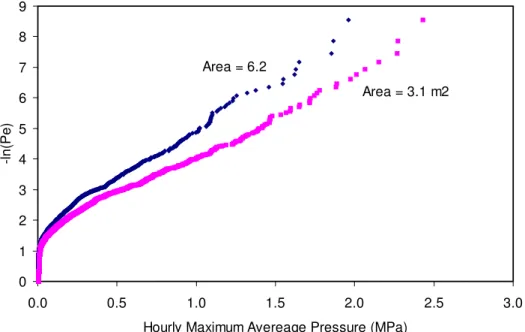
Using the same approach as for the Louis S. St. Laurent bow, data the 5155 maximum hourly local ice pressures are plotted in Figure 7.
0 1 2 3 4 5 6 7 8 9 0.0 0.5 1.0 1.5 2.0 2.5 3.0
Hourly Maximum Avereage Pressure (MPa)
-ln(Pe)
Area = 3.1 m2 Area = 6.2
Figure 7 Influence of area on probable maximum hourly ice pressures – Molikpaq at Amauligak, 1985-85.
SUMMARY OF DATA IN DATABASE
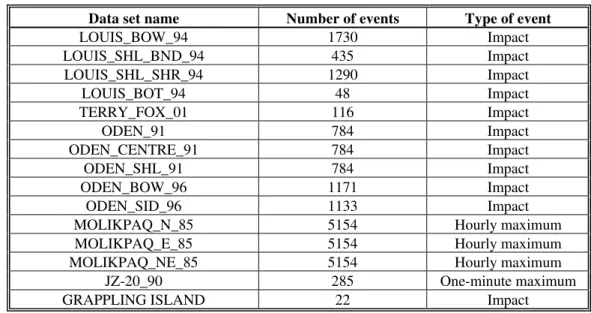
To date the database contains results from the 1994 Louis S. St. Laurent Polar transit (bow, shoulder and bottom areas), 2001 Terry Fox trials, Oden 1991 and 1996 Polar transits, 1985/86 Medof panel data from the Molikpaq at Amauligak, 1990 JZ-20 jacket platform in Bohai Bay, and 1995 Grappling Island impacts. A summary of the data sets is presented in Table 4.
Table 4 Summary of datasets on CD
Data set name Number of events Type of event
LOUIS_BOW_94 1730 Impact LOUIS_SHL_BND_94 435 Impact LOUIS_SHL_SHR_94 1290 Impact LOUIS_BOT_94 48 Impact TERRY_FOX_01 116 Impact ODEN_91 784 Impact ODEN_CENTRE_91 784 Impact ODEN_SHL_91 784 Impact ODEN_BOW_96 1171 Impact ODEN_SID_96 1133 Impact
MOLIKPAQ_N_85 5154 Hourly maximum MOLIKPAQ_E_85 5154 Hourly maximum MOLIKPAQ_NE_85 5154 Hourly maximum
JZ-20_90 285 One-minute maximum GRAPPLING ISLAND 22 Impact
CONCLUSIONS
The focus of the project has been the determination of average local ice pressures on pre-selected design areas of various sizes and shapes in a form to facilitate
probabilistic estimation of local ice pressures. The stochastic nature of the data has been maintained, with attributes of ice conditions, drift rate, ship speed and location being assigned to each event. This provides a basis for treating exposure on the basis of time or number of events, amount of ice passing a structure, or distance of ship transit in ice. Of special note are the Louis S. St. Laurent and the Oden Polar transit data sets and the Molikpaq at Amauligak data set because of their comprehensiveness. The CLIP database created from extensive Arctic and limited temperate region
sources provides a rich resource of reliable data for design for local ice pressure. The National Research Council-Canadian Hydraulics Centre will be conducting future analysis using the data in the database. There is also scope for adding further data to the database.
ACKNOWLEDGEMENTS
The financial support and interest of the CLIP Joint Industry Project participants, (Chevron Canada Resources, ExxonMobil Upstream Research Company, Husky Oil Operations Ltd. and Petro Canada, Transport Canada, the Program of Energy
REFERENCES
Akagawa, S., Kawamura, M., Takeuchi, Y., Matsushita, M., Sakai, M. and Terashima T., 1999. Field ice indentation tests: 6 m wide (maximum) with servo-controlled power and 2-D pressure measurement system, Proceedings 9th International Offshore Mechanics and Polar Engineering Conference, Stavanger, Norway, June 17022, 1999, Vol. II, pp 491-497.
Glen, I. and Blount, H., 1984. Measurements of ice impact pressures and loads onboard CCGS Louis S. St. Laurent, Proceedings 3rd International Offshore
Mechanics and Arctic Engineering Symposium, New Orleans, Louisiana, February 12-17, 1984, Vol. III, pp. 246-252.
Jordaan, I.J., Maes, M.A., Brown, P.A. and Hermans, I.P., 1993. Probabilistic analysis of local ice pressures, Journal of Offshore and Arctic Engineering, ASME Vol. 115, pp. 83-89.
Metge, M., Pilkington, R., Strandberg, A. and Blanchet, D. 1983. A new sensor for measuring ice forces of structures: laboratory tests and field experience. Proceedings 7th International Conference on Port and Ocean Engineering Under Arctic
Conditions, POAC ‘73, Helsinki, VTT Symposium 28, Vol. 4, p. 790-801. Ritch, R., St. John, J., Browne, R., and Sheinberg, R., 1999. Ice load impact measurements on the CCGS Louis S. St. Laurent during the 1994 Arctic Ocean crossing, Proceedings of the 18th International Conference on Offshore Mechanics and Arctic Engineering, July 11-16, 1999, St. John’s Newfoundland, paper
OMAE99/P&A-1141.
Timco, G.W. and Johnston, M. 2003. Ice loads on the Molikpaq in the Canadian Beaufort Sea, Cold Regions Science and Technology, Vol. 37, pp. 51-68.