HAL Id: hal-01119354
https://hal.archives-ouvertes.fr/hal-01119354
Submitted on 23 Apr 2015HAL is a multi-disciplinary open access
archive for the deposit and dissemination of sci-entific research documents, whether they are pub-lished or not. The documents may come from teaching and research institutions in France or abroad, or from public or private research centers.
L’archive ouverte pluridisciplinaire HAL, est destinée au dépôt et à la diffusion de documents scientifiques de niveau recherche, publiés ou non, émanant des établissements d’enseignement et de recherche français ou étrangers, des laboratoires publics ou privés.
Molecular Orientational Order Probed by Coherent
Anti-Stokes Raman Scattering (CARS) and Stimulated
Raman Scattering (SRS) Microscopy: A Spectral
Comparative Study
Julien Duboisset, Pascal Berto, Paulina Gasecka, Fatma-Zohra Bioud, Patrick
Ferrand, Hervé Rigneault, Sophie Brasselet
To cite this version:
Julien Duboisset, Pascal Berto, Paulina Gasecka, Fatma-Zohra Bioud, Patrick Ferrand, et al.. Molec-ular Orientational Order Probed by Coherent Anti-Stokes Raman Scattering (CARS) and Stimulated Raman Scattering (SRS) Microscopy: A Spectral Comparative Study. Journal of Physical Chemistry B, American Chemical Society, 2015, 119 (7), pp.3242-3249. �10.1021/jp5113813�. �hal-01119354�
Molecular Orientational Order Probed by
CoherentAnti-Stokes Raman Scattering (CARS)
and Stimulated Raman Scattering (SRS)
Microscopy: a Spectral Comparative Study
Julien Duboisset
†,
∗Pascal Berto
†, Paulina Gasecka, Fatma-Zohra Bioud,
Patrick Ferrand, Herv´
e Rigneault, and Sophie Brasselet
Aix-Marseille Universit´e, CNRS, Centrale Marseille, Institut Fresnel, UMR 7249, 13013 Marseille, France
E-mail: julien.duboisset@fresnel.fr
Abstract
We investigate how to extract information on the orientational order of molecu-lar bonds in biological samples from pomolecu-larized coherent anti-Stokes Raman scatter-ing (CARS) and stimulated Raman scatterscatter-ing (SRS) microscopy. Experimentally, the mean orientation of the molecular angular distribution, as well as its second and fourth orders of symmetry, are estimated by monitoring intensity signals under a varying inci-dent polarization. We provide a generic method of analysis of polarized signals in both CARS and SRS contrasts, and apply it to imaging of lipid bonds’ orientational order in multilamellar vesicles. A comparison of the two contrasts in the lipid region around 3000 cm−1 shows that while SRS allows retrieving pure molecular order information,
Introduction
Being able to report high level of detail in the structural molecular organization using optical microscopy is one of the prevailing goals in the field of functional imaging in biology, material sciences and molecular physics. Polarized optical microscopy is becoming a powerful tool to address molecular orientational distributions into the focal volume of a microscope.1 In co-herent nonlinear optics, polarized second harmonic generation,2–4 polarized third harmonic generation5 and polarized four wave mixing6,7 have already been used to recover
orienta-tional information on endogeneous proteins and lipids in biological tissues. In addition to the orientational information, Coherent Raman Scattering (CRS) processes are sensitive to molecular bond vibrations, allowing chemical specificity without the need of fluorescence labelling.8–10
Coherent anti-Stokes Raman scattering (CARS) microscopy is based on the interaction of two fields called pump (ωp) and Stokes (ωs).11 When their frequency difference matches
a vibrational resonance (ΩR), a blue-shifted field called anti-Stokes (ωas= 2ωp− ωs) is
gen-erated. In this case, the intensity recovered at ωas reveals the presence of specific bonds but
is quadratically dependent on the nonlinear susceptibility and can interfere with a spuri-ous nonresonant background.12 In recent years, the implementation of another CRS process
called Stimulated Raman Scattering (SRS), has become an increasingly used tool for label-free microscopy.14,15 Simultaneously to the generation of an anti-Stokes photon, a gain on the Stokes beam (stimulated Raman gain, SRG) and a loss on the pump beam (stimulated Raman loss, SRL) appears when the frequency difference ωp − ωs matches ΩR. To detect
the SRG signal (resp. SRL signal), the pump beam (resp. Stokes beam) is modulated at high frequency, typically in the MHz range, and the gain on the Stokes beam (resp. the loss on the pump beam) is measured by means of a lock-in amplifier. SRS is a background free process which allows to recover directly pure molecular Raman spectra. Even though CARS and SRS techniques are sensitive to the same Raman susceptibility tensor, the information recovered by both techniques differ by their underlying physical mechanism.
We have previously developed a generic polarization resolved microscopy technique able to retrieve molecular orientational information in organized lipid membranes, based on sym-metry orders decomposition of the lipid orientational distribution function.7 The
informa-tion retrieved however neglected the non resonant background intrinsic to the CARS signal because of the high contrast obtained on the considered resonance. This nonresonant contri-bution is known however to perturb the interpretation of polarized signals in more general cases.27 On the other hand, SRS polarized microscopy studies have been introduced so far only in isotropic media.6 A unified approach for both contrasts, encompassing the whole characteristics of both of them, has not yet been developed.
Here we propose to investigate the nature of polarization resolved CARS and SRS signals, and in particular their respective capacity to disentangle molecular orientational information in the focal volume of a microscope. We introduce an exhaustive model to analyze polar-ization resolved SRS signals, similarly to what has been already acheived for CARS.7 We illustrate the method on multilamellar vesicles to extract lipid orientational organization. Finally, we compare the CARS and SRS polarization resolved methods by extending the analysis to the frequency domain, addressing more specifically details in the vibrational lipid bond spectral region.
Macroscopic nonlinear susceptibility
The resonant third order nonlinear susceptibility χ of vibrational mode is built-up based on the sum of individual nonlinear dipoles, describing the molecular bonds contributing to this vibrational mode.5,16 Each of these nonlinear dipoles, defined by their direction (θ, ϕ)
in the macroscopic laboratory frame, are characterized by a nonlinear susceptibility γ in the microscopic frame. In the case of CH2 vibrational bonds studied below, only the γzzzz
a) b) c) d) Y X j e) f) X Y Z Z Y X + + j q
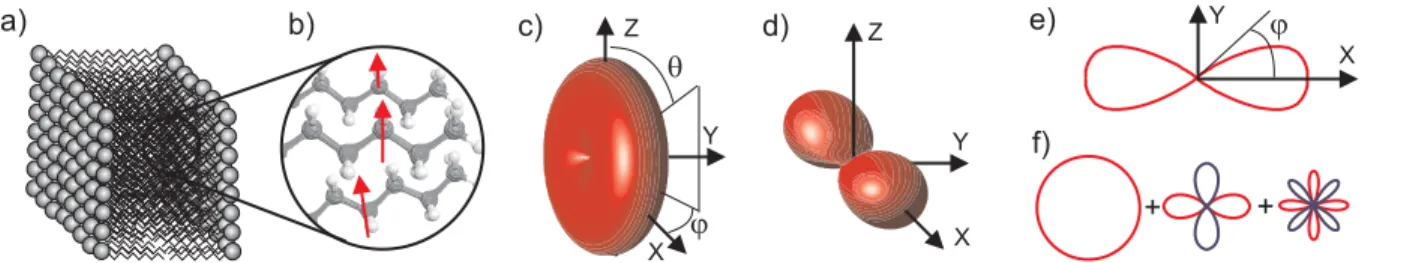
Figure 1: a) Assemblies of lipids into the focal volume. b) Orientation of nonlinear induced dipoles, assumed to lie along the C − H bonds probed, defined in the laboratory frame XY Z c) 3D nonlinear dipoles distribution defined into the focal volume f (θ, ϕ). d) 3D nonlinear dipoles distribution which contributes to the signal. e) ˜p(ϕ) distribution function. f) Decomposition of the distribution function ˜p(ϕ) on the spherical function basis. (Color online)
to find individual nonlinear dipoles with an orientation θ and ϕ is defined by a function f (θ, ϕ). The macroscopic nonlinear susceptibility tensor in the laboratory frame is defined as the summation over individual dipoles probed in the focal volume
χIJ KL= N Z π 0 Z 2π 0 f (θ, ϕ)(I.z)(J.z)(K.z)(L.z)γ sin θdθdϕ, (1)
where N is the molecular bonds density, (I.z) is the projection of the direction I along z, γ is the microscopic tensor of one elementary molecular bond, see Fig. 1.
Due to the electromagnetic fields which are lying in the XY sample plane, only the X and Y components of the macroscopic tensor are probed. The out-of plane contributions of the collection of dipoles in the focal volume will consequently contribute far less than the in-plane ones in the θ orientational average. From Eq. 1, the in-plane components of the macroscopic tensor are
χXXXX = N γ R2π 0 p(ϕ) cos 4(ϕ)dϕ χY Y Y Y = N γ R2π 0 p(ϕ) sin 4(ϕ)dϕ χXXY Y = N γ R2π 0 p(ϕ) cos 2(ϕ) sin2(ϕ)dϕ χXY Y Y = N γ R2π 0 p(ϕ) cos(ϕ) sin 3(ϕ)dϕ χY XXX = N γ R2π 0 p(ϕ) cos 3(ϕ) sin(ϕ)dϕ, (2)
with
p(ϕ) = Z π
0
sin4θf (ϕ, θ) sin θdθ, (3)
where the term sin4(θ) weights the contribution of molecular bonds depending on their tilt angle θ. Without loss of generality, the molecular bonds distribution in the XY plane can be described by a function of ϕ. Moreover, Eq. 2 clearly show that the tensor components are sensitive to the even part of the p(ϕ) function. Furthermore, decomposing p(ϕ) onto its orders of symmetry leads to only three non vanishing contributions of this distribution function to the third order susceptibility: its isotropic contribution as well as its second and fourth orders. Thereby, the 2D distribution function of Eq. 3 can be expanded as a truncated Fourier series limited to even order terms, see Fig. 1e-f, and modeled by7
˜
p(ϕ) = p0+ p2cos(2ϕ) + q2sin(2ϕ)
+p4cos(4ϕ) + q4sin(4ϕ).
(4)
Then, from Eq 2 and 4, the macroscopic susceptibility components in the OXY plane can be written with respect to the coefficients of the distribution function as
χXXXX = N γπ8 (6p0+ 4p2+ p4) χY Y Y Y = N γπ8 (6p0− 4p2+ p4) χXXY Y = N γπ8 (2p0− p4) χXY Y Y = N γπ8 (2q2− q4) χY XXX = N γπ8 (2q2+ q4). (5)
The in-plane tensor components are clearly dependent on the matter organization described by the five distribution function parameters p0, p2, q2, p4 and q4. Henceforth, the CARS
and SRS intensities have to be measured using different sets of polarization to recover these parameters, as described in the next section.
Polarization-resolved SRS intensity
The stimulated Raman gain (SRG) process is based on the interference between the electric field induced by the nonlinear dipole at ωs and the incoming field at ωs.13,14 Due to this
het-erodyne behavior, the gain on the Stokes beam at resonance is linear with the susceptibility, and reads17
ISRG ∝ P
IJ KLχIJ KLE ∗
p,IEs,JEp,KEs,L∗ , (6)
where Ep denotes the pump electric field, Es the Stokes electric field, and χ the resonant
susceptibility tensor as previously discussed. Both incident fields Ep and Es are linearly
polarized. Denoting α the angle of Esand Epwith respect to the X axis (see inset Fig 2), the
electric fields can be expressed in the macroscopic frame as EX = E cos α and EY = E sin α.
Then Eq 6 becomes
ISRG(α) ∝ χXXXXcos4α + 4χXXXY cos3α sin α
+6χXXY Y cos2α sin2α
+4χXY Y Y cos α sin3α + χY Y Y Y sin4α.
(7)
This equation can be rearranged as
ISRG(α) ∝ a0 +a2cos(2α) + b2sin(2α) +a4cos(4α) + b4sin(4α), (8) where a0 = 3π4 p0 a2 = π2p2 a4 = π8p4 b2 = π2q2 b4 = π8q4. (9)
The polarization-resolved SRS intensity is thus described as a truncated Fourier series where the Fourier coefficients are linearly related to the distribution function parameters. This way, the polarization-resolved SRS signal allows one to retrieve directly how the unitary dipoles,
representing the molecular bonds, are oriented and distributed into the focal volume.
Polarization-resolved CARS Intensity
Exact calculation
The CARS dipole along the direction I (X or Y ), expressed as a function of the nonlinear susceptibility and the electric fields, is
PI(ωas) =
X
J KL
χIJ KLEs,J∗ Ep,KEp,L. (10)
The CARS intensity behind a polarizer oriented along X is thus proportional to the square of the CARS dipole which leads to
ICARS X ∝ X J KL M N O χXJ KLχ∗ XM N OE ∗ JEKELEMEN∗E ∗ O. (11)
The total intensity is thus the summation of the intensity along X plus the intensity along Y ,
ICARS = ICARS
X + IYCARS. (12)
Both incident Ep and Es are linearly polarized and rotated in the OXY plane in the
polar-ization resolved SRS operating mode. ICARS is rewritten as a truncated Fourier series where
the angular frequencies are going up to the sixth order due to the presence of six electric fields in the intensity relationship.7,18 In this case,
ICARS(α) ∝ a0 +a2cos(2α) + b2sin(2α)
+a4cos(4α) + b4sin(4α)
+a6cos(6α) + b6sin(6α),
where a0 = 641(36p20 + 10p22+ 10q22+ p24+ q42) a2 = 321(24p0p2+ 3p2p4+ 3q2q4) a4 = 323(p22− q22+ 2p0p4) a6 = 321(p2p4− q2q4) b2 = 321(p0q2+ 3p2q4− 3p4q2) b4 = 163(2p0q4+ p2q2) b6 = 321(p2q4+ p4q2). (14)
In the polarization-resolved CARS signal, the retrieval of the distribution function from the Fourier coefficients is therefore not straightforward. The nonlinear dependence of the Fourier coefficients with respect to the distribution function parameters is due to the nonlinear dependence of the CARS signal with respect to the susceptibility tensor, which is not the case in SRS. To estimate the distribution function parameters, an iterative algorithm can be employed to find the right set of parameters.7
Approximate calculation
The nonlinear dependence between the polarization-resolved CARS intensity and the distri-bution function leads in practice to a complex and time consuming data processing. Never-theless, an approximation can be done in order to simplify and decrease the time of analysis. As the CARS intensity is quadratically dependent on the susceptibility, it can be written as the square of a truncated Fourier series
˜
ICARS(α) ∝ [a00+ a02cos(2α) + b02sin(2α) +a04cos(4α) + b04sin(4α)]2.
When Eq. 15 is developed, the parameters a0, a2, a4, b2 and b4 can be expressed as functions of a00, a02, a04, b02 and b04, a0 = a 02 0 + a 02 2/2 + b 02 2/2 + a 02 4 + b 02 4 a2 = 2a00a 0 2+ a 0 2a 0 4+ b 0 2b 0 4 a4 = a 02 2/2 − b 02 2/2 + 2a00a04 a6 = a02a04− b02b04 b2 = 2a00b 0 2+ a 0 2b 0 4− a 0 4b 0 2 b4 = 2a00b 0 4+ a 0 2b 0 2 b6 = a02b 0 4+ a 0 4b 0 2. (16)
Eq. 16 shows a clear similarity to Eq. 14. From this, an approximate relationship can be found between the parameters a0n, b0n and the parameters pn, qn,
a00 ≈ 3π 4 p0 a 0 2 ≈ π 2p2 a 0 4 ≈ π 8p4 b02 ≈ π 2q2 b 0 4 ≈ π8q4. (17)
In a first approximation, the square root of the polarization-resolved CARS signal is very similar the polarization-resolved SRS signal. A numerical comparison was done between the exact and the approximate expressions of the CARS signal, and the two outcomes were seen to be identical within 1% whatever the set of an, bn parameters considered. The negligible
difference comes from the eighth frequency present in ˜I, whereas I contains up to the 6th order frequency in its α dependence. In what follows, the data analysis uses the approximate calculation.
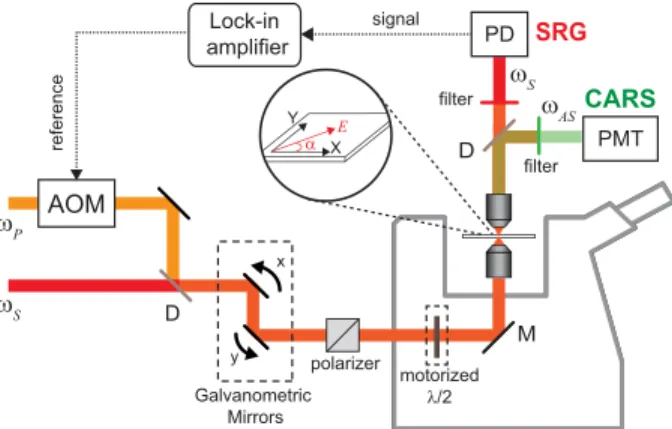
ωS ωP Galvanometric Mirrors PMT filter CARS AOM D PD signal filter SRG x y motorized λ/2 polarizer D reference ωAS ωS X Y E α Lock-in amplifier M
Figure 2: Description of the polarization-resolved CRS microscope setup. The linear po-larization orientation of both exciting beams is controlled by a motorized achromatic half wave plate placed before the excitation objective. AOM: Acousto-optic modulator, PD: Photodiode, PMT: Photomultiplier tube, D: Dichroic mirror, M: Metallic mirror. (Color online)
Data processing
CARS and SRS polarimetric stacks are obtained by measuring a sequence of CARS and SRS images for different polarization angles α between 0 and 175o with a 5o step. Consequently,
pICARS(α) and ISRS(α) can be easily extracted on each pixel. According to Eq. 9 related
to SRS and Eq. 17 related to CARS, the distribution function parameters p0, p2, q2, p4, q4
are determined on each pixel. From the distribution function parameters, four parameters can be introduced to quantify the symmetry order magnitude and the main orientation of the distribution function. First, we introduce S2 and S4 to quantify the order of symmetry
regardless of the orientation of the molecular bonds7
S2 = p10pp22+ q22
S4 = p10pp24+ q42.
Moreover, we introduce the angles ϕ2 and ϕ4 to describe respectively the order 2 and the
order 4 orientations of the distribution function in the sample plane
ϕ2 = 1 2arctan(q2/p2), if p2 > 0 1 2arctan(q2/p2) + π 2, else (19) ϕ4 = 1 4arctan(q4/p4), if p4 > 0 1 4arctan(q4/p4) + π 4, else . (20)
These four independent parameters play distinct roles in the description of the function distribution. The angle ϕ2 reports on the main orientation of the distribution function. This
can be emphasized by writing all angular dependences relative to ϕ2 ,19
S4(s) = S4cos(4(ϕ4 − ϕ2)) (21)
S4(a) = S4sin(4(ϕ4 − ϕ2)). (22)
S4(s) describes the magnitude of the ”symmetric” part of the order 4 contribution to the distribution function p(ϕ), meaning that the symmetric order four is either aligned or at π/4 with ϕ2. The S4(a) parameter is the ”antisymmetric” order four, reporting a skewness in the
distribution function.19
The SRS and CARS polarization-resolved intensities are finally expressed as
ISRS(α) pICARS(α) ∝ 1+ 2 3S2cos(2(α − ϕ2)) +16S4(s)cos(4(α − ϕ2)) +16S4(a)sin(4(α − ϕ2)), (23)
to retrieve the distribution function parameters S2, S (s) 4 , S (as) 4 and ϕ2.
Experiments
Multilamellar vesicles (MLVs) were made from DPPC lipids (1,2-dipalmitoyl-sn-glycero-3-phosphocholine). Thin films, made of pure DPPC were hydrated in phosphate-buffered saline (PBS, pH 7.4) for 1 hour above the main phase transition temperature (45oC) leading to
MLVs of 1-30 µm size according to the procedure described in the literature.20
The experimental setup is sketched in Fig. 2. A modelocked Nd:YVO4 MOPA laser (Plecter, Coherent, 80 MHz repetition rate) delivers synchronous 7 ps pulses at λS = 1064 nm
(used as Stokes beam) and λ = 532 nm. This frequency doubled beam is used to pump an OPO (APE Levante OPO) which generates the tunable pump/probe pulse with a maximal tuning range of λP=730-960 nm. The two beams are overlapped in time and space and sent
into a custom made scanning microscope.21,23 In the CARS operation mode the anti-Stokes
signal is filtered and detected, in the forward direction, with an photomultiplier tube (R9110, Hamamatsu) coupled with a preamplifier (C7950, Hamamatsu). In the SRS operation mode, the pump beam is modulated in amplitude at the frequency of 20 MHz thanks to an acousto-optic modulator (AOM - AAOptoelectronic MT200 A0,2-800). The stimulated Raman gain (SRG) induced on the Stokes beam is detected in the forward direction by means of a high speed photodiode and a fast lock-in amplifier manufactured by APE.15 The collection objective lens (NA=0.6, LUCPlanFLN 40x, Olympus) has a larger numerical aperture than the excitation one (NA=0.45, LCLPLN 20x IR, Olympus) to minimize artifacts induced by cross phase modulation and thermal lensing.22For CARS and SRS measurements, the power
of the Stokes and pump beams in the sample plane was set respectively to 28 mW and 39.5 mW. Each spectral image results from an average of 3 images, using a pixel dwell time of 100 µs. To perform polarization resolved measurements, both exciting beams are linearly polarized before the excitation objective, and an achromatic half-waveplate mounted in a
step rotation motor allows rotation of the incident pump and Stokes polarizations at the same time. In this configuration, polarization distortions introduced by the experimental setup, such as ellipticity, were measured as negligible.
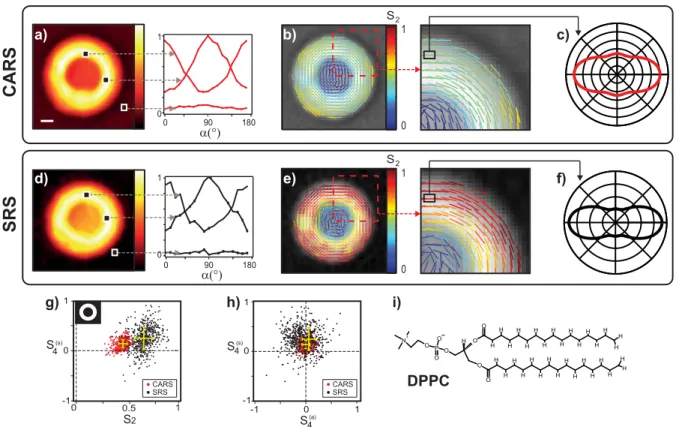
180 90 0 α(°) α(°) ν=2836 cm-1 i) DPPC H O O O P O O O N+ H H H H H H H H H H H H H H H H O O H H H H H H H H H H H H H H H H a) c) f) g) h) -1 0 1 1 0 -1 0 1 0 1 S4(s) S4(s) -1 0.5 CARS d) 1 0 S2 e) b) 1 0 S2 S2 S4(a) 180 90 0 0 1 0 1 SRS CARS SRS CARSSRS
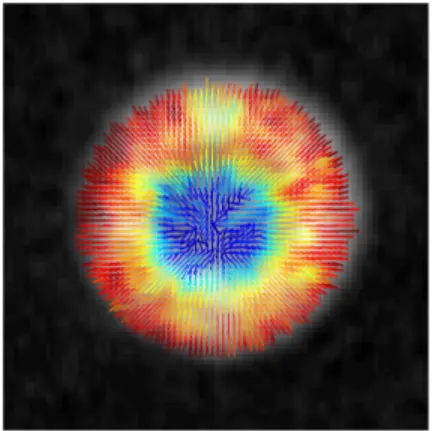
Figure 3: (a) Total CARS intensity at 2836 cm−1and polarization resolved signal in different regions of interest in the MLV. The scale bar represents 10µm. (b) The stick orientation represents ϕ2 and the color indicates the value of S2. (c) Distribution function ˜p(ϕ) for a
given pixel. (d-f) Total SRS intensity at 2850 cm−1 and identical analysis as for CARS. (g-h) Plot of S2 and S4 values (in red for CARS, in black for SRS) for each pixel of the image
within a given mask (inset Fig 3g) applied to remove all the pixels from the background. The center of the yellow cross represents the mean, and the error bar represents the standard deviation of the measured values. (i) Schematic representation of a DPPC molecule. (Color online)
Results
Polarization-resolved CARS and SRS intensities on multilamellar
vesicles
The experimental results are depicted in Fig. 3. The MLVs form spherical objects made by several concentric layers where the DPPC lipids, see Fig. 3i, are radially oriented whereas the CH2 bonds are tangentially oriented.7,26 CARS and SRS polarization resolved image
stacks were recorded on the same MLV, at the CH2 stretching mode resonance. Figure
3a,d is the summation over the whole stack and shows a strong signal from the equatorial plane of the MLV. The background in the CARS image is non zero and comes from non resonant contribution of the surrounding water whereas the SRS image is background free. The polarization-resolved intensities in the MLV are strongly modulated as function of the incident polarization angle α as being the signature of oriented nonlinear induced dipoles, whereas the surrounding background shows no polarization dependence, as expected from an isotropic medium.
From the analysis of the polarization-resolved intensities previously discussed, the dis-tribution function parameters are measured on each pixel (Eq 23). Superimposed to the black and white intensity image, a stick is added on each pixel whose orientation is given by ϕ2 and whose color follows the S2 value scale (Fig. 4b,e). The ϕ2 orientation within the
MLV shows that the CH2 bonds are found to be oriented tangentially with respect to the
MLV circular contour, as expected from the lipids geometry in a concentric arrangement and the arrangement of the CH2 symmetric stretching bonds along the lipid chains. The
S2 values reveal a strong organization in the equatorial plane. In the center of the MLV, S2
is close to zero as expected for random lipids orientation. The S4 values are much weaker
revealing a function distribution mainly unidirectional. To visualize the statistical extent of the measured distribution function parameters over the oriented region of the MLV section, a mask has been applied to the CARS and SRS images, keeping all intensity contributions
well above the background (see inset Fig. 3g). For each remaining pixel of the image, S4(s)as function of S2 and S4(a)are reported in a 2D graph as represented Fig. 3g-h. The distribution
of observed data points is due to the heterogeneity in the MLV and the noise of the measure-ment. Figure 3g-h shows first that the S4(a) values obtained from both CARS and SRS are centered on zero, which is a signature of angular distributions of cylindrical symmetry, as expected from the arrangement of the C − H molecular bonds in the MLV geometry. More strikingly, a clear difference can be observed in the S2 and S
(s)
4 coefficients obtained from
CARS and SRS analyses. Using the obtained symmetry parameters and Eq. 4, it is possible to represent the reduced distribution function ˜p(ϕ) read-out by polarization resolved CARS and SRS. This distribution, represented in Fig. 3c-f, shows an obvious anisotropic shape along the CH2 vibration bond axes, with minor fourth order contributions, especially in
the SRS analysis. In order to explain this difference, a finer analysis of the nature of these processes is required, in particular a spectral investigation was performed around the lipid resonance, as described in the next section.
Spectral behavior of CARS and SRS
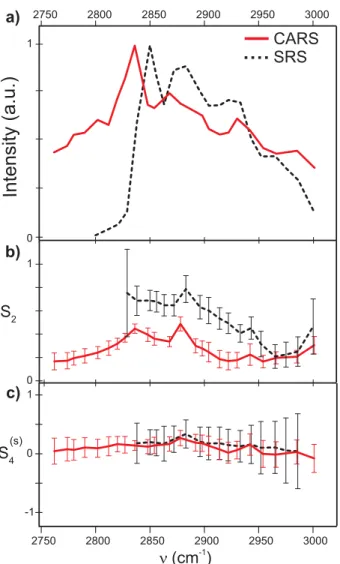
A polarization resolved CARS and SRS analysis has been performed in the whole 2750 cm−1 to 3000 cm−1 spectral region of the lipid vibrational resonance, in the same MLV equatorial plane as described in the previous section. The total intensity depicted in Fig. 4a shows a strong signal around the lipid resonance. Three strong CARS and SRS features are distin-guishable: the two bands around 2848 cm−1 and 2880 cm−1 correspond to the symmetric and asymmetric CH2 stretching vibrations, whereas the band at 2935 cm−1 corresponds to
the symmetric CH3 stretching .24 Fig 4a shows a typical CARS spectrum representative
of a coherent superposition of a spectrally-independent non resonant signal, and a complex spectral resonance. In contrast, the SRS spectrum reproduces directly the shape of a lipid Raman spectrum. Moreover, the SRS spectrum is clearly background-free out of resonance,
Intensity (a.u.)
S2 S4(s) CARS SRS (cm )-1 1 0 -1 0 1 3000 2950 2900 2850 2800 2750 a) b) c) 1 0 3000 2950 2900 2850 2800 2750Figure 4: a) spectra of the MLV. b) S2 as a function of the frequency for CARS (line) and
SRS (dashed line). c) S4(s) as a function of the frequency for CARS (line) and SRS (dashed line). (Color online)
mum intensity.
Fig. 4b shows the S2 spectral dependence, obtained from a polarization analysis at each
addressed wavenumber, for both CARS and SRS. The reported values are obtained from the average and standard deviation over a collection of pixels within the mask of interest depicted in Fig. 3g. The values of S2 for the CARS starts from a low value out of resonance to reach
two maxima around the symmetric and asymmetric CH2 stretching (S2 ≈ 0.4). The S2
values for the symmetric and asymmetric stretching are the same because the CH2 angular
vibrational bond symmetry might be different, the dominant effect in the obtained symmetry orders is the overall angular extent of the individual dipoles constituting these vibrational bond, represented here by the CH2 directions. The decrease of S2 in the intermediate
spectral region between these two resonances is more difficult to interpret, mainly because the overlapped contribution of the neighbouring spectral regions become non negligible. The S2 value reached at the CH3 stretching mode is obviously lower than for the CH2 stretching
modes. The CH3 group, present at the head and the tail of the lipid is simply less oriented
in the MLV, most probably because of its lowered angular constraint at the extremity of the lipid leaflets, see Fig. 3i. The values of S2 for SRS show the same behavior with high values
(S2 ≈ 0.7) at the CH2 stretching resonances (the analysis has been restricted to a frequency
domain where the SRS signal was measurable). Similarly as for CARS, the CH3 vibrational
bond region shows a lower S2 value.
Figure 4c represents the S4(s) values for SRS and CARS as functions of the wavenumber. We observe that the S4(s) values do not surpass 0.25, showing the absence of high order in the distribution function as reported in Ref.7
Discussion
Even though the CARS and SRS processes are different, both techniques are expected to lead to the same molecular orientational distribution. However, as seen in Fig. 3 and 4, a clear difference is visible on the S2 values measured in MLV, which are seen to be systematically
higher in the SRS operating mode. Indeed, the assumption made in the theoretical part related to the CARS operating mode does not take into account the other contributions from the non resonant part. Indeed, the CARS intensity spectrum shows a non resonant contribution that can disturb the interpretation of the values obtained by the polarization-resolved technique.
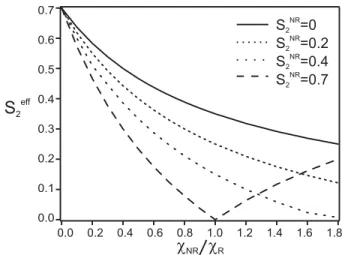
0.7 0.6 0.5 0.4 0.3 0.2 0.1 0.0 1.8 1.6 1.4 1.2 1.0 0.8 0.6 0.4 0.2 0.0 cNR cR S =02 NR S =0.2 S =0.4 S =0.7 2 2 2 NR NR NR S2 eff Figure 5: SR
2 as function of the ratio between χN R and χR for different S2N R. The χR is
made with SR
2 = 0.7, ϕR2 = 0
◦ and S(s)
4 = 0. The χN R is made with different values of S2N R
and with an orientation ϕN R2 = 90◦
veloped to quantify the non resonant background impact on the measured S2 values. While
SRS is only sensitive to the imaginary part of the susceptibility, CARS is sensitive to the total susceptibility tensor χ:
χ = χN R+ χR(Ω) (24)
The total susceptibility read by the CARS process is then the susceptibility read by the SRS process plus an unknown non resonant contribution. If an isotropic non resonant background (S2N R = 0) is present, the polarization-resolved CARS intensity modulation is expected to decrease as a function of the magnitude of the non resonant part. Furthermore, if the non resonant background is itself organized (SN R
2 6= 0), the interpretation can be even more
difficult.27
In our simple model, a resonant susceptibility χR is assumed to originate from an
anisotropic distribution of dipoles for which SR
2 = 0.7 (as obtained from SRS measurements
on MLVs in the CH2 symetric stretching bond region), and SR
4 = 0. The corresponding χR
susceptibility is calculated using Eq. 2. A non resonant susceptibility χN R is then added to this resonant part in order to build the whole susceptibility χ read-out by the CARS contrast. χN R is assumed to originate from various natures of symmetry orders, from totally isotropic
(SN R
2 = 0) to highly organized (S2N R = 0.7), with S4N R = 0. These non resonant second
or-ders are moreover assumed to lie perpendicularly to the resonant contributions (ϕR
2⊥ϕN R2 ),
consistent with the fact that non resonant signal comes mainly from electronic susceptibili-ties along the lipid tail, while the resonant CH2 stretching bond orients perpendicularly to
this tail.7From the resulting simulated polarization-dependent CARS intensity (Eq. 11), the
”effective” S2ef f values are deduced. These values are depicted in Fig. 5 for various strengths of non resonant with respect to resonant susceptibilities, and various symmetries of the non resonant background. Figure 5 shows that S2ef f decreases with an increasing strength of the non resonant contribution, emphasizing the possible sources of bias induced by a non negligible non resonant background. In such case, the resulting read-out distribution, en-compassing both resonant and non resonant contributions, can indeed become close to an apparent isotropic distribution (S2ef f = 0) in cases where SR
2 = S2N R.
Our experimental results described above have then been confronted to this theoretical model. The CARS non resonant background intensity is seen to be about 30% of the max-imum resonant intensity, which corresponds roughly to χN R/χR ≈ √0.3 ≈ 0.55. The S2N R values obtained in the non resonant region are within the range [0.3-0.5] (Fig.4), which is in agreement with previously reported values in similar MLVs .7 Similarly to what is assumed
in the model described above, it has been furthermore experimentally reported that the non resonant part in lipids is dominated by the nonlinear susceptibility of carbon-carbon bonds.5
The mean direction of the C − C bonds are oriented at a right angle of the CH2 bonds in
MLV, supporting the assumption that ϕR2 and ϕN R2 are perpendicular. Following Fig. 5, this situation corresponds to a S2ef f which would lie around [0.3-0.4], which corresponds indeed to the experimental values obtained in Figs. 3 and 4. This analysis shows that molecular orientational order values measured in the context of polarized CARS imaging can be easily under-estimated due to the existence of a non negligible non resonant background. Mea-suring a reliable orientational information can be nevertheless obtained providing that the
of SRS, this issued does not occur providing that sources of artifact have been removed.22
Conclusion
A polarization-resolved method was performed in order to read out the parameters of molec-ular orientational organization using CRS microscopy. We found that SRS and CARS are not sensitive to the same degree of organization due to their intrinsic properties. SRS pro-vides reliable information about the molecular bonds organization, whereas CARS can be biased by a non resonant contribution. In the case of lipids organization in MLV, the non resonant contribution is known and can be incorporated to the CARS analysis in order to explain the differences observed. More generally, the method described here to analyze polarization-resolved SRS and CARS intensity will allow new, fast and accurate observation of the molecular organization in biological samples.
† These authors contributed equally to this work.
Acknowledgement
The authors acknowledge finacial support from the Centre National de la Recherche Scien-tifique (CNRS), Aix Marseille University A∗Midex (No. ANR-11-IDEX-0001-02). This work has been supported by Contracts ReceptORIENT (No. ANR-2010-BLAN-150902), France-BioImaging (No. ANR-10-INBS-04-01), France Life Imaging (No. ANR-11-INSB-0006) and by the Conseil Regional Provence Alpes Cote dAzur Region. F.-Z.B. was supported by the ErasmusMundus Doctorate Program Europhotonics (Grant No. 159224-1-2009-1-FR-ERA MUNDUS-EMJD).
References
(1) Brasselet S. Polarization Resolved Nonlinear Microscopy: Application to Structural Molecular and Biological Imaging. Adv. Opt. Photon. 2011, 3, 205-271
(2) Stoller P.; Kim B.-M.; Rubenchik A. M.; Reiser K. M.; Da Silva L. B. Polarization-Dependent Optical Second-Harmonic Imaging of Rat-Tail Tendon. J. Biomed. Opt. 2002, 7, 205-214
(3) Gusachenko I.; Houssen Y. G.; Tran V.; Allain J.-M.; Schanne-Klein M.-C. Polarization-Resolved Second-Harmonic Microscopy in Tendon Upon Mechanical Stretching. Bio-phys. J. 2012,102, 2220-2229
(4) Duboisset J.; A¨ıt-Belkacem D.; Roche M.; Rigneault H.; Brasselet S. Generic Model of the Molecular Orientational Distribution Probed by Polarization Resolved Second Harmonic Generation. Phys. Rev. A 2012, 85, 043829
(5) Zimmerley M.; Mahou P.; D´ebarre D.; Schanne-Klein M.-C.; Beaurepaire E. Prob-ing Ordered Lipid Assemblies with Polarized Third-Harmonic-Generation Microscopy. Phys. Rev. X 2013, 3, 011002
(6) Munhoz F.; Rigneault H.; Brasselet S. Polarization-Resolved Four-Wave Mixing for Structural Imaging in Thick Tissues. J. Opt. Soc. Am. B 2012, 29, 1541-1550
(7) Bioud F-Z.; Gasecka P.; Ferrand P.; Rigneault H.; Duboisset J.; Brasselet S. Structure of Molecular Packing Probed by Polarization-Resolved Nonlinear Four-Wave Mixing and Coherent Anti-Stokes Raman-Scattering Microscopy. Phys. Rev. A 2014, 89, 013836
(8) Cheng J. X.; Pautot S.; Weitz D. A.; Xie X. S.; Ordering of Water Molecules Be-tween Phospholipid Bilayers Visualized by Coherent Anti-Stokes Raman Scattering Microscopy, Proc. Natl. Acad. Sci. 2003, 100, 9826-9830
(9) Zimmerley M.; Younger R.; Valenton T.; Oertel D. C.; Ward J. L.; Potma E. O. Molecular Orientation in Dry and Hydrated Cellulose Fibers: A Coherent Anti-Stokes Raman Scattering Microscopy Study. J. Phys. Chem. B 2010, 114, 10200-10208
(10) Fu Y.; Huff T.B.; Wang H.-W.; Wang H.; Cheng J.-X. Ex Vivo and in Vivo Imaging of Myelin Fibers in Mouse Brain by Coherent Anti-Stokes Raman Scattering Microscopy. Opt. Express 2008, 16, 19396-19409
(11) Zumbusch A.; Holtom G. R.; Xie X. S. Three-Dimensional Vibrational Imaging by Coherent Anti-Stokes Raman Scattering. Phys. Rev. Lett. 1999, 82, 41424145
(12) Wang H.; Fu Y.; Zickmund P.; Shi R.; Cheng J.-X. Coherent Anti-Stokes Raman Scattering Imaging of Axonal Myelin in Live Spinal Tissues. Biophys. J. 2005, 89, 581-591
(13) Bloembergen N. The Stimulated Raman Effect. A. J. Phys. 1967, 35, 989-1023
(14) Freudiger C. W.; Min W.; Saar B. G.; Lu S.; Holtom G. R.; He C.; Tsai J. C.; Kang J. X.; Xie X. S. Label-Free Biomedical Imaging with High Sensitivity by Stimulated Raman Scattering Microscopy. Science 2008, 19, 1857-1861
(15) Saar B. G.; Freudiger C. W.; Reichman J.; Stanley C. M.; Holtom G. R.; Xie X. S. Video-Rate Molecular Imaging in Vivo with Stimulated Raman Scattering. Science 2010, 3, 1368-1370
(16) Davis R. P.; Moad A. J.; Goeken G. S.; Wampler R. D.; Simpson G. J. Selection Rules and Symmetry Relation for Four-Wave Mixing Measurements of Uniaxial Assemblies, J. Phys. Chem. B 2008, 112, 5834-5848
(17) Munhoz F.; Brustlein S.; Hostein R.; Berto P.; Brasselet S.; Rigneault H. Polarization Resolved Stimulated Raman Scattering: Probing Depolarization Ratios of Liquids. J. Raman Spectrosc. 2012, 43, 419424
(18) De Vito G.; Bifone A.; Piazza V. Rotating-Polarization CARS microscopy: Combining Chemical and Molecular Orientation Sensitivity. Opt. Express 2012, 20, 29369-29377
(19) Ferrand P.; Gasecka P.; Kress A.; Wang X.; Bioud F.-Z.; Duboisset J.; Brasselet S. Ultimate Use of Two-Photon Fluorescence Microscopy to Map Orientational Behavior of Fluorophores. Biophys. J. 2014, 106, 2330-2339
(20) Bangham A. D.; Hill M. W.; Miller N. G. A. Preparation and Use of Liposomes as Models of Biological Membranes. Methods in Membrane Biology 1974, 01, 1-68
(21) Brustlein S.; Ferrand P.; Walther N.; Brasselet S.; Billaudeau C.; Marguet D.; Rigneault H. Optical Parametric Oscillators Based Light Source for Coherent Raman Scattering Microscopy: a Practical Overview. J. Biomed. Opt. 2011, 16, 021106
(22) Berto P.; Andresen E. R.; Rigneault H. Background-Free Stimulated Raman Spec-troscopy and Microscopy. Phys. Rev. Lett. 2014, 112, 053905
(23) Ferrand P. Scanning Imaging: a General Purpose Virtual Instrument for the Control of High-Speed Data Acquisition Devices. submitted
(24) Levin I. W.; Clark R. J. H.; Hester R. E. Advances in Infrared and Raman Spectroscopy. Eds. Wiley Heyden: New York, 1984, 11, 1-48
(25) Potma E. O.; Xie X. S. Detection of Single Lipid Bilayers with Coherent Anti-Stokes Raman Scattering (CARS) Microscopy, J. Raman Spectrosc. 2003, 34, 642-650
(26) Wurpel G. W.; Rinia H. A.; Muller M. Imaging Orientational Order and Lipid Density in Multilamellar Vesicles with Multiplex CARS Microscopy. J. Microsc. 2005, 218, 37-45
(27) Munhoz F.; Rigneault H.; Brasselet S. High Order Symmetry Structural Properties of Vibrational Resonances Using Multiple-Field Polarization Coherent Anti-Stokes Raman Spectroscopy Microscopy. Phys Rev Lett. 2010, 105, 123903