HAL Id: hal-02983894
https://hal.inria.fr/hal-02983894
Submitted on 4 Nov 2020
HAL is a multi-disciplinary open access
archive for the deposit and dissemination of
sci-entific research documents, whether they are
pub-lished or not. The documents may come from
teaching and research institutions in France or
abroad, or from public or private research centers.
L’archive ouverte pluridisciplinaire HAL, est
destinée au dépôt et à la diffusion de documents
scientifiques de niveau recherche, publiés ou non,
émanant des établissements d’enseignement et de
recherche français ou étrangers, des laboratoires
publics ou privés.
To cite this version:
Eslam Mohammed, Di Meng, Sergi Pujades. Morphology-Based Individual Vertebrae Classification.
Shape in Medical Imaging. ShapeMI 2020, 12474, Springer, pp.134-144, 2020, Lecture Notes in
Com-puter Science, �10.1007/978-3-030-61056-2_11�. �hal-02983894�
individual vertebrae classification
Eslam Mohammed1, Di Meng1, and Sergi Pujades1Inria, Univ. Grenoble Alpes, CNRS, Grenoble INP, LJK, France
Abstract. The human spine is composed, in non-pathological cases, of 24 vertebrae. Most vertebrae are morphologically distinct from the others, such as C1 (Atlas) or C2 (Axis), but some are morphologically closer, such as neighboring thoracic or lumbar vertebrae. In this work, we aim at quantifying to which extent the shape of a single vertebra is dis-criminating. We use a publicly available MICCAI VerSe 2019 Challenge dataset containing individually segmented vertebrae from CT images. We train several variants of a baseline 3D convolutional neural network (CNN) taking a binary volumetric representation of an isolated vertebra as input and regressing the vertebra class. We start by predicting the probability of the vertebrae to belong to each of the 24 classes. Then we study a second approach based on a two-stage aggregated classification which first identifies the anatomic group (cervical, thoracic or lumbar) then uses a group-specific network for the individual classification. Our results show that: i) the shape of an individual vertebra can be used to faithfully identify its group (cervical, thoracic or lumbar), ii) the shape of the cervical and lumbar seems to have enough information for a reliable individual identification, and iii) the thoracic vertebrae seem to have the highest similarity and are the ones where the network is confused the most. Future work will study if other representations (such as meshes or pointclouds) obtain similar results, i.e. does the representation have an impact in the prediction accuracy?
Keywords: Vertebrae identification· vertebrae group classification.
1
Introduction
The human spine is usually composed of 24 vertebrae. They are structured in three anatomic groups: seven cervical (C1-C7), twelve thoracic (T1-T12) and five lumbar (L1-L5). Each group shares morphological and functional charac-teristics motivating their anatomic group classification. The three groups are illustrated in Figure 1. Automatic identification of vertebrae in spinal imaging, such as Computed Tomography (CT) or Magnetic Resonance Imaging (MRI), is crucial in the context of clinical diagnosis and surgical planning. While some vertebrae, such as the first cervical (C1) have a very distinctive shape, other ver-tebrae, such as neighboring thoracic or lumbar vertebrae share a visually similar morphological appearance.
Fig. 1. Illustration of the shape of the vertebrae [10]. I - Representative shape of cervical C3-C7. II - Representative shape of the thoracic T1-T12. III - Representative shape of the lumbar L1-L5.
In this work, we aim at quantifying to which extent the shape of a single ver-tebra is discriminating. This knowledge aims at providing a source of relevant information to the global full spine identification methods. For example, distinc-tive vertebrae can be used as reliable anchor points in global methods, whereas the contribution of unreliable predictions can be diminished. As of today, the classification of all vertebrae in a CT volume still remains a major challenge for the community [14].
In this work we propose to train a 3D convolutional neural network (CNN) architecture that, given the morphology of an isolated vertebra as input, can first predict the probability of the vertebrae to belong to each of the 24 classes. Then, motivated by the fact that the anatomic groups have distinctive features, as il-lustrated in Fig. 1, we study a second approach by first identifying the anatomic group (cervical, thoracic or lumbar), and then, its individual identification with a per-group specialized network. To perform our study, we use the publicly avail-able MICCAI VerSe 2019 Challenge dataset [14]. As the medical dataset contains a small number of annotated samples, we study the impact of several augmenta-tion techniques (rotaaugmenta-tion, translaaugmenta-tion, noise addiaugmenta-tion) in the classificaaugmenta-tion task. Preliminary results show that: i) the shape of an individual vertebra can be used to faithfully identify its group (cervical, thoracic or lumbar), ii) the shape of the cervical and lumbar seems to have enough information for a reliable individual identification, and iii) the thoracic vertebrae seem to have the highest similarity and are the ones where the network is confused the most.
Many computer-aided tasks in medical imaging were classically done via fea-ture based methods [1], [7]. AlexNet [4] was the first to obtain remarkable results
in many of the visual challenges (e.g. classification, segmentation and detection). Henceforth, researchers in medical imaging have further studied the use and im-provement of convolutional neural networks for a wide range of applications. The U-Net architecture [13] came up with an architecture for segmenting mi-croscopic images that incorporates two main paths for capturing image context and other for precise localization. The 3D multi-task fully connected architecture [6] describes a complex yet comprehensive approach for vertebral segmentation and localization based on the contextual information of the surrounding organs. Indeed, this implies relying on an accurate methodology for vertebral identifi-cation. More recently, the work proposed by [5] segmenting the vertebrae in an iterative manner, states the importance of the individual identification of verte-brae. The network can decide, using the instance memory, whether to segment the next vertebra or retrieve it. In our work we re-implement a baseline convolu-tional neural network [15] in 3D, to learn and quantify how accurately vertebrae can be identified. Also, we quantify the effect of using different augmentation techniques in the prediction accuracy of the trained models.
2
Methodology
In our work, we start by extracting and pre-processing the vertebrae data, then we augment it with different strategies. With the processed data as input we train several networks to predict the individual vertebrae classification.
2.1 Data Extraction
The dataset used for our study is the VerSe dataset [14], which is a spine dataset of 80 CT scans with voxel-level vertebral annotations. The challenge of the dataset is to achieve segmentation, identification and localization of the ver-tebrae in CT volumes. In our work we use the ground truth annotation masks of the volumes as input data to train the classifiers. We extract every individual vertebra from the CT volumes and we obtain binary volumes (masks) for each vertebra.
Connected Components. The annotation masks of the VerSe dataset contain noise in the form of small isolated groups of voxels. After extracting the individ-ual vertebrae, we use a 3D connected component algorithm to extract the biggest connected component(e.g. our desired vertebra). Then, we use the bounding box of the biggest connected component to obtain the clean volume.
Padding. Volumetric networks take as input a predefined volume structure having the same size. However, the obtained volumes from the previous step have different dimensions. To decide on the network input size we use the largest volume dimension in the dataset plus a margin of approx. 20%, namely a cube of size 128x128x128 - where a power of two was preferred. All volumes are then centered and zero-padded to match this size.
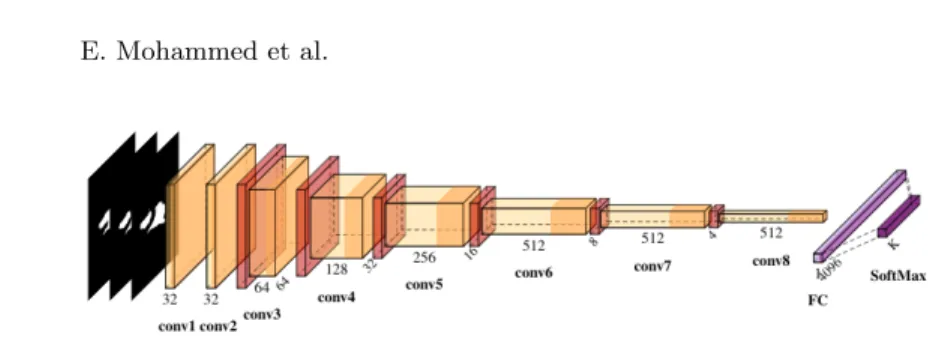
Fig. 2. The proposed 3D Convolutional Neural Network. Numbers under each block describe the size of the output kernels after each operation. Numbers on the z-axis of each block describe the size of the output cube in R3.
2.2 Augmentation
A common useful technique to overcome the scarcity of data while training neu-ral networks is data augmentation. Proposing variations of the same instance is essential to teach the network the desired invariance and robustness when there are few data samples for training. That is, adding more samples to lever-age the training process by learning more complex features that consolidate the network’s discriminative ability towards more robust features. We used four augmentation techniques: rotations, translations, scale and additive noise.
We considered the rotations around the 3 axes, hence introducing multiple orientations to the network. Because the acquired volumes have a coherent global orientation, we uniformly sampled angles θ in the range of [−20, 20]3 degrees.
In order to teach the networks the translation invariance we feed as training samples translated inputs of the desired objects. So, instead of learning a cen-tered object in the cube, samples are shifted by a δ ∈ R3offset. The translation
is uniformly sampled from the interval [−20, 20]3 mm.
Another transformation that we consider is the scaling property of an object. We applied a uniform scaling factor γ ∈ R, uniformly sampling from the interval [0.8, 1.2]
We also added additive noise to the input data. We used salt-and-pepper noise by sampling from a Poisson distribution with parameter λ = 0.05.
Our mechanism to generate an augmented dataset involves applying 10 ran-dom combinations of the aforementioned transformations to each bone. Hence, we have 10 random versions of each bone as training samples. All these transfor-mations were conducted while preserving the input size cube to 128 × 128 × 128.
2.3 Network Architecture
Our CNN architecture described in Figure 2 is composed of 8 convolutional blocks followed by a fully connected layer 4096. Then a SoftMax layer is applied to get the probabilities of each class of the input volumes. Each convolutional block (except for the early fist 2 blocks) consists of 4 layers; a 3D downsampling pooling layer of filter size 2 × 2 × 2 that shrinks the input volume to half of its size, a 3D convolutional layer of kernel 3 × 3 × 3 with stride 1 and padding 1,
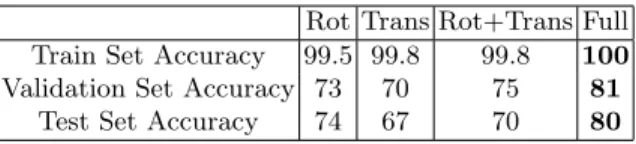
Rot Trans Rot+Trans Full Train Set Accuracy 99.5 99.8 99.8 100 Validation Set Accuracy 73 70 75 81
Test Set Accuracy 74 67 70 80
Table 1. Ablation study on the impact of the augmentation strategies. Train, valida-tion and test sets of one 8-fold are reported. The best value is consistently obtained for the full augmentation strategy, highlighted in bold.
a Batch Normalization [2] layer of momentum 0.95 for computing the running mean and variance and a ReLU non-linearity.
The settings for the network were fixed during the experiments. We used the Pytorch [9] framework for the training with batch size of 4 cubes per GPU and an initial learning rate 0.001 that decays by half every 20 epochs. The training was parallelized on 2 NVIDIA GPU Quadro RTX 5000. For the learning and weight optimization we use Adam optimizer [3] since it implies an adaptive learning rate for each layer after each step of optimization hence a faster convergence. To ensure that overfitting is avoided, we regularize our loss function using L2 regularization with penalty value 0.0001. We use a weighted cross entropy loss with the weights compensating for the low-sample classes more than those of higher sampled classes.
To train our networks, we choose the optimal model in a network optimization scheme. We use a validation set and we manually retrieve the model with the least loss and the highest accuracy. An example of the evaluation of the loss and accuracy is shown in Fig. 3, where results were obtained after the model converges without over-fitting.
3
Experiments
We perform several experiments. In the first one we study the direct classification of a vertebra in its 24 possible classes. In a second experiment we study a two-stage aggregated classification scheme. First, the anatomic group classification is performed (cervical, thoracic, lumbar), i.e. a 3-level classification problem. Then, three specialized networks are trained, one for each anatomic group.
3.1 24-level Classification
We first train our model to classify, individually, between all 24 vertebrae classes. We use all augmentation strategies presented in Sec. 2.2 and we use a random split of the data into train, validation and test. The evaluation of the loss and accuracy on the train and validation sets is presented in Fig. 3. The obtained classifications results have an accuracy of 80% on the test set. In order to assess the relevance of the different augmentations we performed the same experiment by only using one augmentation strategy. We present the results on Tab. 1, where
Fig. 3. Evaluation of the loss and accuracy of the training and validation sets for the 24 class classification optimization, w.r.t the number of epochs in training. First 8-fold.
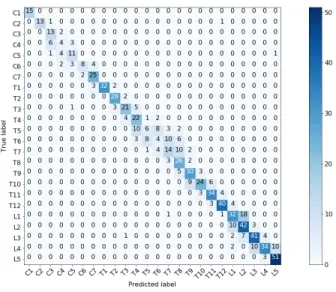
Fig. 4. Confusion matrix for the 24-level classification task.
Rot is only using the rotation augmentation, Trans is only using the translation transformation, Rot + Trans combines random transformations for each strategy on each sample, and Full includes all previous augmentations with scale and the noise augmentation. In all cases each sample was augmented with 10 random variations. The results on Tab. 1 show the benefit of the different augmentation strategies, with the Full technique systematically obtaining the best results. To further inspect the obtained results, in Fig. 4 we present the confusion matrices for the validation and test set. For the cervical and lumbar group, the only confusions arise with direct neighbouring vertebrae. However, the vertebrae in the middle of the thoracic segment (T5 to T9) present the highest confusions. Let us note that if we focus on the anatomic group predictions (cervical, thoracic and lumbar), only 1.5 % of the vertebrae were miss-classified, i.e. one anatomic
Fig. 5. Confusion matrix for the 3-level classification task.
group was predicted instead of the correct one. This high accuracy motivated us to explore a two-step classification scheme, where the anatomic group is first classified (cervical, thoracic or lumbar), and then a group-specific network is used.
3.2 3-level Classification
In the next experiment we train the same architecture network on the full aug-mented dataset but to only predict 3 labels, i.e. from a segmentation mask the network predicts an anatomic group: cervical, thoracic or lumbar.
We evaluate the full dataset using a 8-fold strategy and report the results on the aggregation of all test sets. The model achieves a 99.3% accuracy and the confusion matrix is presented in Fig. 5. These results show that the morphology of an individual vertebra contains relevant information to accurately distinguish the anatomic group of the vertebrae. Our next step is to study if a per-group model can better classify the individual vertebrae.
3.3 Individual-per-group Classification
In this experiment, we train 3 per-group specific models, namely a model for the cervical vertebrae (7-classes), one for thoracic vertebrae(12-classes) and another model for the lumbar vertebrae (5-classes).
For the cervical group we obtain an accuracy of 84.68%. Fig. 6 illustrates the confusion matrix of the cervical predictor. As expected, C1 and C2 have a very
Fig. 6. Confusion matrix for the cervical vertebrae network.
characteristic shape, making them easy for the network to be accurately iden-tified. Then, we can observe that most confusions happen between C4, C5 and C6, while the shapes of C3 and C7 seem to be more accurately distinguishable with less confusions.
For the thoracic group we obtain an accuracy of 76.92% . Fig. 7 illustrates the confusion matrix of the thoracic predictor. Most confusions arise in the section between T5 and T9, where distant vertebrae up to two neighbours are wrongly predicted (T7 for T5, T8 for T6 or T7 for T9). These results indicate that the shape of the middle section of the thoracic vertebrae is most similar, making them less individually identifiable.
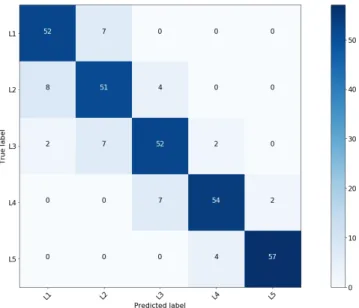
For the lumbar group we obtain an accuracy of 86.08% . Fig. 8 illustrates the confusion matrix of the lumbar predictor. It is worth noting that the failures are evenly distributed with the direct neighbouring vertebrae. While L1 and L2 have a slightly higher confusion rate, the shape of L4 and L5 seems to be more accurately distinguishable with less confusions.
3.4 Comparison: 24-level vs 3-level plus individual per-group
We studied two different approaches for the vertebrae classification: to directly predict one of the 24 vertebrae or to sequentially predict the anatomic group of a single vertebrae then use a specific per-group network.
The accuracy of the 24-level model is 71.07%, while the two steps aggregated accuracy is 85.47%.
A finer, per anatomic group analysis, shows that the 24-level model obtains an accuracy of 71.34% for the cervical vertebrae, 60.91% for the thoracic vertebrae
Fig. 7. Confusion matrix for the thoracic vertebrae network.
are consistent, with T5 to T9 presenting overall the greatest confusions.
4
Conclusion and Future Work
In this work we present a study on the classification of the vertebrae using its morphology. With the results of our current experiments we observe that the individual vertebrae classification is a non-trivial problem due to the morpho-logical similarity of neighbouring vertebrae. However, our experiments confirm that classifying a vertebrae into its anatomic group is relatively straightforward for the networks. Moreover, our preliminary results point that: i) the shapes of the cervical and lumbar vertebrae seem to have enough information for a reliable individual identification, and ii) the thoracic vertebrae (T5 - T9) seem to have the highest similarity and are the ones where the network is most confused.
Our upcoming investigation will explore two leads: the use of neighbouring vertebrae to do the predictions and the exploration of other representations.
As most confusions arise with the network predicting the neighbouring verte-brae, we will consider an individual vertebrae with its surrounding neighbouring vertebrae as input. By considering the neighbouring vertebrae we hypothesize that the surrounding context will lead to a better classification. We plan to apply the same methodology: first we will refine the 3 anatomic classes into 5 classes(cervical only, cervical+thoracic, thoracic only, thoracic+lumbar, lumbar only). Then we will consider each individual class network as before: 7 for cervi-cal vertebrae, 12 for thoracic vertebrae and 5 for lumbar vertebrae. Similarly we will compare the results of the two step method to the direct 24-level strategy.
A second lead of improvement will be to explore other representations for the input data. Instead of binary volumetric mask, we will consider distance fields [8] and point clouds [12][11]. By converting the data into different representations, we hypothesize that each representation may capture different features of the individual morphology.
While the VerSe 2019 Dataset contains some dysmorphic cases, the dataset does not have a medical label. Thus we did not assess the models performance on such anomalies. Future work will aim at quantifying the sensitivity of the trained models to pathological cases.
5
Acknowledgments
The work by Eslam Mohammed and Di Meng was funded by the SPINE PDCA project. The work by Sergi Pujades was funded by the ANR SEMBA project.
References
1. Camlica, Z., Tizhoosh, H.R., Khalvati, F.: Medical image classification via svm us-ing lbp features from saliency-based folded data. In: 2015 IEEE 14th International Conference on Machine Learning and Applications (ICMLA). pp. 128–132. IEEE (2015)
2. Ioffe, S., Szegedy, C.: Batch normalization: Accelerating deep network training by reducing internal covariate shift. arXiv preprint arXiv:1502.03167 (2015)
3. Kingma, D.P., Ba, J.: Adam: A method for stochastic optimization. arXiv preprint arXiv:1412.6980 (2014)
4. Krizhevsky, A., Sutskever, I., Hinton, G.E.: Imagenet classification with deep con-volutional neural networks. In: Advances in neural information processing systems. pp. 1097–1105 (2012)
5. Lessmann, N., van Ginneken, B., de Jong, P.A., Iˇsgum, I.: Iterative fully convo-lutional neural networks for automatic vertebra segmentation and identification. Medical image analysis pp. 142–155 (2019)
6. Liao, H., Mesfin, A., Luo, J.: Joint vertebrae identification and localization in spinal ct images by combining short-and long-range contextual information. IEEE transactions on medical imaging 37(5), 1266–1275 (2018)
7. Lo, C.S., Wang, C.M.: Support vector machine for breast mr image classification. Computers & Mathematics with Applications 64(5), 1153–1162 (2012)
8. Park, J.J., Florence, P., Straub, J., Newcombe, R., Lovegrove, S.: Deepsdf: Learning continuous signed distance functions for shape representation. In: Proceedings of the IEEE Conference on Computer Vision and Pattern Recognition. pp. 165–174 (2019)
9. Paszke, A., Gross, S., Massa, F., Lerer, A., Bradbury, J., Chanan, G., Killeen, T., Lin, Z., Gimelshein, N., Antiga, L., Desmaison, A., Kopf, A., Yang, E., DeVito, Z., Raison, M., Tejani, A., Chilamkurthy, S., Steiner, B., Fang, L., Bai, J., Chin-tala, S.: Pytorch: An imperative style, high-performance deep learning library. In: Wallach, H., Larochelle, H., Beygelzimer, A., d'Alch´e-Buc, F., Fox, E., Garnett, R. (eds.) Advances in Neural Information Processing Systems 32, pp. 8024–8035. Curran Associates, Inc. (2019), http://papers.neurips.cc/paper/9015-pytorch-an-imperative-style-high-performance-deep-learning-library.pdf
10. Picuki: Vertebrae (2020), https://www.picuki.com/media/22278381395-84745065, [Online; accessed April 27, 2020]
11. Prokudin, S., Lassner, C., Romero, J.: Efficient learning on point clouds with basis point sets. In: Proceedings of the IEEE International Conference on Computer Vision Workshops. pp. 0–0 (2019)
12. Qi, C.R., Su, H., Mo, K., Guibas, L.J.: Pointnet: Deep learning on point sets for 3d classification and segmentation. In: The IEEE Conference on Computer Vision and Pattern Recognition (CVPR) (July 2017)
13. Ronneberger, O., Fischer, P., Brox, T.: U-net: Convolutional networks for biomedi-cal image segmentation. In: International Conference on Medibiomedi-cal image computing and computer-assisted intervention. pp. 234–241. Springer (2015)
14. Sekuboyina, A., Bayat, A., Husseini, M.E., L¨offler, M., Rempfler, M., Kukaˇcka, J., Tetteh, G., Valentinitsch, A., Payer, C., Urschler, M., et al.: Verse: A vertebrae labelling and segmentation benchmark. arXiv preprint arXiv:2001.09193 (2020) 15. Simonyan, K., Zisserman, A.: Very deep convolutional networks for large-scale
![Fig. 1. Illustration of the shape of the vertebrae [10]. I - Representative shape of cervical C3-C7](https://thumb-eu.123doks.com/thumbv2/123doknet/14464218.521033/3.918.265.641.168.461/fig-illustration-shape-vertebrae-i-representative-shape-cervical.webp)