Publisher’s version / Version de l'éditeur:
Vous avez des questions? Nous pouvons vous aider. Pour communiquer directement avec un auteur, consultez la
première page de la revue dans laquelle son article a été publié afin de trouver ses coordonnées. Si vous n’arrivez pas à les repérer, communiquez avec nous à [email protected].
Questions? Contact the NRC Publications Archive team at
[email protected]. If you wish to email the authors directly, please see the first page of the publication for their contact information.
https://publications-cnrc.canada.ca/fra/droits
L’accès à ce site Web et l’utilisation de son contenu sont assujettis aux conditions présentées dans le site LISEZ CES CONDITIONS ATTENTIVEMENT AVANT D’UTILISER CE SITE WEB.
Internal Report (National Research Council of Canada. Division of Building Research), 1963-11-01
READ THESE TERMS AND CONDITIONS CAREFULLY BEFORE USING THIS WEBSITE. https://nrc-publications.canada.ca/eng/copyright
NRC Publications Archive Record / Notice des Archives des publications du CNRC :
https://nrc-publications.canada.ca/eng/view/object/?id=528a93bf-8bda-4bf7-9e46-d876197fb9c8 https://publications-cnrc.canada.ca/fra/voir/objet/?id=528a93bf-8bda-4bf7-9e46-d876197fb9c8
NRC Publications Archive
Archives des publications du CNRC
For the publisher’s version, please access the DOI link below./ Pour consulter la version de l’éditeur, utilisez le lien DOI ci-dessous.
https://doi.org/10.4224/20386563
Access and use of this website and the material on it are subject to the Terms and Conditions set forth at
Snow loads on roofs 1962-63: seventh progress report Allen, C. M.; Peter, B. G. W.
DIVISION OF BUILDING RESEARCH
SNOW LOADS ON ROOFS 1962-63
SEVENTH PROGRESS REPORTセN
BY
C.M. ALLEN AND B.G.W. PETER
ANAL
VZED-Internal Report No. 279 of the
Division of Building Research
OTTAWA
PREFACE
The specification of roof snow loads in building codes in Canada is of considerable importance because the heaviest load
that will be imposed on many roofs is the snow load. The prediction
of roof snow load is difficult because, in addition to variations in snowfall, factors such as wind, local shelter, roof shape and heat loss have a great influence on the magnitude and distribution of this load.
Some building designers believe that the design snow load values in the National Building Code of Canada 19"0 are too
conservative and point out that, in practice, these loads are reached
on very few roofs. There are, on the other hand, . many cases of very
heavy snow loads which, in some instances, have resulted in collapse. V!hat is needed, therefore, is a better understanding of snow loads to provide a basis for rational adjustment of design snow loads.
It is the purpose ッセ this report, the seventh of a series
of snow load reports, to provide information so that further
refinements of the design roof snow loads can be made'in the National
Building Code of Canada. It also presents the results of the 1962-63
survey in the form of graphs, tables, and photographs and includes a discussion of the various factors affecting roof snow loads and a number of interim conclusions.
The Division of Building Research wishes to express again its appreciation to all those observers whose active participation
made possible the survey of the 1952-53 winter. In particular,
grateful appreciation is recorded to A-station observers of the Meteorological Branch of the Department of Transport at Goose Bay and Gander, the National Parks Branch of the Department of Northern Affairs and National Resources at Glacier, B.C. and P.E.I. National
Park , Ecole Polytechnique Otontreal) セ Macdonald College (Ste. Anne de
.Bellevue), Queen's University (Kingston), University of Toronto,
University of Manitoba (WinnipeG), University of Alberta (Edmonton), University of Waterloo, Aluminum Company of Canada at Arvida,
Mr. L.A. Holbrook at Inuvik, and the Atlantic, Prairie. and
B.C. Regional Stations of the Division. Sincere thanks are also
expressed to the Chief of the Air Staff, Air Force Headquarters, Ottawa, and to the RCAF personnel at the C Stations at Comox. Lancaster, Cold Lake, Winnipee, North Bay, Ottawa and Goose Bay, and to the building inspectors and individuals who made B station observations.'Vithout all this willing co-operation this survey could not have been carried out.
This report was prepared by C.M. Allen, of Queen's University, a summer worker with the Building Structures Section, and B.G.W. Peter, research officer with the Section. under the direction of W.R. Schriever.
Ottawa
INTRODUCTION
.
...
..
.
.
..
.
.
....
.
.
.
...
.
..
.
.
..
.
...
..
.
.
1SURVEY PROCEDURES OF 1962-63 OBSERVATIONS • • • • • • • • • • • • e 2
A Stations
·
...
.
...
...•... .e· ...••...
2RESULTS OF THE 1962-63 OBSERVATIONS
.
.
.
.
...
.
.
.
.
.
.
...
.
..
.
...
.
....
.
.
PRESENTATION OF RESULTS
SUMMARY OF THE RESULTS
B Stations C Stations WEATHER A stations B stations C Stations GENERAL DISCUSSION
·...
.
...
.
...
.
...
.
..
.
..
.
.
...
·..
..
.
.
...
.
....
..
...
.
...
.
...
...
.
....
.
.
.
.
...
.
.
.
.
...
.
..
.
.
.
...
.
.
..
...
·
.
....
.
.
..
.
...
.
.
.
.
.
.
.
...
.
.
.
.
..
..
.
.
·.
.
..
.
.
.
...
.
.
...
.
...
.
..
.
.
.
...
·
.
.
...
.
.
.
..
.
....
.
..
.
.
.
...
.
.
.
...
.
...
..
.
.
.
.
.
.
.
.
.
.
...
.
.
..
.
.
.
.
.
.
.
...
.
...
..
.
...
.
.
.
.
.
...
.
...
.
.
3 3 3 4 5 5 8 9 9 10 Drifts on Canopies...
. ...
Large Flat Roofs Wind Sloped Roofs
....
.
...
.
...
.
.
.
.
...
..
.
.
..
.
.
.
.
...
.
...
..
.
.
...
....
.
...
.
.
.
...
.
...
.
..
.
.
.
10 11 12 12..
.
.
..
.
.
.
.
...
...
...
.
....
.
..
.
...
.
.
...
.
...
.
...
.
...
.
.
..
.
.
...
.
.
.
..
..
..
.
...
.
..
..
.
...
.
Roof to Ground Snow Load Sheltered 'Roofs
INTERIM CONCLUSIONS REFERENCES
Ratios for Exposed and
13
14
15
S1'1O"! LOADS ON ROOFS 1962-63
Seventh Progress Report by
C.M. Allen and B.G.W. Peter
This progress report is a continuation of the
survey of snow loads on roofs which was begun in 1956
by the Division 0:[' Building Research with" the aim of' improving
the design snow loads given in the National Building Code of
Canada (NBC) (1). The 1962-63 survey was carried out on
various types of roofs all across Canada. In most cases the
same roofs were used as in previous years. This report
describes the observations of snow loads for the winter of
1962-63 as well as conditions of maximum wind speed, average
daily temperature and accumulation of snowfall so as to analyze better the various factors that affect snow loads. The report also discusses trends and unusua] features of the
observations, and correlates the results with the interim conclusions of previous reports (2-8).
Snow loads should be of considerable concern to
designers. In many of the More populated areas of Canada,
the basic design snow load is in the ranGe of 40 to 60 psf.
For most ウエイオ」エオイ・ウセ therefore, the load due to the weight of
the r oor system and positive wind pressures is. much less than
the design snow load. Thus there is considerable concern as
to the value of the de sLrm snow load to be used. If' it is
too high, there will be needless extra expense and, if it is
too small, the p.robabi Ltt y of structural failure may become
excessive.
The J"ollowing is a summary of the developments
concerning design snow loads that have taken place during the
last 20 years. In the 1941 lJational Building Code. the snow
load 'was determined from
-L
=
S + Hwhere
S
=
sum of the average snowfa Tl.s in January, Pebz'uaryand セ。イ」ィ over a numher of years, and
R = sum of the average rainfall, in inches, in Janrnry,
February and Earch (9).
For many cities, including Vancouver, ''linnipeg and Halifax, the
results given ャセセイ this formula wer e inadequate.
In the 1:;53 ITBC, the minimum design load was ba sed, for
the first tine. on the snow depth on the セイッオョ、N This value of
depth of snow in the 1941-50 period together with the estimated maximum amount of rainfall that might fall into
the snow cover in 24 hours (10). A specific gravity of 0.2
was used for the snow. The minimum design load applied to
flat roofs and to roofs with slopes up to 20 deg. For roofs
with slopes greater than 20 deg the following formula was used:
=
L [} - 0.0233 (x-20I]where
L
=
minimum design load for a flat roof, andx
=
slope of the roof in degreesThus, in the 1953 Code, consideration was made for the effect
of roof slope and for the セ。エ・イ content in the snow but no
consideration 'Nas given for wind, which perhaps is "the most serious factor.
In the 1960 1ffiC allowance was made for conditions
produced by wind (1). The basic ground load was based on the
maximum snow load in a 30-year period. The design roof
snow load was taken as 80 per cent of this basic ground snow load and was reduced for various slopes of roofs starting at
30 deg. In addition, the desiGn roof snow load was increased
by 50 per cent in areas where there would likely be drifts. Even the 1960 Code, however, may be in need of improvement in
certain aspects. RooIs exposed to the wind usually have loads
much lower than the 80 per cent of the ground load used in
the 1960 Code. Thus the reason for further snow load studies
becomes apparent. By accumulating information on the behaviour of snow on roofs in comparison with the snow on the ground, further amendments to the Code are possible so as to produce more reasonable and, at the same time safer design snow loads for roofs.
SURVEY procスセduhes OJ? 1962-63 OBSEHYATIONS
The survcv procedures used at the A, Band C Stations for the 1962-63 winter season were the same as those us ed in
the previous ve a r-s (2, 11, 12). An additional "local" survey ,
(now included in the B stations) was made on a number of roofs in the Ottawa arca(This was done for the first time in the
1961-62 survey). 8ighty-eight roofs were observed.
A Stations
As in other years, detailed observations of snow depth and density on the ground and on roofs were recorded
3
-A Stations, at least one flat roof and one eable roof were
observed. Snow depth and density measurements were taken
in the same manner as in previous years.
The A Stations at Revelstoke and Fort Churchill,
Manitoba were discontinued in the 1962-63 winter. Two
additions to the A Stations were at D.E.I. National Park
and at Glacier. Forty-one roofs were observed at the
seventeen A Gセ。エゥッョウ (Table I).
B Stations
In the past, most observations at the B 'Jtations
were carried out on a カッャオョエ。セj basis by building inspectors.
For the 1962-63 winter season, there were only six reports
sent in from locations outside the Ottawa. area. As in the
previous winter, B-Station observations in the Ottawa area
were made by the staff ッヲᄋセィ・ Gセイオ」エオイ・ウ Section of the Division
of Building Research, National Research Council. These
observa"tions were made on 22 roofs, of a var-Lety of shapes
and sizes. Most of the B Stations, including roofs in the
Ottawa area, were observed only once since the observations
on the roofs of "the B セエ。エゥッョウ were to be taken only after a
very heavy snowfall or after an occurrence of structural failure due to snow load.
C Stations
The observations on large roofs at airports were carried out by RCAF personnel in the same manner as at the
A Stations. Observations were taken onca a week and after
every heavy snowfall. Because the roofs being observed were
very large, the standard snow depth gauges were not used. The buildings used were: arch hangars, mechanical equipment
6arages, cantilever hangars and unit supply depots. The roof
shapes of these buildings are shown in Figures 19 to 24
inclusive. rfuerepossible, canopies attached to these buildings
were observed. セカ・ョエケMエキッ roofs were observed at the eight
C ':;tations. WEATHER
In contrast to the 1961-62 season, normal to
below-normal snowfalls occurred west of Toronto, except at Glacier. East of Toronto, normal to above-normal sncwfalls occurred, except at Ottawa.
In general, the mean te:n pe ra trure s were below normal in Eastern Canada and ab ov e no.rmaL in 'Vestern Canada during
the winter season. January was an exception to this.
Tempera-tures were 5 to 9 deg b e Low normal on the Prairie Prov i.nc e s
Winds were normal throughout most of Canada except
for the Atlantic Provinces. j。ョオ。セイ and f・「イオ。セイ brought very
strong winds to the Atlantic Provinces. PRESENTATION OF RESULTS
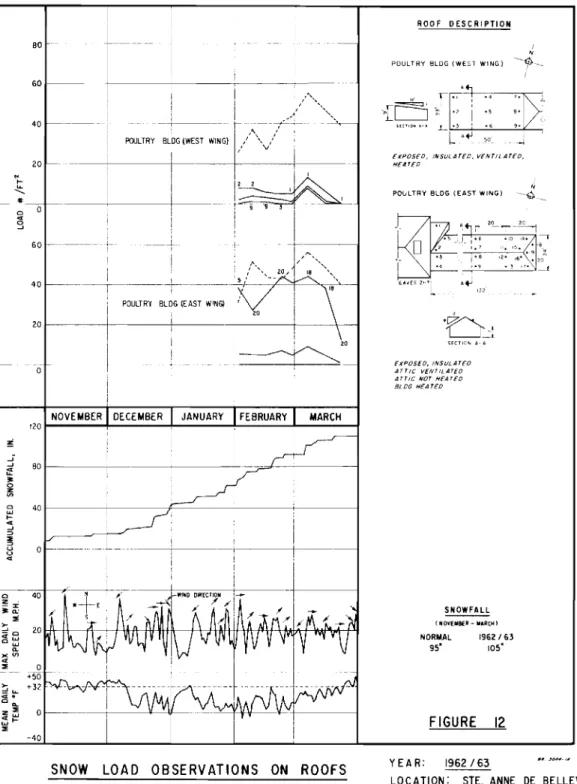
As in previous snow load progress reports, results
from A Stations arc given in detail for each roof by means of
graph on whLch the ground load, the minimum, maximum and
average roof load, and in some cases, the maximum canopy load
are plotted against time. There are also glBphs of the
accumulated fresh snowfall" in inches, the maximum daily wind speed with direction of wind, and the mean daily temperature
plotted against time. Plan and elevation views of the roof
are drawn so as to show the size and shape of the roof and the
locations of snow Gauges. These graphs are contained in
Figures 3 to 18 inclusive, and are summarized in Table I, and Figure s 1 and 2.
B-Station results are given in Tables II and IV.
Table II gives the results of the observations made by bUilding
inspectors at B Stations. Table IV gives the results of the
observations made on the roofs in エィセ Ottawa area.
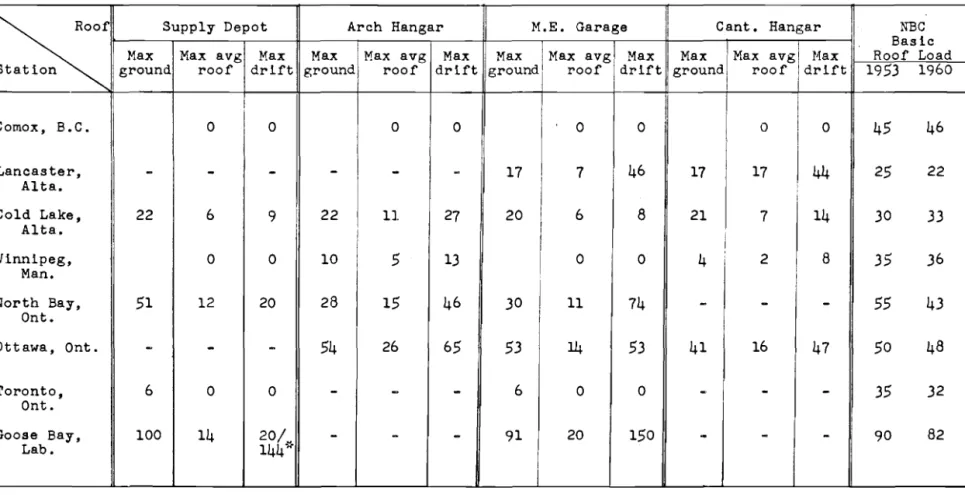
C-station results are presented in a similar manner
as the A Stations (Pigures 19 to 2 ,"r ) and are aurnrrarized in Table
III and Figure 1. Table V presents the comparison of the roof/
ground load ratio for the large [lat roofs of A and C Stations.
The Graphs showing the snow loads and weather records
for A and C セIエ。エゥッョウ (Figures 3 to 24), give both the normal
snowfall and the total snowfall within a stated period of the
winter. Values of normal snowfalls were obtained from the
Meteorological Branch of the Department of Transport. (On
previous reports the normal snowfall was taken from 1921 to
1950. j"1any stations did not have the reqUired information
for this period, however, and so the usefulness of reporting
these normal snowr'a l l s be carnc doubtful). The 1941-60 averages
'were used, therefore, as these 20-year averages were available
for most of the" stations. 1ne only exception to this was at
Cold Lake, Alberta, where the ave ra ge sn owf'aL'l from 1953 to
1962 was used as the normal snowfall.
Variations in snow loads in Ottawa due to factors such as roof shape and shelter arc shown in Figures 27 to 32.
In Fi[':ure 25, the ratio of maximum average roof
load (for exposed roofs) to the maxi.mum averaee ,c:round load
is plotted 。LセG。ゥZZQNウエ the slope of the roo:f. QQGゥセオイ・ 26 shows
the sane イ」ャ。エゥッセウィゥー 8S in FiGure 25, but for sheltered roofs
instead
0::
expo s c d roofs. セイィ」 Lntormatl on shown in }i'isures25 and 26 was taken from all proryCSS reports on A Stations
f rom +,",1C Joe"7 ,'n t I e ' ' ) ,",.; t ' """ (" セ 7 0 d g)
5
-RSi3TJLTij 05 '['HE 1962-63 OBSEl1VATIONS
For all roofs observed, the average roof load was
lower than the 1950 ITJC minimum design snow load for roofs (13). Twelve roofs bad max'i murn snow loads in exccss of the Code values.
Some of these hie-h na xi nu-n roof loads wouLd ba ve be en covered
「セイ the use of the 1960 Code " sh8pe" factors. Seven roofs or
canopies had maxf.mum loads that exceeded even the values ,'jiven
by the 1960 Code shape factors. These occurred on the mNセッ
garage and cantilever hanga r at Lanca st e r , Alberta, on エャセ・ M. E.
carase and canopy of the supply depot at Goose Bay, Labrador,
on a flat roof in Gander, "Newfoundland, and on a gable roof
and a canopy in Ottawa.
Only Ha Li.tax and Arvida reported roofs with average
roof loads [jreater than the reported [round load. These roofs
were sheltered so that the wind could not blow off the snow.
Thirteen of 25 A and C Stations reported roofs with ュ。クゥュオセ
roof loads greater than the ground loa d. As Ln other years,
drifts occurred along parapets, at the junction of split level
roofs, at extending walls, and at any other object which would act as a snow fence.
Mast of the B-Station roofs observed in the Ottawa
area were in well-sheltered locations. This resulted in a
very uniform snow load on the roofs whLch was almost equal to
the ground load. In other parts of O-ttawa, there was a great
deal of drif"ting on the roofs. Thus the prediction of snow
loading become s very di.ff'Lcu I t since snow loa ding on roofs
changes even within a city due to the various conditions of
shelter and wind.
The ヲッャャュセゥョァ presents a marc detailed discussion
of individua1 A Stations.
A Stations
V:.mcouver, B.C. - l''lc:asurcments of snow loads on
-roofs were not taken because the snowfall was very small and did not accumulate on the roofs.
セ . 1 'T ,or rn I 1 t' f
l.TIl.1VL(, 1'.• •1.. - n genera セ De average r oof sriow
loads were not high. An exposed rable roof had maximum snow
loads greater than the ground snO'7 loads, but the maximum
。カ・イ。セ・ roof snow load reported was only j8 per cent of the NBC
desiGn roof ウョセカ load.
Glacier Park, B.C. - 'i:l18 snowfall was almost 11 per
cent above norr:mi ':lith a total of- a Lnost 4UO in. of' snowJall
reported. rehis is the イゥイセSエ year t:1at ob ae rvatnons have been
made on this fLat roof' . e a r t of' the rooi' BGv。セS heated, but only
the unhea-'ced section of the roof' nas observed. From sketches
of the snow on the roof it [l.l'pc::ars that there '''!88 ver:r little
evenly distrib1rted on the unheated section of the roof
throughout the winter. The hcat ed section of the roof
accumulated very little snow. The maximum roof snow load
was 75 per cent of the lillC des ib'TI roof snow load.
''linnipep;, LI:::m.• - ';rinnipeg's snowra Ll. was about
normal. The ground load was ver"jr low and, for the most part,
the roof ャッ。、セ were less than the ground loads. In March,
however, snowdriftinp; caused a maximum roof load of 10 psf
in comparison with a Ground load of only 3 psf. This roof
load was considerably below the 35 psf roof load specified
by the 1960 Code.
kゥョセウエッョL Onto - Although the snol\ffall was almost
17 per centiabovc normal, the roof snow loads never exceeded
the NBC value :for the design roof snow load. As in previous
years, the maximum snow Load on the roof of ᄋLGᄋセ」n・ゥャャN House
exc ceded the ground snow load, at one point by nearly 180 per
cent. These maximum snow loads were the result of snowdrifting
at the parapets.
oエセ」。キ。L Ont. - Ottawa's snowfall was about 30 per
cent below normal. As in previous years,all of the roofs,
except for the flat roof of the Division of Building Research, had roof snow loads that were below the Ground load.
The maximum roof snow load on the flat roof of the DER buildinC was ["reater than the ground load throughout most
of' the wtrrt er , A',though the maximum roof load (33 paf )
exceeded the [round load by 180 per cent, it was still below
the 48 psf ape c i.fLe d by the 1960 N:3C. The maximum roof load
occurred at the parapets and was caused by high winds which
were either from the east or west. As soon as the mean daily
temperature reached the vicinity of 32°P, which was in
mid-March, the roof loads, including the maximum roof loads caused by drifts, decreased rapidly.
The well-she1tored roof at Pairhaven セGA。MZイ had a high
average roof load which was just slightly less than the ground load for most of the winter.
Ste. Anne de 3cllevue. P.Q. - As in the 1961-62
season, the sn cwf'aI l wa s about 10 per cent above normal. Unlike
the previous year, however, the rround load was very much
hieher, r'e achtng a maxi mun value of 55 psi' ( the depth of
snow セセウ
43
in..). This barely exceeds thermc
design groundsnow load of 55 psf.
The averaセ[」 roof snow load was very much be10'1"1 the
ground S110rf load, reac'1ing a hiGh of' onLv 9 psr • This was
7
-roof load reached a peak of 44 psf. This occurred on the
cast end on the hip roof
(45
deG slope) of the poultrybUildinG of Eacdonald College, i'or which the design roof
Gnaw load of the 1960 セュ」 would be 26 psf.
Montreal, P.Q. - The snowfall was almost 10 per
cent greater than normal and because the mean daily temperature
was below 32°F for most of the winter, the ground load reached
a high of
55
psf. Because of the high wihds, however, whichwere mostly in the easterly and westerly directions, the roof loads were comparatively low, the maximum roof load reaching a peak of 21 psf.
p.E I. National Park - The sn owf'aLL was 65 per cent
above normal. The reportpd maxi.raum ground. load near tVIJO of
the three roofs was below the IJTlC design Fround snow Loa d :
ncar the third roof it was 59 per cent above the NBC design
c;round sriow load. This high value appears to have been caused
by the severe snowdrifting around this particular building and should therefore be disreGarded.
One of the roofs had a drift roof load of 56 psf. This was five times larger than the average roof load and
exceeded the design roof snow load by 6 per cent. This high
roof load occurred in the lee of the gable roof whose top
was 6 ft above the flat roof observed. This maximum roof snow
load would have been covered by the NBC under the conditions
of driftinB snow at locations of shelter.
Tne exposed gable roof and the other flat roof had
very low average and maximum roof loads.
Halifax z N.S. - The snrylfall in Halifax was about
normal. There was very little accumulation of snow, however,
as the mean daily temperature was very close to 32°F throughout
the winter. In spite of this, the maximum roof snow loads
were very often greater than the average ground snow loads .because of the very high winds which caused considerable
drifting.
(ioose nay, Nfld. - Although the sn owfa TI 'N8S only
15 per cenG"oove normal, the reported maximum ground snow load was 175 psf which wa s "/1 per cent above the design ground
snow load of the NBC and therefore seems unusual. The density
of the snow was reported to be inthe 0.60 to 0.70 gm/cc range. These very hiGh densities could be attributed partly to mild
weathe r . Several time s during December, ,January and Tilarch,
and durins most of April, the mean daily temperature was higher
than 32°J:il. This would cause considerable melting of the sn ow
and hence high snow densities. The reported snow depths were also unusually hieh, perhaps as a result of the severe drifting
hifh ground loads do not appear to represent the average ground
snow load for the Goose Bay area. It was therefore decided
to use the ground load of the C Station at Goose Bay for the purpose of this report.
The roof loads were very low considering the amount of snow on the [round, reaching a maximum of only 15 psi'. This was the result of the high winds which appear to be common in the Goose Day area and the exposure of. the roofs used for the observations.
Gander, Nfld. - Although the snowf'aLl. was about 68
per cent above normal, the Ground snow load did not exceed
35
psf' , Surprisingly this is about half the -vaLue obtained in
the previous year when the snowfall was only 50 per cent above
normal. It must be assumed that the ground snow load was
reduced by frequent thaws. As in previous years, the roof
loads were very 10VI, the ITlaximum roof snow load being only 11
psi. The roof snow load remained low due to tDe very high
winds which reached maximum values over 50 mph several times in Janua ry.
Other A Stations - Ho unusual characteristics were observed at the other A Stations not mentioned above (Edmonton,
Saskatoon, Arvida, セセゥ。エ・イャッッ and Toronto).
D Stations
セセィ・イ」 were v ex-; few reports from building inspectors
conc e rrn.ne unusual roof snow loads. Of the three. roofs which
had appreciable snow loads, two had avc ra ge roof snow loads
less than the ground load blrt the third had an average roof
snOVI load 30 per cent greater than the ground load. -'There
vverealso large drifts in the lee of a, wall of another building.
Strong wt.nds appeared to have been the rna jor influence.
Interesting results were obtained from the roofs
observed in the Ottawa area. iGNセッウエ of the roofs cbs erved
during the winter of 1961-62 were house roofs in well-sheltered locations and many had average roof loads almost equal to the
ground loads. This contrasted Greatly with the obs ervations
made in the previous year in en adjacent housing development, in which most of the roofs were exposed and severe drifting
was common. On one she 1tered roof", a maximum roof snow load
of 105 psf 17/8S reported. This occurred on the cave of the
roof wher e ice had a c cumuLa't c d , ':11Cre .rocrs were more exposed,
the averaze roof snow load was fa! below the cround ウセッキ load.
On the roof of a larGe sinzlc-storcy inoustrial
building, large drifts accumulated at ッ「ウエイオ・エゥッセウ on the roof
while the expbscd parts of the roof were swept clear of the
9
-the basic design load by 8 per cent. On the same building.
a canopy had a maximum load of 117 psf 1'Ihich is 63 per cent h i.ghc r than the value allowed in thelTBC ior canopies in the Otrtawa area.
C Stations
Otta'Na. Ont. - The ave ra ge roof snow loads of all three roofs were below the ground load. but on two of the roofs, the maximum roof snow loads were Greater than the NBC
desi8u roof snow load of 48 psf. The arch hanEar had a
maximum roof snow load of 65 psi' and the mechanical equipment
ga ra gc bad a maximum roof snow load of 53 psf , Neither of
these loads exceed the セュ」 design snow load for drifting.
Goose Bay, Lab. - The C Station reported
approxi-mately the same dep
ch
of' snow as the A Station but the dens i tymeasurements were in the range of 0.20 to 0.40 Gm/cc. tィセ
resulted in a maximum ground snow load of 100 psf.
The roof of the supply depot had 10'J'l snow loads. The snow load on the canopy, however, was 144 psi which is
17 per cent higher than the design snow load of 123 PSI
specified in the National Duilding Code for a canopy in Goose
Bay. In a similar セ。ョョ・イL drifting on the mechanical
equip-ment garage produced a maximum roof snow load of 150 psf viliich is 22 per cent greater than the NBC design snow loa d allowed for driftiu,::-.
Other 0 Stations - The average roof snow loads of
the other C Stations (Lancaster, Cold Lake, '1innipcg, and
North b。セjI were below the ground snow loads. As in previous
years, drifting occurred where there was local shelter on
the roof. The roofs at Comox, B.C. and Toronto, Onto had no
snow throughout the winter.
sュゥャャヲセry OF セサe RESULTS OF 1962-63 OBSERVATIONS
In general the results ッセ the 19G2-63 observations
tended to confirm the interim conclusions of the previous
reports. They showed that the snow load on a roof was a
variable quantity which depended greatly on location, wind speed and wind direction, temperature, 8nd the shape and size
of the roof itself. T'Ilere was also further evidence to
indicate that it might be advisable to revise the shape
factors for roof slopes and drifts given セョ the QセcN
More than half the stations observed had above-normal
snowfalls. Of these, P.E.I. National Park (A Station), Gander
(:3 Station), and Lancaster, North Bay and Goose Bay (C Stations),
Even in ottawa, which had 「・ャッキMョッイセ。ャ ウョッセヲ。ャャL some of the B-3tation and C-Station roofs had drift loads exceeding the
1960 NnC design. va Lue s ,
The observed average roof loads ranged from 0 to
89 psf. The 89-psf load occurred at Glacier Park on a
sheltered roof. 'I'he maximum drift load obs erved was 150 psf
in Goose Bay, 8casured adjacent to a wall where the wind had
piled up the snow into a large drift. GENERAIJ DISCUS SION
The observations of the 1962-63 survey have
substantiated most of the interim conclusions of previous
reports. Together with earlier observations they provide
an increasing amount of evidence that certain revisions of
the NBC design snow loads are desirable. The 1962-63
obser-vations have also coruLrme'd that, although the Imowledge in
this field has improved greatly over the last few years, an
exact prediction of snow loads is not possible: Statistical
approaches together with enr,ineerine judgment are required as a means of establishing the best possible estimate of the design snow loads. Some dii'ficulties in a statistical approach arise, however, in that the survey to date has only been carried out for seven years on a relatively small number of roofs.
In addition, there are many factors affecting snov loads which can only be assessed by engineering judgment.
Precipitation, temperature and heat loss are obvious in their effect on roof snow loads and will not be discussed
here as they are clearly explained in references 3, 5 and 8.
Further comments on other factors affecting snow loads on roofs are presented in the follOWing paragraphs.
Wind
In previous reports it has been stated that wind
is the major factor affecting snow loads on roofs (9). Wind
conditions are, to some extent, related to geographical locations as shown by the two extreme examples of Glacier
and Fort Churchill. At Glacier, large balls of snow accumulate
on top of coniferous trees because of the lack of winter winds, whereas at Por-t Churchill, at the other end of the scale,
drifting conditions are extreme and almost continuous. Such
effects of geographic locations arc, however, limited to only
a few areas of CDnada. In the majority of the populated areas
of Canada, on the other hand, winter winds wi.Ll, be intermediate
in strength and intermittent. This will make their effect more
difficult to predict. Furthermore, roofs wi.LL hav e various
degrees of' shelter depencling on the surroundings and hence the
11
-example of this is found in Ottawa, where in any given winter some roofs will have very evenly distributed snow loads and others will have no snow at all or heavy drift
loads only. This further illustrates that it is very
difficult to make an exact prediction of roof snow loads due to the variations in exposure to the wind even in one
880graphic location. sセ。エゥウエゥ」ウ and engineering judgment
must be combined to determine the design snow loads for a
given area and a given roof. This inevitably results in the
desiEn snow loads of many roofs being greater than the actual snow loads since the maximum roof snow load in a 30-year
period, on which the d e s Lgn roof snow load is based, wi.Ll, occur on a limited number of roofs.
Sloped Roofs
There are two thoughts to be presented concerning
sloped roofs. The first c'oncerns the d epos it ion of snow on
sloped roofs compared with that on flat roofs and the second concerns the slope of the roof at which snow will begin to slide off.
Under normal exposed conditions, frequently more
snow collects on sloped roofs than on flat roofs. Theoretically,
with 100 per cent shelter, sloped roof's should collect the
same amount of snow as flat roofs. In exposed locations,
howeve r , there is evidence that Gabled or peaked roofs actually
have hiEher average snow loads than flat roofs. Examples of
this occurred durin8 the 1962-63 winter. The poultry building
at ste. Anne de Bellevue has a flat roof and a gable roof with
slopes of 45 and 34 deg respectively. In 1963, the heaviest
loads occurred on the 45 deg slope and reached a maximum of
44 psf as mentioned earlier in this report. In Gander, during
1963, even wi,th the flat roof unheated and insulated, both the
ave ra ge and maximum roof loads "rere higher on the gable roof. The accumulation of snow on a sloped roof and the formation of an unbalanced snow load on a peaked roof was
confirmed from observations given in a Russian paper concerning
the prevention of drifts on roofs (14). Buildings, by their
nature alone, are obstructions which cause turbulence in the air f'Low which in turn causes a reduction in vlind velocity
behind the obst ruct Lon , 'here there is a reduction in wind
ve l.ocftv , some of the wind-blo''\'ll snow will be deposited. Since
the wake from a peaked roof occurs over the roof whereas the wake from a flat roof occurs mainly over the fround, a peaked
roof will accumulate more wind-blmvn snow during a snowst orm,
Furthermore, a pe ake d roof wi L]. accumulate on one side some
snow bLown from the other side. 1':'1.e 1950 lr3C has provided for
an unbalanced load on peaked roofs. But it is not, as yet,
recognized in the Code that sloped roofs ma v on the whoLe have higher averaGe snow loads than flat roofs.
12
-In most codes reductions are allowed in the design
snow load fo'r sloped roofs. This is presumably based on the
thought that snow loads will be more easily reduced on sloped roofs since the water from melted snow can easily run off and
that, in addition to this, the snow can slide off. In the
1960 National Building Code, reduction of design snow loads
begins with a slope of 30 deg. It now appears that this
reduction is very crude and, in some cases, incorrect. The
roofs of well-constructed modern homes have well insulated ceilings and well ventilated attic spaces and, as a result,
very little melting ッ」」オイウセ In addition, the sliding of snow
off the roofs depends a great deal on the roofing material. Although metal roofs will usually shed much of their snow at
quite low slopes shingled roofs viith slopes up to more than
15 clef, will frequently keep their load (Figure 29). The
heavy drift on the 45 deg slope of roof at Ste.Anne de Bellevue did not slide off the roof.
It appears therefore that under ordiDarJ exposed conditions there will not be less snow on gabled roofs than on flat roofs, unless the roof' slope is greater than about 45 deg or unless the roofing material facilitates the sliding of
snor'off'the roof. Large Flat Hoofs
In previous reports (7, 8, 9), results of observations of snow loads on large flat roofs on industrial and public
buildings have been reported. It was observed that the roof
loads were always considerably smaller than the ground loads and that perhaps, by nature of their size alone. laree flat roofs would always be exposed to the wind, resulting in low
average roof loads. In 1963, 24 out of 25 roofs had roof to
ground load ratios below 0.51; the ave rar;e ratio of the 25
roofs was 0.32. All the roofs observed had areas greater
than 5000 sq ft. Some of the roofs ッ「ウ・セイ・、 had parapets
which produced hiGh loads at the edge of the bnilding but did not affect the average load a great deal since the area
affected by the parapet is srna11 compared with the area of
the large roof. It appears then. that there mipht be a
reduc-tion factor for large flat roofs when the design roof snow
load is being determined. Drifts on Canopies
In the 1960 NBC provision was made for drifting on
canopies (and on other roofs in the lee of hifher roofs). In
de s LcnLng canopies, the design roof snow' load is to be increased
by 50 per cent. There is some evid ence t"Cat this factor is
13
-0.80 of the maximum ground load b;r 80 per cent. In Ottawa,
where the snowfall was 20 per cent ccLow normal, the average
snow load on the canopy of one building exceeded 0.80 of the
maximum cround load by 203 per cent. noreover, quite a few
canopy failures have been reported in the past.
Drift loads on flat roof's in the lee of a higher roof have also exceeded the design values for drifting in the
NBC. This occurred in G3nder and Goose Day in 1963. There
was also a report of a recent roof failure in Morrt.reaL due
to this type of' Loadi ng , A drift load o:r appr-oxirna t e'l y 250 psf
(525 per cent of 0.80 of the maximum ground load) occurred in
the Lee of the main roof of the buildin{( which was 12 ft higher
than the roof tihat tailed. lihis main roof hael a very large
area which extended for a length of 300 ft. It appears that
the size of the contributing area as Nell as the height of
the vertical obstruction ャセカ・ some bearing on the amount of
the snow drift.
It is apparent then that further studies of drifts on roofs and canopies are required so that a reasonable
re vi s ion of the lTBC on sriow loads can be nad e .
Roof to rrround Snow Load Patios for Exposed and
P,heltered ャセッッゥGウ
T'i[;ure s 25 and 26 show the roof to F::round snow load ratios for exposed and sheltered roofs for the period from
1S157 to 6j. l'Tearl? all the exposed roofs had ratios below 0.70.
Those above 0.70 occurred in areas of Low snow loads. Thus
it appears that -'che present value of O.GO 1J3ed by the 1960
NBC in d et e rml.nLng the design roof sn ow load is rather hie;h
for exposed .roofs , A More suitable value wonLd be in the
l'anse of 0.60 to 0.70. In contrast to エセゥウL accordinE to
Fi[ure 26, a ウゥ{セョゥゥGゥ」。ョエ percentage (20 per cent) of' the
sheltered roof's had ratios of roof to ground snow load above
0.80. This represents a large number of roofs and cannot be
ignored.
It appears then, that there should be separate design
snow loads for exposed roofs and sheltered roofs. Some difficulty
arises, however, in determining whet.he r a roof is exposed or
not. It can be said, honeve r , that a hLch decree of over-all
shelter, such as that pr-od uo ed by a wooded area all around a
house, is reguirecl to produce roof to ['round load ratios of
over 0.80. In any case, careful consideration of this question
is required before decic:.inr whLch of the roofs or conditions
justifies a cnanre in the roof to ground snow load ratio aI'
14
-IUTERH1 CONCLUSIOnS
The 1952-6) observations have substantiated most
of the interim conclusions of previous reports. These
conclu-sions can be repeated here as follows:
1. The average snow loads on roofs are less than the
load on the surrounding ground.
2. The amount by which the snow load on the roof and
the load on the ground differ depends primarily on the degree to which the roof is sheltered. (The
effects of shelter are, havever, extremely difficult to predict exactly.)
3. Concentrations (drifts), which f re querrtLy exceed
the load on the ground, are to be expected in any roof area of localized shelter, the magnitude of
the load being dependent on, among ッセィ・イ things,
snowfall, the size of the roof area which is 'contributary", and the height of the localized
shelter.
4. Because of the complexity and variability of factors
affecting snow loads a statistical approach for
determining the design roof snow Toad becomes
neces-sary.
As a result of further analysis of the other reports
and the 1952-6) observations, further conclustons can be made:
5.
The present requirements for reduction of designsnow loads with ゥョ」イ」。ウゥョセ slope of the roof,· are
not consistent with observed conditions. The slope
of the roof at which the snow will slide off will vary 8reatl:{ with the roofing material and the extent
of insulation of the roof. Also it is possible for
gable roofs to accumulate more snow than a flat roof because of the effects of the wake which occurs over one of the slopes.
6. Drifts on canopies and at vertical projections on
roofs, often exceed the factor of 50 per cent used
in the 1960 liBC design snow loads to provide for
drifting.
7.
There might be a reduction factor in the designroof snow loads for large flat roofs.
8. If a satisfactory distinction can be made between
exposed and sheltered roofe, it appears that the present roof to ground snow load ratio of 0.80
used in the EnC could be Lcwe r-ed ior expos ed roofs,
F
15
-REFErtENCES
1. National BuildinG Code of Canada 1960. National Research
Council, Associate Committee on the National Building Code, Ottawa.
2. Allen, TI.E. Snow loads on roofs, 1956-57 - A progress
report. National Research Council, Division of BUilding
"Research, Interna 1 Pepor-t No. QSTᄋセ Janua ry 1958. 7 p ,
3. Allen, D.E. and C.,I. セオイォウエイ。N SnOI'lJ' loads on roofs.
1957-58 - Second progress report. National Research Council, TIivision of BUilding Research, Internal
Report No. 163, November 1958. 6 p.
4. Thorburn, ILJ. and B.G.W. Pet er , Snow loads on roofs,
1958-59 - Third progress report. National Research Council, TIivision of Building Research, Interna 1
Report No. 184, November 1959. 16 p.
5. Peter, B.G.1Y. and H.J. ThorbuTI1. Snow load observations
at B Stations, 1958-59. National Research Council,
Division of DuildinE, Research, Internal Report No.
189, December 1959. 13 p.
6. Watt, '·'.E. and H.J. Thorburn. mow loads on roof's,
1959-60 - Fourth progress report. Hational Research Council,
Division of Duilding Research, Internal Report No. 204, November 1960. 10 p.
1. Scott, J.P. and B.G.W.Peter. Snow loads on roofs,
1960-61 - Fifth progress report. National Research Council,
Division of Building Research, Internal Report No. 228, November 1961. 14 p.
8. Hebert, P.A. and bNgNセN Peter. Snow loads on roofs,
1961-62 - Sixth progress report. National Research
Council, Division of Building Research, Internal Report No. 260, -Iariua.rv 1963. 11 p ,
9. Thomas, f\'I. K. and D.BセiN Boyd. Computed maximum snow loads.
National Research Council, Division of Building Research, Building Note No. 34, February 1958. 5 p.
10. Thomas, T,T. K. A method of computing maximum snow loads.
Engineering Journal, Vol. 38, No.2, February 1955. p 120-123.
16
-11. Allen, D E. Field instructions for observers at
A Stations of snew loads on roofs. National
Research Council, Division of BUilding Research, Technical Note No. 233, October 1957. 11 p.
12. Allen, D.E. Snow loads on roofs. The present
requirements and a proposal for a survey of snow
loads on roofs. National Research Council,
Division of Building Research, Internal Report No. 106, September 1956. 19 p.
13. Climatic information for building desiGn in Canada
1961. Supplement No. 1 to the National Building
Code of Canada, 1960. National Research Council,
Associate Committee on the National BUilding Code, Ottawa. NRO 6483.
14. Bessonov, V.S. A method of preventing the accumulation
of heavy drifts on roofs of industrial.buildings. Promyshlennoe Stroitel'stvo, No.9, 1962, p. 20-24 translated by W.A. Dalgliesh.
a
TABLE I
SNOvl LOADS FOR A STATIONS 1962-63
NBC Max Max Avg Max
Statlon Roof Roof (pa r ) Ground Roof Observed
/53 /60 (ps r ) ( ps r ) Roof (psI') Inuvlk, N.W.T. Gable: Not heated, sheltered from sroth 30 37
-
4 4Gable: Heated, lnsulated, exposed 30 37 25 14 30
Flat: Heated, lnsulated, exposed 35 37 18 6 9
Vancouver, B.C. 30 27 Practlcally no snow
Glacler, B.C. Flat: Exposed. unheated, no lnsulatlon - 129 119 89 97
Edmonton, Alta. Gable: Unheated, sheltered 25 22 7 4 6
Flat: Heated, lnsulated, exposed 25 22 7 2 6
Saska toon, Sask. Gable: Heated, lnsulated, exposed 33 28 15 1 4
Gable: Heated, lnsulated, exposed 35 28 22 1 5
Flat: Heated, lnsulated, exposed 35 28 11 3 7
Flat: Heated, lnsulated, exposed 35 28 18 3 7
Flat: Heated, lnsulated, exposed 35 28 10 1 2
Wlnnlpeg, Man. Gable: Heated, lnsulated, sheltered 32 36 3 1 10
Flat: Heated, lnsulated, exposed 35 36 3 2 4
Waterloo, Onto Gable: Heated, lnsulated, exposed
-
48 19 1 4Flat: Heated, lnsulated, exposed
-
48 21 2 6Flat: Heated, lnsulated, shattered
-
48 21 5 14Toronto, Onto Gable: Insulated, sheltered 24 26 9 2 2
Flat: Heated, lnsulated, sheltered 35 32 6 5 8
Klngston, Onto Gable: Heated, lnsulated, sheltered 47 40 29 14 21
Flat: Heated, lnsulated, exposed 55 40 16 13 31 2'6" pa.rapet
Ottawa, Onto Gable: Heated, lnsulated, exposed 42 48 28 6 16
Gable: Heated, lnsulated, exposed 42 48 28 6 15
Gable: Heated, lnsulated, exposed 50 48 28 11 16
Flat: Heated, lnsulated, exposed 50 48 28 20 32
Flat: Heated, lnsulated, exposed 50 48 38 15 23
Flat: Heated. lnsulated, exposed 50 48 36 26 37
Ste. Anne de Gable: 8/12 heated, lnsulated,exposed 34 35 56 9
Bellevue P.Q. : 8/8 heated, lnsulated, exposed 21 26 44
Flat: Heated, lnsulated, exposed 50 44 55 9 13
Montreal, P.Q. Gable: Heated, lnsulated, exposed 42 43 55 8 21
Flat: Heated, lnsulated, exposed 50 43 49 9 11
Arvlda, P.Q. Flat: Heated, lnsulated, exposed 55 60 23 3 9
I
P.E.I. Natlonal Gable: Heated, lnsulated, exposed 56 53 20 2 5
Park Flat: Unheated, lnsulated, sheltered 60 53 105 8 11 from east and west
Flat: Heated, lnsulated, sheltered 60 53 44 11 56 from east
Hallfax, N.S. Gable: Heated, not lnsulated, shelmred 34 36 7 4 6
Flat: Heated, lnsulated, exposed 40 36 5 5
ゥセ
Flat: Heated, lnsulated, sheltered 40 36 4 13
Gander, Nfld. Gable: Hented, lnsulated, exposed 38 50 35 7 11
Fla.t: Unheated. lnsulated, exposed 45 50 34 4 5
Goose Bay, Lab. Gable: Heated, lnsulated, exposed 78 82 100 10 15
Type Heated. Not Major Influences Loads in psf
Location of and Heated Strong Heat !-lUd NBC Avg. Roof Remarks Roof Insulated Winds Loss Weather roof Ground roof rifts
/5) /60
Fort St. John,
Hii X
-
42 19 17 )8 Snow driftsB.C. 4 12 behind) ft high
false front
Lloydminster,
-
25 No unusual loads ISask-Alta.
I
I
Rosser, Winnipeg X No unusual loads
Man.
Arvida. P.Q. Flat X X 55 60 10 I) )8 Snow drifts in
lee of' building 9' taller than
Dorval. P.Q. X No unusual loads roof observed
Gander. Nf'ld. Flat X X 45 50 27 6 112 Large drifts on
roof' in lee of'
snセセ LOADS FOR C STATIONS 1962-63 (in psf)
セ
Supply Depot Arch Hangar M.E. Garage Cant. Hangar NBCMax Max avgi Max
Basic Max Max avg Max Max Max avg Max Max Max avg Max Roof Load Station ground roof drift ground roof drift ground roof drift ground roof Idrift 1953 1960
I
I
Comox, B.C. 0 0 0 0 0 0 0 0 45 46 Lancaster,-
-
-
-
-
-
17 7 46 17 17 44 25 22 Alta. Cold Lake, 22 6 9 I 22 11 27 20 6 8 21 7 14 30 33 Alta. I i Winnipeg, 0 0 10 5 13 0 0 4 2 8 35 36 Man. I North Bay, 51 12 20 28 15 46 30 11 74-
-
-
55 43 Onto Ottawa, Onto-
-
-
54 26 65 53 14 53 41 16 47 50 48 Toronto, 6 0 0-
-
-
6 0 0-
-
-
35 32 Onto Goose Bay, 100 14 20/w-
-
-
91 20 150-
-
-
90 82 Lab. 144"" NOTE: TABLE III- indicates roof not available.
Type Heated Loads in psf
Location of and NBC Avg. Roof Remarks
Roof Insulated
OセrッOヲ Ground Roof Drifts
53 60 14 Kaymar Flat X 50 48 27 26 30 17 Kaymar Flat 50 48 27 22 27 17 Kaymar Gable X 50 48 27 20 23 3:12 18 Kaymar Gable X 50 48 27 20 23 3:12 9 Kindlecourt Gable X 50 48 27 25 31 3:12
15 Kindle cour t Gable 50 48 27 10 105 Ice accumulated
3:12 along eave.
15 Kindlecourt Flat 50 48 27 25 27
53 Oriole Dr. Flat 50 48 27 27 28
53 Oriole Dr. Gable X 50 48 27 22 31 3:12
45 Oriole Dr. Gable X I 21 29 27 8 16 Unbalanced load
12:12 (16 psf on one ウャッーセ
o on the other slopcl
1 Fairhaven Way Flat Part 50 48 35 25 31
Heated
1 Fairhaven Way Flat X 50 48 35 19 25
Davidson Cres. Flat X 50 48 27 15 20 12 Briarcliffe Flat X 50 48 27 18 24
37 Delong Hip X 47 48 27 27 44 Load on one end of
5:12 hip roof
Taunton Place Flat 50 48 35 26 35
Taunton Place Gable X 42 48 35 28 38 6:12
9 Leroy Gable X 34 38 29 1 5 Drifts on leeward
8:12 slope
23 Appleford Gable X 47 48 29 2 7
5:12
31 Appleford Gable X 30 38 29 2 14 Drifts on leeward
9:12 slope
Shoppers City Flat X 50 48 17,c 9 52
Blair Road 36 . 5 44
36,H} 88 117
M-20 NRC Pro;x;rty Flat X 50 48 22 17 43 Roof sheltered by
セエイ・。ャ Road higher roof
TABLE V
SNOW LOADS ON LARGE FLAT ROOFS
Average Ground Root' Load
x 100 Location Roof Roof Load Load Ground Load
(psf) (psf) HセI
Inuvik, N.W.T. Post Office 6 18 33
Comox, B.C. Arch Hangar 0 0
-M.E. Garage 0 0
-Cant. Hangar 0 0
-Lancaster, Alta. M.E. Garage 7 17 41
Cant. Hangar 17 17 100
Cold Lake, Alta. U.S. Depot 6 22 27
Arch Hangar 11 22 50
M.E. Garage 6 20 30
Cant. Hangar 7 21 33
Saskatoon, Sa s k , Gymnasium 3 11 27
Winnipeg, Man. Library 2 3 67
U.S. Depot 0
-
0Arch Hangar 5 10 50
M.E. Garage 0
-
0Cant. Hangar 2 4 50
Waterloo, Onto Main Eng. Bldg. 2 21 10
Eng. Building 5 21 24
North Bay, Onto U.S. Depot 12 51 24
Arch Hangar 15 28 54
M.E. Garage 11 30 37
Toronto, Onto U.S. Depot 0 6 0
M.E. Garage 0 6 0
Ottawa, Onto Arch Hangar 26 54 48
H.E. Garage 14 53 26
Cant. Hangar 16 41 39
Arvida, P.Q. Rolling Mill 3 23 13
Goose Bay, Nfld. D-26 14 100 14
U.S. Depot 14 100 14
M.E. Garage 20 91 22
• .r."'DO-l-/ No A STATIONS I INUVIK 2 GLACIER PARK 3 EDMONTON 4 SASKATOON 5 WINNIPEG 6 WATERLOO 7 TORONTO 8 KINGSTON 9 OTTAWA
10 STE. ANNE DE BELLEVUE
II MONTREAL
12 ARVIDA
13 RE.I. NATIONAL PARK
14 HALIFAX 15 GANDER 16 GOOSE BAY No C STATIONS 17 LANCASTER 18 COLO LAKE 19 WINNIPEG 20 NORTH BAY 21 OTTAWA 22 TORONTO 23 GOOSE BAY
D
Q セ '. L. ("
ZェセMイZLfGセ
__ jltJE '\
-.セセセiセ[N
((1
セセセ
j
ゥ セ
Zャ
.
«.»
-A セ VjセセャH
.,
<.
/ .--.r--.--. / GROUNO LOAO ( I/AXI FIGURE IA
a
C STATION LOCATIONS AND THEIR AVERAGE ROOFa
GROUND LOADS,( MAXIMA OBSERVED 1962-63)40
1
35 30 25 20 15 10 5 セ I Iセャ セゥ
\ f/
1
_, I 4-A LOAD IN LB/ SQ FT ( 1962-19631 AVG ROOF LOAO (I/AXI / 'セ
///)[
/ ' I-A / / /"-LOAD IN LBI FT2 co o en o WATERLOO WINNIPEG TORONTO KINGSTON INUVIK SASKATOON GLACIER OTTAWA STE. ANNE DE BELLEVUE EDMONTON i:--:-:---:::-::::::r--J _ : I -J MONTREAL
ゥセZZZZゥ
I ARViDAj
I'I
,'I
-, . Mセ - ---1 Z[セセ NATIONAL _, '--r---r---HALIFAXセQ
GANDERr:]
I
GOOSE BAY
ii\
I
I
I'
I I I I I I I » セ en セ » セ o z en 3: » X 3: c: 3: N ...., C> c: ::0 fT1
5
» o (J) CD m N I m (Jo.I セ-
セ セMAXIMUM}
AVERAGE LOAD ON
MAIN ROOF MINIMUM
TIME (DAYS)
-ROOF DESCRIPTION
r--"'---
-1 'e6 4. lr
FEDERAL BUILDING (EXPOSED,heatセdN INSULATED) '1../ -> \ h'"r
__
MGᆪlセ⦅セ I :: ::::11
.,
.,
,.1---1
·5 MセZ セO1'\·'
11 ,. "7 ,. 103
1 C-10 Gセ • 8 ,.
_ __J I..
18' J APRIL---
---MARCH II -t-MMセMMMMMMMM]]]セ , 7 7 ! iセセMMMM j i I , ...---....----_...---...,."" - ",,/ I -_,_L , -+ - j +-- +-- + --j E-3 RESIDENCEGROUND VALUES NOT AVAILABLE
UNIFORlII COVERAGE
----l
OCTOBER NOVEMBER DECEMBER JANUARY FEBRUARY
o 20 60 o 60 40 --MAXIMA AT .. 2 MINIWA AT . , 20 --40セMML FEOERAL BUILDING o -e 5 20f - - '
T
セ⦅⦅⦅__
-o セ __セMMM (Q 9 10 - 9 エMMMセ::
I
If-
-+I -+- - t -+ ---jBセL LBセBB セBBMMMMMiMMMMMKMMMMMOMMMMMMMM
---HOME ECONOMICS ANNEX E - 3 RESIDENCE
IEXPOSEO, HEATED INSULATEDセNI
1 I I, -' -' セ セ 80 セ セ >-セ 40 ---MMMMMャMMMMMMKMMMM⦅⦅ゥ⦅MMMセNNlMB]]]ェ⦅]]セMMM⦅⦅ゥ⦅MMM⦅⦅⦅i :Oi => u セ o
(SHELTERED FROM SOUTH, LOW HEAT)
(NOvEMBER-APRILI TPセセャ]e 2 0 - - s NORMAL 1962 I 63 57" o +50 >- +32 -=! ... "'. 0,,-z:Oi "'... ... >-:Oi FIGURE 3 -40
SNOW LOAD OBSERVATIONS ON ROOFS YEAR: 1962/63
d/;
セ
セ
BOI
-VR
iセ
イ|セ
N....セ
$- i ..."'''' 5 5 , 60iMMMMiMMセM ---. I セ 0 I . y\\
-e I s I Ij---
I 40 --セ
\
, 20 _. 0OClOBER NOVEMBER DECEMBER JANUARY FEBRUARY MARCH APRIL
i I セ>25'-0" - - - " " . 1 - 140' O· !
I
I-'I
I I I ,. ,.,.,
セMMイ
GENERATOR 'oi 400 ---.--._. - ---.. ROO/ll , '" ,. z- ,;,1.r:""
HEATEO : .,/
7...
,. -.l 360- - - _ .__.. -Mセ セMM セ VEHICLE STORAGEJ
NOT SHELTERED, NOT HEATED,1 320
iセ
;!; .: I .----J , .. セ '" 280 . _-11
•
0 セ '" 240 '" .... if I '" , --J =:> I 2 § 200 f--'" !I
160 Iiセゥ
i 120セ
.-80WINO SPEED NOT AVAILABLE
セ 40 --- _..⦅セセMM - - - (NOVEMBER· APRIL) NORMAL 1962/63 351· 395" MMセ f - - -
MMMKセ⦅NM
.32 ---MMMMMMMMMᄋエセ nMaセMMII'"
'Y'W ..1'>.1'..セM 0 --_. -V v FIGURE 4 -40SNOW LOAD OBSERVATIONS ON ROOFS YEAR: 1962/63
40iMMMMMセ⦅KMMN ---+---1----+---/ セstration BLDG. IIIIAQII, AT ". 20ャMMMMMMKMMセセMMM p"'- MMセ --.•----._--. o ROOF DESCRIPTION AOM."ISTRATlO.. BLDG. イセMMセ
11'
' 4j
; -2 _5 fl_ ...
I MセセiMMMセセKMセセMKMセMMKMMセセ⦅⦅エ セ セ • 6 0 1 - - - l - - - , 1 - - - - + - - - T - - - _ _ _ j 40lMMMセMMMMMャMMMMMKMMMMKMMMMゥMINING STORE SHED 20イMMMMセセMMMMQMMMMMK⦅⦅MMMKMMM⦅KMMM⦅⦅⦅ェ EXI'OS£D HEATED INS/ILATED '-l)A -l
4'2-Hdセ
SECTION • A-A-• セャ[NN /-""""_.-_t ••• __• oMMMMエセNGヲMMMMMMMMMMKMMMKMMMMMMMMMMMゥ
INOVEMBER DECEMBER JANUARY FEBRUARY MARCH 120
:I 9'JlMMMMセMKMMMMMMM⦅⦅ャMMMMK⦅MMMKMMM⦅⦅⦅ェ
セ
..
oセ
MINING STORE
.
SHED4>
セLセ
L.J3
( SHeLTERED,IJNHCATED 8L OG)
o ... セ.... :::> '"' :::> u u C( 0"=======1=--'===,---+---- - 1 - - - + - - - \ -40
SNOW LOAD OBSERVATIONS ON ROOFS
t,.OVEIII8ER - .... RCHI
NORMAL 1962/63
39' 40'
FIGURE 5
YEAR: 1962163
o
(EXPOSED. HEATED, INSULATED)
I
314 LAKE CRES. 314 LAKE CRESCENT
(EXP.OSED, HEATED, INSULATEO)·
\ セNエM
FE
. , · s...
IセBBZ[i
L-J.!lI:: ::
--.1 ,.' ----l " I I II I i I OUTDOORセst
STATIONI
i o o '"o ...J120 NOVEMBER DECEMBER JANUARY FEBRUARY MARCH
60 o I---+---j---I + _ _ _ 40 -
MMャMセGMKMMセMiセ
o セ...J ::> ::IE ::> u u '" SNOWFALL NORIIAL 1962/63 26" 31" FIGURE 6(0) (OECEIII8EA - MUCHI ITfI)OtAECTlOIlI I I IIIr.
>I) セ .r 40.+,
s -40 -- +sgf---+----+----+----t---::fi1 +32 -- - - ----SNOW LOAD OBSERVATIONS ON ROOFS YEAR: 1962/63
I ..j [セ I I .- セi-!
..
セ \ OESCRIPTION ROOF , ; lセ <c.> 111'--
.. -ae: I" "..
., .s ., ., GYMNASIUM DETAIL A(EXPOSED, HEATED, INSULATED) I _-o I 60エMMMMMセイ⦅M MMセMMM I 20iMMMMMセNMMMM⦅⦅⦅KMMMM⦅KMMMMK⦅⦅MMM⦅⦅⦅i 0
..
....... <,•
80 セ .. _--I I 0 I I セ 1 : 60 I I : 40 I I GVMNASIUM i MAXIMA AT:;-5 I MINIMA AT #1,2,9 20 I ! ,"セM ...セ ...'" I --,..セM - ---!r...---=' I " . - -!NOVEMBER DECEMBER JANUARY FEBRUARY MARCH
1 2 0 1 - - - - " " " " ' - - - ' r - - - + - - - - + - - - I EXPOSED, HEATED, vENTILATED
2' PARAPETS o .., .... ... i :> u u ... 80iMMMMMセN 40 r---o -.-- ..- ..MNMNMMMKMMMMMMMMMKセMMMMMMエMMM MMMセM 40LMMMセ
W-t-'
s -40 KM⦅セN Il .
..:::-BGセno DIRECTK*iォセ
jセ iャセ
Ii\"
./II {, ,iセ セ
J" IGvセ YlJV' VV'" V"vv
vセB VPJ
yセMMセセMセMGO|MMMMMセ
MィMMBMセkイ
y y V \tv{\".JJV V SNOWFAll (OEC(YBER - MAACI-I) NORMAL 1962/ 63 26' 31" FIGURE 6 (b) SNOW LOAD OBSERVATIONS ON ROOFS YEAR: 1962/6320 ! 12' ABOVE ROOF 0 - - - - \ -Mセ --- ... ¢,' I .,
.
'-;:- it--_.-
IIe:
., ., f- . - ., ., ,..
<. i .' ., 1>----I-
セN 7:'-l?"-$ ---- ._- EXPOSEO, INSI.JI.ATEO, NOT VENTILATED, I./NH£AT£O AIR SPACE
0 c< I 0 60- - _.. ..J I I AGRICULTURAL E"IG BLDG ",¢• 40 I
I
I " I r:キセL
-AGRICULTURAL ENG. BLDG Ii 20-セ ,,' s jOJ
.
." " ., ,.
20 I .,'"
セI:
セ " • IA
N, I ...1 ,,0 ,. IMMセNセ _<1. ⦅lセMM⦅ 5- AAQvE.ROOf-'/tNEW CROPrヲsヲarセh
I I , I BLDC, I
i i I SHELTERED, ATTiC UNHEATED, vENTiLATED, INS/.JI.ATEO
NOVEMBER DECEMBER JANUARY FE8RUARY MARCH
120 1 , i '!' , i ..J
1
I
I ..J BO-'I
10': セ 0 I セ i I El 40 : ..,-1 >-:3 I -> => セ 0 . J ' c< I i I X 0 40セヲイlィmエ
セj
t ,rWINO DIRECTION zjlセ セiALLセ
t
aセi ゥOセゥセmaj
セセ SNOWFALL'"
(NOII[MBER MARCH) セ 20 :;:8 セW
Vii ,y
lJY I •lJ'IVV:
r
\セ 'V'IJV'VIl I NORMAL 1962/63Q:i' 43' 43" x'"
.+,
I c< '" 0 ---_.._- s +50q---
f[aMMamセ
セ +32セ
¥i\A
;g z 0 c< セivvv:
FIGURE 7 "' '" -40SNOW LOAD OBSERVATIONS ON ROOFS YEAR: 1962/63
ROOF OESCRIPTION 254 SUNVIEW
tEE
• '2, '
4. " " ." .!. セ セVGMセG セ (HEArEO, INSULATED, EXPOSEOJ40 e---o - - - _ . o _ ..
(HEATED, INSULATED, EXPOSED)
IO[C[IIBf" - ••UCH I SNOwFALL ,--' 't-r , 4
I
." I-.'- I m,-I セ --- _.L___,,,-oj
"., Lr
--9 a .1 FIGURE 8 NORMAL 1962/63 45' 37'(HEATED, INSULATED, EXPOSEO) ENGINEERING BLDG.
-MARCH
I
NOVEMBER DECEMBER JANUARY FEBRUARY
SNOW LOAD OBSERVATIONS ON ROOFS YE AR: 1962/63
II DOUGLAS CRES. IIIIN.... AT - , I
" '-0'.
MセNセセエj
-.'.' .' .'.
",,' "".' 4 .., S . -, , L , 2 • L ' . 0 1 1 = ..l.._. ⦅セM MセMM ... - ... r-..(SHEL TEREO HEATEO INSULATEDI Zl DOUGLAS CRES 21 DOUGLAS CRES. -i 'I S"'fLTEIOE:D BLDG HEATED ATTIC LlNHEATED
CEll IlliG INSULATED
JANUARY FEBRUARY MARCH
--' fl. 80ヲMMMMセ
----f---t----I
-FIGURE 9 NORMAL 1962/63 49" 32" SNOWFALL lOEcelll8ER - .. "RCH) セ _ _r l -401--- - イMMセMMMMKMセ セMセMセMMセKMセセセMMMMMセMMMMM I iセ
5 ..
-+
ャセヲゥ
i
MゥセエZLセ_エm
fLセ
セセ
RᄚセMMMセゥェGBイ
IV
セ
iVV
VIIIJセ セyi
セKUァM AIセコMMGセ KSRセMM
MMMMiセii|Mイ|MセNセセ]セ]
セs
0e--- イセM_v"'L
'" -40SNOW LOAD OBSERVATIONS ON ROOFS YEAR: 1962/63
ROOF DESCRIPTION 60 -26 EDGEHILL AVE. " 40 '[7
26 EDGE HILL r--4(l---i
YlNIM__T .5 /'\
lNセャ
20 -, 'セ
セN
MMMNNセ 7. セN.
セ Xセ| 4 --.1 .6 S- j_.
, GMセ ----0 I セ セ SHELrEREO セ.... Arne Nor HEArEO
u, BLDG HEATED it' - - - INSULATED C c( 0 ..J 60r -.. eNEILL HDUSE
T"
..
'--;-;-40 " ., ., ,. IIcNEILL HOUSE!'
I I I1
H<40' ..!- '\!. I ., ., ,. 20LセNェ
- J J "MMセ|
I.
XWᄋjセ </>-_
... -.1 / '-
.
--- A.. EXPOSED I 0 6 INSULATEDe • 6 5 5 6 6 5 ATTIC NOT VENTILATED
ATTIC NOT HEATED BLDG HEATED PARAPET 2'6"
i!i 120 NOVEMBER DECEMBER JANUARY FEBRUARY MARCH
.s ..J セ
'"
0 80 セ C セ セ w /" ......
..J 40 =>.-/
'" §セ
..
0 40 • Cw+,
セ
/
エセャ
)'...-WINO OlAECTlOIriI セZZエZZ"J /
Nセエ
1t.A
SNOWFALL "''''::E S (OECE"8£R -lOIRCHj セ」 20') 1VJU
¥IvGvujセtvv
..
..,イj|セ
NORIIAL 1962/63 」セ 64" 7S' xU>..
'" 0 'SOMセ
セ
セ u..+32---セ
Mr:fV\-...
Co.. z'" 0MNセMMM .. w FIGURE 10 w .... '" -40SNOW LOAD OBSERVATIONS ON ROOFS YEAR: 1962/63
4 0 1 j j + ,
-ROOF DESCRIPTION
セddbr
.r.
(EXPOSED, HEATED, INSULATED J
,,[7 72 BISHOP,BlVD
U
"" ·,c-N
Gセ: cr:=:::;J
tNiGセ
(EXPOSED, HEATEDI INSULATED 2")
40 BARKER BLVD D.B.R MINIMA AT #5
セMMMKMMMKi
I
•
NNNNNMMMMMMKMMMiMOセLᄋMMZ
ᄋ[Qᄋ^LセGMZエセGセZG
8----; 201---···· 0 40 N.... "-<,•
20 0 '"0 -' 0NOVEMBER DECEMBER JANUARY FEBRUARY MARCH
120 oi -' -' BO 1l'
-0 セ 0 40 w .... :3 => 2 § 0 '" 0 40 セE SNOWFALL _0:'"
(NO't'[MII£A-IIIlACIt) >-=0 NORMAL 1962/63 セセ a. B3" 5B" ><'" '" 2 >- ="-" , . 0a. z'" 0 "'w FIGURE II(0) w .... '" -40SNOW LOAD OBSERVATIONS ON ROOFS YEA R: 1962/63
H. 3'
EXPOSED UNHEATED AIR SPACE CElLlN6 INSULATED (47 HEATED BL06. FLAT' 10' TOEAVES +N--,. aii e·.7
..
a-"0 ., ,,' - - - 1 ROOF DESCRIPTION DAVIDSON CRES.(SHELTERED, HEATED, INSULATED)
L
1"Tl
'7 , ; 10II
• セTL I 6 2 5 a I • .:3 4 I L:.---':.L.1 lGセiG⦅ゥ FAIRHAVEN WAY ...x... AT .14 o >-u, <, • 20f j -o 40 o 40 40A BARKER BLVD, YAXIMA AT .12 I I DAVIDSON CRES. 2 0 1 + -40 A BARKER BLVD1201---i'---l---+----+---tNOVEMBER DECEMBER JANUARY FEBRUARY MARCH
12 -:-l-<1J iᄋセcZ]]MM --' --' 80I - - - ! - - - + - - - - -- - - t _ セ
•
o セ c 40} - - - ! - - - + - - - , = J , . - L - - - - + - - - j '" >-« ..J => :E => セ Ol---+---+--«IEXPOSED, HEATED, INSULATED)
SNOW FALL ('tOV£MBEA - ...RCH) 0 40 セZゥ
.'"
,;. セ - 0«", c'"c, xV> « :IE >- :!--« . 0 " , z:IE 0 «'" ",>-:IE -40 NORMAL 83' FIGURE 1962/63 58' 11 (b)SNOW LOAD 08 SERVATIONS ON ROOFS YEAR: 1962/63