HAL Id: hal-02937600
https://hal.insa-toulouse.fr/hal-02937600
Submitted on 14 Sep 2020
HAL is a multi-disciplinary open access
archive for the deposit and dissemination of sci-entific research documents, whether they are pub-lished or not. The documents may come from teaching and research institutions in France or abroad, or from public or private research centers.
L’archive ouverte pluridisciplinaire HAL, est destinée au dépôt et à la diffusion de documents scientifiques de niveau recherche, publiés ou non, émanant des établissements d’enseignement et de recherche français ou étrangers, des laboratoires publics ou privés.
Blast-furnace slag cement and metakaolin based
geopolymer as construction materials for liquid
anaerobic digestion structures: Interactions and
biodeterioration mechanisms
Marie Giroudon, Matthieu Peyre Lavigne, Cédric Patapy, Alexandra Bertron
To cite this version:
Marie Giroudon, Matthieu Peyre Lavigne, Cédric Patapy, Alexandra Bertron. Blast-furnace slag cement and metakaolin based geopolymer as construction materials for liquid anaerobic digestion structures: Interactions and biodeterioration mechanisms. Science of the Total Environment, Elsevier, 2021, 750, �10.1016/j.scitotenv.2020.141518�. �hal-02937600�
1
Blast-furnace slag cement and metakaolin based geopolymer as construction materials for liquid
1
anaerobic digestion structures: interactions and biodeterioration mechanisms
2
Marie Giroudon1. 2. *, Matthieu Peyre Lavigne 2., Cédric Patapy 1., and Alexandra Bertron1. 3
1.
LMDC, Université de Toulouse, UPS, INSA Toulouse, France 4
2.
TBI, Université de Toulouse, CNRS, INRA, INSA, Toulouse, France 5
*Corresponding author 6
Keywords: Anaerobic digestion, slag cement, geopolymer, biodeterioration, ammonium 7
Abstract
8
In order to promote the development of the biogas industry, solutions are needed to improve 9
concrete structures durability in this environment. This multiphysics study aims to analyse the 10
multiphases interactions between the liquid phase of an anaerobic digestion system and 11
cementitious matrices, focusing on (i) the impacts of the binder nature on the anaerobic digestion 12
process at local scale, and (ii) the deterioration mechanisms of the materials. Cementitious pastes 13
made of slag cement (CEM III), innovative metakaolin-based alkali-activated material (MKAA), with 14
compositions presumed to resist chemically aggressive media, and a reference binder, ordinary 15
Portland cement (CEM I), were tested by immersion in inoculated cattle manure in bioreactors for a 16
long period of five digestion cycles. For the first time it was shown that the digestion process was 17
disturbed in the short term by the presence of the materials that increased the pH of the liquid phase 18
and slowed the acids consumption, with much more impact of the MKAA. However, the final total 19
production of biogas was similar in all bioreactors. Material analyses showed that, in this moderately 20
aggressive medium, the biodeterioration of the CEM I and CEM III pastes mainly led to cement matrix 21
leaching (decalcification) and carbonation. MKAA showed a good behaviour with very low degraded 22
depths. In addition, the material was found to have interesting ammonium adsorption properties in 23
the chemical conditions (notably the pH range) of anaerobic digestion. 24
2
1 Introduction
25
Biogas production is based on the degradation of organic matter by microorganisms under controlled 26
anaerobic conditions (Chen et al., 2020; Huang et al., 2016; Yun et al., 2018). The process called 27
anaerobic digestion consists of four consecutive degradation reactions: hydrolysis, acidogenesis, 28
acetogenesis and methanogenesis (Batstone et al., 2002; Evans and Furlong, 2003; Wang et al., 2018) 29
and has been evaluated as being one of the most energy-efficient and environmentally friendly 30
technologies for bioenergy production (Fehrenbach et al., 2008; Yun et al., 2019, 2018). In the 31
context of climate change and depletion of fossil resources, the development of anaerobic digestion 32
structures is encouraged by the European Union, in particular through the European Directives 33
2001/77/EC and 2009/28/EC (2001, 2009). The process leads to the production of (i) a renewable 34
energy source, biogas, which is mainly composed of methane (CH4) and carbon dioxide (CO2) (Lastella
35
et al., 2002; Lesteur et al., 2010; Weiland, 2010) and (ii) a digestate that can be used as a fertilizer, 36
due to nitrogen, phosphorous and potassium content and as the bioavailability of nitrogen is greater 37
in the digestate than in the initial organic waste (Huang et al., 2016; Weiland, 2010). Optimized 38
productivity is achieved in mesophilic conditions (usually 35°C) (Kothari et al., 2014) and at pH 39
between 6.5 and 7.5 (Braun, 2007; Chandra et al., 2012; Liu et al., 2008). Although the anaerobic 40
digestion technology is widely used, biogas production and digestate reutilization still need to be 41
improved, in order to achieve maximum energy output. To this end, new strategies are being 42
developed such as the co-digestion or the addition of accelerants, leading to a better degradation 43
efficiency (Huang et al., 2016; Wang et al., 2019; Xu et al., 2020; Zhang et al., 2018). Anaerobic 44
digestion plants can be set up with different types of organic waste and the biogas recovered can be 45
used in many ways: production of heat, electricity, and vehicle fuel, or can even be injected after 46
purification, into the network of natural gas (Frigon and Guiot, 2010; Holm-Nielsen et al., 2009; Yun 47
et al., 2018). 48
3
The implementation of anaerobic digestion on an industrial scale requires airtight, isolated 49
production structures. In this context, reinforced concrete, which is also an economical building 50
material, is the most widely used material for the construction of digesters. Inside the digester, the 51
cover concrete is in direct contact with the anaerobic digestion medium in the liquid phase, while 52
polymeric liners or plastic layers are often applied to protect concrete in the gas phase (Nathalie 53
Bachmann, 2013). At every stage of the digestion, the liquid medium contains species that are 54
particularly aggressive to concrete (Koenig and Dehn, 2016; Voegel, 2017; Voegel et al., 2016, 2015), 55
such as volatile fatty acids (VFA) (several g/L), ammonium (about 1 g/L) and dissolved CO2 (several
56
g/L). These species are responsible for concrete leaching (for VFA and ammonium) and/or 57
carbonation (for dissolved CO2) of the matrix (Bertron et al., 2005a; Magniont et al., 2011; Voegel et
58
al., 2016). Moreover, the microorganisms colonize the concrete surface as a biofilm (Voegel et al., 59
2019a). Biofilms allow enhance the metabolic capacity of cells (Flemming et al., 2016) and seem to 60
amplify the material deterioration, in terms of kinetics and intensity of alteration (Magniont et al., 61
2011). So far, few studies have investigated the fate of concrete exposed to fermenting biowaste. 62
Koenig and Dehn (2016) studied the effects of anaerobic digestion in the liquid and gas phases of an 63
industrial scale pilot digester. After 1 ½ years in the liquid phase, the authors observed erosion of the 64
cover concrete and a degraded depth of 12.8 mm, with significant decalcification in the outer layer, 65
features that are typical of an attack by acids, and precipitation of calcium carbonates. Voegel et al. 66
(2019a, 2019b, 2016) identified deterioration mechanisms corresponding to a combination of 67
decalcification and carbonation on cement paste specimens immersed in a synthetic biowaste for 4 68
weeks. The presence of alkaline cementitious materials slightly increased the pH (Voegel et al., 69
2015). Nevertheless, the liquid composition varies greatly over time and according to the substrate 70
(Fisgativa et al., 2016; Li et al., 2015; Xu et al., 2019). Thus, depending on the type of biowaste, the 71
composition in terms of VFA, ammonium and CO2 varies and may impact the material differently.
72
Moreover, these studies considered only classic cement matrices (based on CEM I, CEM II, CEM III or 73
calcium aluminate cement). Thus, the degradation mechanisms of materials in anaerobic digestion 74
4
systems remain unknown for various liquid compositions and on innovative matrices. Furthermore, 75
the impact of the materials on the process efficiency (biogas production) has never been studied. 76
The purpose of this laboratory study was to thoroughly evaluate the bio-geochemical interaction 77
mechanisms between the anaerobic digestion medium and the materials at the local scale and their 78
impact (i) on the quantitative and temporal production of methane and (ii) on the mineralogical and 79
chemical alteration of the material that may compromise its long-term durability and thus the 80
sustainability of the structure. In order to address these interface issues, the exploration strategy was 81
to study the impact of different materials on anaerobic digestion by monitoring the liquid 82
environment and the biogas production on the one hand, and to evaluate changes in the solid 83
samples exposed to the medium on the other hand. Cement paste specimens made of blast-furnace 84
slag cement (CEM III), a metakaolin-based alkali-activated geopolymer, and an ordinary Portland 85
cement (OPC) paste (reference cement CEM I) were exposed to the liquid phase of inoculated cattle 86
manure for more than 36 weeks. Ground Granulated Blast furnace Slag (GGBS) is a by-product of the 87
iron industry and metakaolin is a powder obtained by calcination (600 to 800°C) and grinding of a 88
clay mainly composed of kaolinite (AFNOR, 2012a). They may be used alone or as supplementary 89
cementitious materials (SCM) with ordinary Portland cement (EN 206/CN, NF EN 197-1) (AFNOR, 90
2014, 2012b) to reduce the environmental impact of the cementitious material manufacturing by 91
reducing the content of OPC, which is CO2 emitter and energy-consuming (Juenger et al., 2019).
92
Moreover, CEM III cement pastes had already shown increased durability to acid attacks compared to 93
ordinary Portland cement (CEM I) due to the addition of aluminium-rich ground granulated blast-94
furnace slag (Bertron et al., 2005b; Gruyaert et al., 2012; Oueslati and Duchesne, 2012). The slag 95
addition increases the chemical resistance to material leaching by decreasing the calcium content of 96
the binder and leads to a reduced portlandite content, a lower Ca/Si ratio of C-S-H1 – the main 97
hydrated phase of the material – and the formation of C-A-S-H (Elakneswaran et al., 2016; 98
1 Cement chemistry shorthand notations: A = Al
5
Lothenbach et al., 2011), with higher chemical stability than C-S-H (Roosz et al., 2018). Furthermore, 99
the addition of slag to cement helps to densify the paste by filling the large pores with hydration 100
products and the resulting finer pore structure improves the transfer properties of the paste (Perlot 101
et al., 2006). The French prescription guide T47 (CIMbéton, 2009) recommends slag cements for use 102
in aggressive chemical media and they are actually used in the design of concrete for digester 103
structures. On the other hand, geopolymers have shown encouraging behaviour when exposed to 104
acidic abiotic (Drugă et al., 2018; Duan et al., 2015; Singh et al., 2015) and biotic (Grengg et al., 2020; 105
Khan et al., 2017) environments. However, the chemical and mineralogical compositions of 106
geopolymers are very variable and some of them, such as fly ash geopolymers (Khan et al., 2018), 107
and pure white metakaolin geopolymer (Grengg et al., 2020), showed poor resistance to microbially 108
induced deterioration (MID). The behaviour of these matrices therefore needs to be studied in order 109
to assess their suitability for use in an anaerobic digestion environment. 110
Cement paste specimens were exposed to the fermenting biowaste
in
biochemical methane 111potential reactors with a high solid/liquid ratio in order to reproduce local chemical conditions in the 112
vicinity of the concrete walls of the digester. The liquid and gas phases were monitored over time. 113
Scanning Electronic Microscopy (SEM) observations coupled with Electron Probe Micro-Analysis 114
(EPMA), and X-Ray Diffraction (XRD) analyses were used to investigate the chemical and 115
mineralogical changes of the specimen. 116
2
Materials and methods
1176
The experimental protocol implemented in this study is presented in Figure 1. It consisted of a series 118
of bioreactors where construction materials samples were immersed in inoculated cattle manure at 119
mesophilic temperature (35°C) in order to reproduce anaerobic digestion conditions. During the 256 120
days experiment (5 cycles of anaerobic digestion), both gas and liquid phases were monitored (see 121
section 2.3) while the chemical and mineralogical changes occurred in the cementitious material 122
samples were analysed at the end of the third and fifth cycles (see section 2.5). 123
124
Figure 1: Schematic representation of the experimental protocol to study the interactions between the anaerobic digestion 125
environment and the cementitious materials 126
2.1 Binder materials
127
Cement pastes made of CEM III/B 42.5N (CEM III), a mixture of Portland cement and GGBS, and an 128
ordinary Portland cement CEM I 52.5R (CEM I), were poured with a water/binder ratio of 0.30. The 129
metakaolin-based alkali-activated (MKAA) paste was made with the following molar ratio – 130
– by using metakaolin (Argeco), liquid sodium silicate (molar
131
ratio ) and water. The metakaolin used in this study came from the calcination of a kaolin 132
with a relatively high level of impurity and included quartz (45%), mullite (2%), calcite (1%), anatase 133
(1%) and kaolinite (1%), as well as a considerable amount of iron oxide (3.7% of Fe2O3) (Pouhet, 2015;
134
San Nicolas et al., 2013). 135
7
A procedure adapted from the French standard NF EN 196-1 (AFNOR, 2016) was used to mix the 136
paste specimens, i.e., for each cement paste, the binder and the water were mixed at low speed (140 137
± 5 rpm) for 60 seconds and at high speed (285 ± 10 rpm) for 90 seconds. The pastes were cast in 138
cylindrical moulds 75 mm high and 25 mm in diameter. Each specimen was protected from the 139
atmosphere by a plastic coating after pouring. 24h after pouring, the CEM III and CEM I pastes were 140
removed from their moulds, sealed in plastic bags and kept at 20°C for a 27-day endothermic cure. 141
MKAA pastes were cured for 7 days in their closed moulds and then stored in sealed plastic bags. At 142
28 days of maturation, the paste specimens were exposed to the fermenting biowaste. 143
2.2 Preparation of laboratory reactors and immersion of cement pastes
144
To start, 100 mL of microbial inoculum collected from an industrial biogas plant in Haute-Garonne 145
(France) and cattle manure from the experimental farm of the Engineering School of Purpan (France) 146
(the substrate) were poured into airtight biochemical methane potential (BMP) reactors (Holliger et 147
al., 2016). For each kind of material, the experiment was carried out in duplicate with two 148
bioreactors each containing a sample. In addition, two control bioreactors without material were also 149
taken into account. 150
Immediately after the first feed with substrate, the paste specimens were immersed in bioreactors. 151
The solid/liquid ratio (cement paste surface area/total liquid volume) was approximately 85 cm2.L-1, 152
much higher than the in situ ratio in a standard industrial digester of approximately 4 cm2.L-1 (Voegel 153
et al., 2015). This ratio was chosen high in order to reproduce and emphasize local phenomena in the 154
vicinity of the concrete wall, where the chemical conditions are strongly influenced by the 155
interactions between the biowaste and the cement matrix. 156
After the immersion of the samples, water was added to reach a volume of 800 mL and the gas phase 157
was flushed with N2 in order to remove O2. The bioreactors were maintained at 35°C in an oven for 5
158
cycles. At each new cycle, the liquid medium from the previous cycle was kept in the reactors, 159
supplemented with water (to reach the initial volume of 800 mL) and small amounts of new cattle 160
8
manure were incorporated (Table 1). The mass of cattle manure added increased with the cycles in 161
order to offset a decrease in the substrate's methanogenic potential over time. Each cycle was 162
considered complete when the gas production in the control reactors stopped, except for the last 163
cycle which lasted until the biogas production was over in all the bioreactors (see durations in Table 164
1). During the fourth cycle, once the biogas production was complete, the reactors were kept at 165
ambient temperature for 6 weeks because the laboratory closed for the summer break. 166
Table 1: Approximate mass of cattle manure added per cycle and duration of each cycle 167
1st cycle 2nd cycle 3rd cycle 4th cycle 5th cycle
Temperature 35°C 35°C 35°C 35°C Room 35°C
Mass of cattle manure added (g)
6 6 8 10 13
Duration of cycle (weeks) 7 6.5 5 4 6 8
168
2.3 Sampling and analysis of the anaerobic digestion medium
169
Twice a week, the gas pressure was measured and liquid was sampled. If the gas pressure was above 170
0.250 bar, some gas was sampled for analysis (O2/N2, H2, CH4 and CO2) by gas chromatography (GC
171
Trace 1300 Thermofisher) and the gas pressure was then brought back to ambient pressure. Samples 172
of 5 mL of the liquid medium were collected and the pH of each sample was measured. The liquid 173
samples were centrifuged (Eppendorf, Centrifuge 5430R) for 5 minutes (4°C, RCF 7197). In one hand, 174
the concentrations of ionic species PO43-, Na+, NH4+, K+, Cl-, Ca2+ and Mg2+ were analysed by Ion
175
Chromatography (Dionex Thermofisher DX320). In the other hand, 1 mL of the supernatant part was 176
sampled and mixed with 0.5 mL of an internal standard (solution of 2-ethyl-2-butyric acid at 1 g.L-1 in 177
demineralized water and containing 5% orthophosphoric acid H3PO4) to be analysed by gas
178
chromatography (Varian SERIE 3900/430) in order to provide the concentrations of some VFA (acetic, 179
propionic, isobutyric, butyric, isovaleric, and valeric acids). 180
9
2.4 Calculation method for aqueous inorganic CO2 and gaseous ammonium contents
181
As the analyses carried out did not allow the aqueous inorganic CO2 and gaseous ammonium
182
contents to be measured, gas and liquid chromatography results, together with thermochemical 183
equilibria associated with Henry’s law, were used to calculate these missing data. 184
2.4.1 Theoretical background: Henry’s Law
185
Henry’s law states that the partial pressure of the dilute solute in a solution is directly proportional to 186
its liquid mole fraction. The proportionality factor is called the “Henry’s law constant” ( ) (Equation 187
A). 188
(A)
In Equation A, , , and are the total pressure, the composition of solute in vapour gas (molar 189
fraction of the gas phase), Henry’s law constant of solute , and the molar fraction of the liquid 190
phase, respectively. 191
The constants were calculated considering a temperature of 35°C, the atmospheric pressure and the 192
pH after each gas sampling (values of the Henry’s law constants from Batstone et al. (2002)). 193
2.4.2 Aqueous inorganic CO2 content
194
The inorganic CO2 content corresponds to the molar fraction of the liquid phase divided by the
195
water concentration, 55.41 mol.L-1 (Equation B). 196 where (B)
Using the thermochemical equilibria (Reactions 1 and 2), and the gas composition, the total inorganic 197
CO2 content can be calculated by successively calculating the and concentrations.
198
10
(2)
where and are the thermodynamic equilibrium constants, values from Batstone et al. (2002). 199
= 4.73E-7 and = 5.60E-11 at 35°C. 200
2.4.3 Gaseous ammonium content
201
Using the thermochemical equilibria (Reaction 3) and the total ammonium concentration in the 202
liquid phase, the and concentrations were calculated.
203
, (3)
where is the thermodynamic equilibrium constant, value from Batstone et al. (2002). = 6.16E -204
10
at 35°C. 205
Henry’s law then allowed the gaseous ammonium content to be calculated, assuming equilibrium 206
and no limitation of liquid/gas transfer (Equation C): 207
where
(C)
2.5 Analysis of cementitious materials
208
At the end of each cycle, the cylindrical cement paste specimens were removed from the bioreactors 209
and a diamond saw was used to collect slices for solid analyses. Quarter sections were intended for 210
SEM and EPMA analysis. They were embedded in an epoxy resin (Mecaprex Ma2+ from Presi), and 211
dry polished using silicon carbide polishing disks (Presi) (Bertron et al., 2009). Then, the polished 212
sections were coated with carbon. Analyses by SEM (JEOL JSM-LV, 15 kV) combined with EPMA 213
analyses (Cameca SXFive, 15 kV, 20 nA) enabled the microstructural and chemical characterization of 214
the specimens. For EPMA, the points to be analysed were chosen to avoid residual anhydrous grains. 215
Chemical profiles were established from the surface in contact with the liquid phase to the core of 216
the specimen. For each point, the following elements were analysed: Ca, Si, Al, Fe, Mg, S and P. 217
Element mass percentages were expressed as mass percentages of the associated oxides. 218
11
The mineralogical composition changes of the specimens were characterized by XRD (Brucker D8 219
Advance, Co cathode, 40 kV, 40 nA). The plane side of the slice, which was directly in contact with the 220
liquid medium, was first analysed. Then, the sample was abraded in order to characterize the 221
degradation in depth, and this until reaching the sound material (Bertron et al., 2005a). 222
XRD and EPMA analyses were performed after the third cycle. SEM observations were carried out 223
after each cycle. 224
3 Results
225
3.1 Characteristics of the liquid phase according to the material during the anaerobic
226digestion
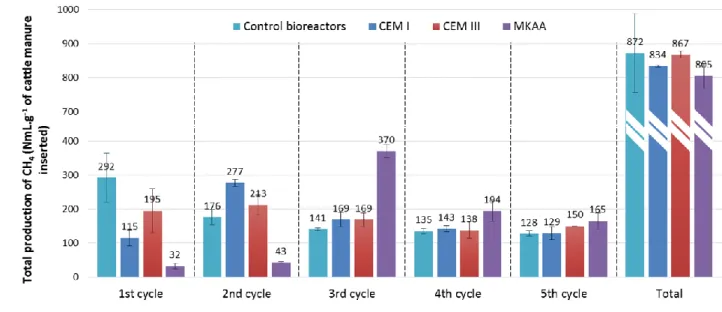
2273.1.1 Biogas production and composition
228
Figure 2 gives the total production of CH4 per gram of cattle manure in each type of bioreactor and
229
the cumulative total production at the end of the experiment. Mean values of the two duplicate 230
bioreactors are presented with the standard deviations. 231
232
Figure 2: Total production of CH4 (NmL.g-1 of cattle manure) at the end of each digestion cycle and cumulative total
233
production at the end of the experiment (Total) 234
12
In the control bioreactors, the production of CH4 reached between 292 and 128 NmL of CH4 per gram
235
of cattle manure per cycle. The decrease of the methane production as the number of cycles 236
increased expresses a decrease in the methanogenic potential of the substrate over time, which was 237
probably due to the evolution of the cattle manure during the storage (4°C) time of the experiment. 238
The presence of the cementitious materials CEM I and CEM III, induced a significantly lower methane 239
production during the first cycle than that in the control bioreactors (292 NmL of CH4/g of cattle
240
manure) with 115 and 195 NmL, respectively, of CH4 per gram of cattle manure. During the second
241
cycle, the bioreactors containing the CEM I and CEM III samples showed methane production rates 242
(respectively 277 and 213 NmL of CH4/g of cattle manure) that were higher than those of the control
243
bioreactors (176 NmL of CH4/g of cattle manure). Thereafter, production in the bioreactors
244
containing cementitious materials was equivalent to those of the control bioreactors. 245
The biogas production in the bioreactors containing alkaline MKAA was strongly delayed compared 246
to other bioreactors. About ten times less methane (32 NmL of CH4 per gram of cattle manure) was
247
produced in the MKAA bioreactors than in the control bioreactors during the first cycle and the 248
production remained very low (43 NmL of CH4 per gram of cattle manure) during the second cycle.
249
The third cycle was marked by a sharp increase of methane production in these bioreactors (370 NmL 250
of CH4 per gram of cattle manure). During the fourth and fifth cycles, methane production in the
251
MKAA reactors remained slightly higher than in the control bioreactors. 252
Even if the presence of the materials delayed the biogas production, at the end of the experiment 253
the cumulative amount of methane produced was equivalent for all the bioreactors (-4.4%, -0.6% 254
and -7.7% relative to the control for CEM I, CEM III and MKAA, respectively). 255
Table 2 gives the composition of the gas phase (N2, CH4, CO2) of the bioreactors at the end of each
256
cycle in volume percent. Mean values of the two duplicate bioreactors are presented with the 257
standard deviations. 258
13
Table 2: Composition of the gas phase (N2, CH4, CO2) at the end of each cycle (vol.%)
259
% End of 1st cycle End of 2nd cycle End of 3rd cycle End of 4th cycle End of 5th cycle
Control N2 24.5 ± 3.2 32.5 ± 3.8 31.7 ± 1.1 33.9 ± 1.4 27.9 ± 1.8 CH4 54.5 ± 1.7 42.5 ± 1.5 42.8 ± 0.4 44.7 ± 0.4 46.8 ± 1.5 CO2 22.6 ± 1.6 23.0 ± 2.4 24.0 ± 0.8 19.4 ± 1.2 25.3 ± 0.1 CEM I N2 64.2 ± 7.1 33.7 ± 1.1 34.5 ± 5.0 31.4 ± 2.1 23.8 ± 2.6 CH4 34.8 ± 6.4 48.8 ± 1.2 43.9 ± 3.1 44.0 ± 2.7 48.4 ± 1.0 CO2 2.6 ± 0.8 15.1 ± 2.4 20.1 ± 1.3 21.2 ± 1.8 27.6 ± 2.0 CEM III N2 49.2 ± 13.3 34.2 ± 6.4 32.6 ± 4.8 35.8 ± 5.7 24.7 ± 1.6 CH4 45.3 ± 8.7 46.9 ± 5.8 45.4 ± 2.6 44.8 ± 3.4 49.6 ± 0.3 CO2 7.1 ± 4.5 17.3 ± 0.7 20.2 ± 1.9 17.6 ± 1.8 25.1 ± 1.7 MKAA N2 87.5 ± 2.9 81.4 ± 1.1 16.6 ± 1.2 26.7 ± 4.7 21.6 ± 4.5 CH4 12.3 ± 3.2 15.1 ± 0.9 62.7 ± 1.3 52.9 ± 1.2 49.9 ± 3.4 CO2 0.1 ± 0.0 0.6 ± 0.0 15.5 ± 2.7 17.2 ± 3.4 28.0 ± 0.4 260
Table 2 shows that the composition of the gas phase in the control bioreactors varied little over time, 261
with about twice as much CH4 as CO2, and approached the composition of an industrial biogas (55 to
262
65% of CH4 and 30 to 40% of CO2 (Rasi, 2009)). In contrast, in the bioreactors containing the
263
materials, the proportion of N2 decreased through the cycles since more and more biogas was
264
produced. Moreover, the proportion CO2/CH4 varied depending on materials and time. While it was
265
almost constant in the control bioreactors (about 1/2), this ratio was very low in the bioreactors 266
containing materials during the first cycle. It then increased (more slowly in the bioreactors 267
containing MKAA due to the delay of the efficient biogas production) and tended to reach ½ 268
thereafter. 269
14
3.1.2 pH and volatile fatty acids production
270
Figure 3 gives the evolution of the pH during the five cycles of anaerobic digestion in the liquid 271
fraction of the bioreactors. 272
273
Figure 3: Evolution of the pH during the five cycles of anaerobic digestion in the bioreactors 274
At the start of the first digestion cycle (day 0) the pH was identical in all the bioreactors (pH = 8.5 ± 275
0.1). The subsequent measurements showed very different behaviours among the bioreactors. The 276
control bioreactors first underwent a decrease of pH during the first 30 days. From the second cycle, 277
the pH reached suitable values for anaerobic digestion and remained stable between 7.3 and 7.8 for 278
the rest of the experiment. 279
The alkalinity of the cementitious materials (CEM I and CEM III) impacted the pH which increased 280
significantly in the first few days, reaching a maximum of about 9 on day 3. Thereafter, the negative 281
effect of the cementitious materials seems to have been overcome and the pH decreased, until 282
values similar to those of the control bioreactors were observed at day 76. At the same time, biogas 283
production accelerated in these bioreactors. 284
15
Singular behaviour was observed in the bioreactor containing the MKAA. As for the bioreactors 285
containing cementitious materials, the pH first increased due to the high alkalinity of the material. 286
However, it reached a very high value, of 9.6, on the third day. The pH remained at this high value 287
during the first cycle and started to decrease halfway through the second cycle, on day 70. During 288
the third cycle, a rapid decrease of pH was observed in the MKAA bioreactors, and pH conditions 289
approached those of production in the other bioreactors. This pH drop occurred at the same time as 290
biogas production started. 291
During the fourth and fifth cycles, the pH was stable for all types of bioreactors. However, it was 292
observed that the pH in the MKAA bioreactors remained about 0.3 higher than in the others. 293
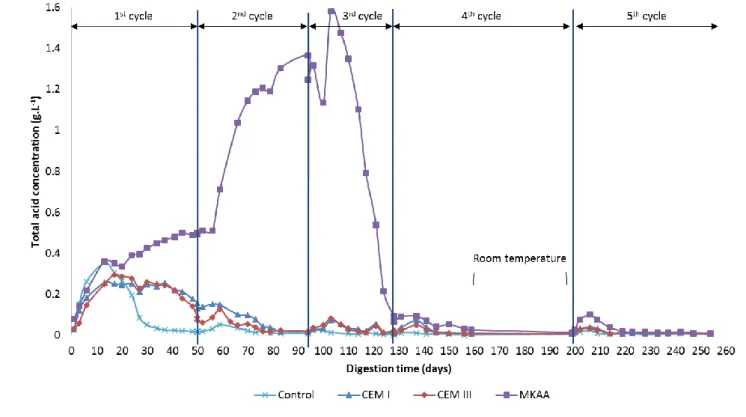
Figure 4 gives the total acid concentrations in the liquid phase of the bioreactors during the 294
experiment. Among the VFA typically metabolized by microorganisms in anaerobic digestion (acetic, 295
propionic, butyric, isobutyric and isovaleric acids) (Cibis et al., 2016), acetic acid was predominant far 296
ahead of the others, as in several previous studies (Koenig and Dehn, 2016; Voegel et al., 2019b, 297
2016). The choice was thus made to present the total acid concentration for each material. 298
The first cycle showed a significant increase in the VFA concentration at the start of the digestion. 299
Thereafter, two different types of behaviour occurred. 300
For the control bioreactors and the bioreactors containing CEM I and CEM III, the production reached 301
a maximum during the second week, with concentrations of 0.35 g.L-1, 0.26 g.L-1 and 0.29 g.L-1 302
respectively. This initial increase corresponded to the acidogenesis step and was followed by the 303
slow consumption of the VFA marking the continuation of the digestion of the cattle manure. 304
Although the CEM I, CEM III and control bioreactors shared similar behaviour, it was observed that 305
the materials had an impact (i) on the quantity of VFA produced, the CEM I bioreactors producing 306
0.09 g.L-1 less acid than the control ones, and (ii) on the kinetics of production: the decrease in the 307
total acid concentration was slower in the bioreactors containing materials and some VFA remained 308
at the end of the first cycle, highlighting a less efficient consumption of VFA. This induced a new, 309
16
smaller increase in the VFA concentration at the start of the second cycle. Thereafter, the VFA were 310
well consumed and their concentration increased only very little at the start of subsequent cycles. 311
During the first 17 days, the evolution of the VFA concentration in the MKAA bioreactors followed 312
the same trend as in the other bioreactors. Afterwards, the VFA concentration in the MKAA 313
bioreactors presented a different evolution: instead of decreasing, it continued to increase during 314
the first cycle and the accumulation of VFA accelerated with the start of the second cycle. The VFA 315
concentration reached 1.58 g.L-1 on day 103 and suddenly dropped to only 0.09 g.L-1 at the end of the 316
third cycle (day 128). This behaviour was strongly linked to the pH since the drop in the VFA 317
concentration occurred just after the pH decrease. 318
In the fourth and fifth cycles, all the bioreactors had low concentrations of VFA, showing their good 319
consumption during the anaerobic digestion. 320
321
Figure 4: Evolution of the total acid concentration during the five cycles of anaerobic digestion in the bioreactors 322
17
3.1.3 Ammonium concentration
323
Figure 5 shows the evolution of the ammonium concentration during the anaerobic digestion of 324
cattle manure in the bioreactors. 325
326
Figure 5: Evolution of the ammonium concentration during the anaerobic digestion of cattle manure in the bioreactors 327
In anaerobic digestion, ammonium is present in the substrate and is also produced by the 328
degradation of some proteins (Yenigün and Demirel, 2013), depending on the biowaste or the 329
inoculum. In our case, it can be observed that the initial addition of inoculum and substrate induced 330
a significant increase of the ammonium concentration while the following additions of substrate did 331
not lead to such an increase. Thus, ammonium was provided by the inoculum and not by the 332
biowaste. Once again, the singular behaviour of the bioreactor containing the MKAA can be noted. 333
In the bioreactors containing the cementitious materials and in the control bioreactors, the 334
ammonium content reached about 750 mg.L-1 after 30 days of digestion. After this initial increase, 335
the ammonium concentrations tended to fall slowly through cycles, probably due to the 336
consumption of ammonium for the growth of the microbial communities (Kuypers et al., 2018). 337
18
The ammonium concentrations were much lower (about 400 mg.L-1) in the bioreactors containing 338
MKAA during the first cycle and dropped during the second cycle. The ammonium concentration 339
remained around 130 mg.L-1 for the rest of the experiment. This will be investigated further in the 340
discussion section. 341
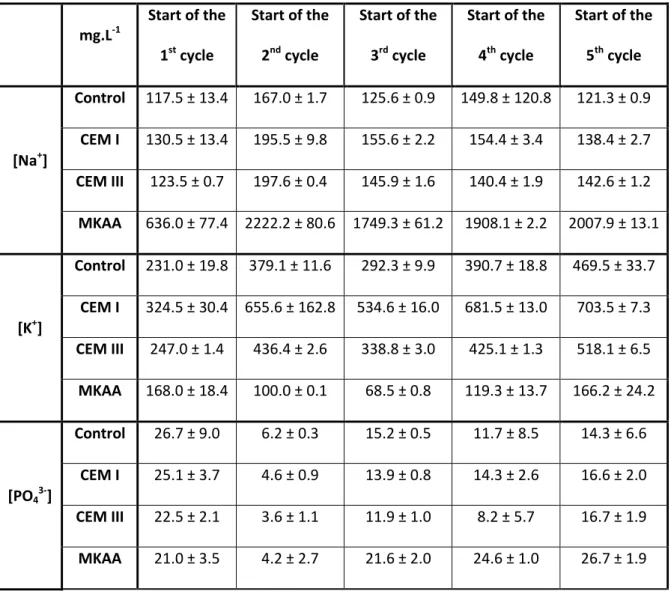
3.1.4 Release of ions in solution
342
Table 3 gives the Na+, K+, PO43- and Mg2+ concentrations (mg.L-1) in the liquid phase of the bioreactors
343
at the start of each cycle. Mean values of the two duplicate bioreactors are presented with the 344
standard deviations. 345
Table 3: Na+, K+, PO43- and Mg2+ concentration (mg.L-1) in the liquid phase of the bioreactors at the start of each cycle
346 mg.L-1 Start of the 1st cycle Start of the 2nd cycle Start of the 3rd cycle Start of the 4th cycle Start of the 5th cycle [Na+] Control 117.5 ± 13.4 167.0 ± 1.7 125.6 ± 0.9 149.8 ± 120.8 121.3 ± 0.9 CEM I 130.5 ± 13.4 195.5 ± 9.8 155.6 ± 2.2 154.4 ± 3.4 138.4 ± 2.7 CEM III 123.5 ± 0.7 197.6 ± 0.4 145.9 ± 1.6 140.4 ± 1.9 142.6 ± 1.2 MKAA 636.0 ± 77.4 2222.2 ± 80.6 1749.3 ± 61.2 1908.1 ± 2.2 2007.9 ± 13.1 [K+] Control 231.0 ± 19.8 379.1 ± 11.6 292.3 ± 9.9 390.7 ± 18.8 469.5 ± 33.7 CEM I 324.5 ± 30.4 655.6 ± 162.8 534.6 ± 16.0 681.5 ± 13.0 703.5 ± 7.3 CEM III 247.0 ± 1.4 436.4 ± 2.6 338.8 ± 3.0 425.1 ± 1.3 518.1 ± 6.5 MKAA 168.0 ± 18.4 100.0 ± 0.1 68.5 ± 0.8 119.3 ± 13.7 166.2 ± 24.2 [PO43-] Control 26.7 ± 9.0 6.2 ± 0.3 15.2 ± 0.5 11.7 ± 8.5 14.3 ± 6.6 CEM I 25.1 ± 3.7 4.6 ± 0.9 13.9 ± 0.8 14.3 ± 2.6 16.6 ± 2.0 CEM III 22.5 ± 2.1 3.6 ± 1.1 11.9 ± 1.0 8.2 ± 5.7 16.7 ± 1.9 MKAA 21.0 ± 3.5 4.2 ± 2.7 21.6 ± 2.0 24.6 ± 1.0 26.7 ± 1.9
19 [Mg2+] Control 2.2 ± 0.6 56.3 ± 3.5 32.6 ± 1.4 38.6 ± 4.2 38.3 ± 5.9 CEM I 2.9 ± 1.3 56.7 ± 2.4 50.1 ± 7.8 55.6 ± 6.1 58.4 ± 3.5 CEM III 2.8 ± 0.6 67.2 ± 2.5 65.3 ± 2.0 68.9 ± 4.8 65.7 ± 1.7 MKAA 27.4 ± 2.9 45.3 ± 3.6 19.3 ± 1.6 19.9 ± 1.5 30.7 ± 2.6 347
In the bioreactors containing the cementitious materials and in the controls, the sodium 348
concentration remained between 100 and 200 mg.L-1 throughout the experiment. Because of its 349
sodium activation, the MKAA released much more Na+: its concentration in the bioreactor liquid 350
phase increased until day 60 and remained around 2000 mg.L-1 thereafter. 351
The potassium concentration followed the same trend in the bioreactors containing the cementitious 352
materials and in the control bioreactors: a first increase until day 35 and slight variations thereafter. 353
The potassium concentration in the control bioreactor was between 300 mg.L-1 and 400 mg.L-1 during 354
the experiment. Bioreactors containing the cementitious materials showed higher potassium 355
concentrations, between 300 mg.L-1 and 700 mg.L-1 in the bioreactor containing CEM I and between 356
250 mg.L-1 and 500 mg.L-1 in the bioreactors containing CEM III. The potassium concentration in the 357
bioreactors containing MKAA remained between 100 and 200 mg.L-1 throughout the experiment. 358
Moreover, the K+ concentration for the MKAA bioreactors was found to be lower than that of the 359
control bioreactor during the whole experiment: the release of Na+ could have led to an exchange of 360
the Na+ and the K+ ions in the material (O’Connor et al., 2010). 361
The phosphate concentrations followed a similar trend in the control bioreactors and in the 362
bioreactors containing CEM I and CEM III: a first decrease from 25 ± 2 mg.L-1 to 5 ± 1 mg.L-1 and then 363
an increase leading to stable concentrations between 8 and 15 mg.L-1. In the bioreactors containing 364
MKAA, the phosphate concentration was similar to that in the other bioreactors during two cycles, 365
but rose significantly afterwards (24 ± 3 mg.L-1). 366
20
Magnesium is provided by the inoculum and by the leaching of the materials. In the control 367
bioreactors and in the bioreactors containing CEM I and CEM III, the magnesium concentration 368
started at about 3 mg.L-1 and reached 60 ± 6 mg.L-1 at the start of the second cycle. The magnesium 369
concentration was then stable at about 36 mg.L-1, 55 mg.L-1 and 67 mg.L-1 in the control bioreactor, 370
the bioreactor containing CEM I and the bioreactor containing CEM III, respectively. The initial 371
magnesium concentration (day 1) in the bioreactor containing MKAA was higher than in the others 372
(27.4 ± 2.9 mg.L-1) but the following increase was less significant than in the other bioreactors. The 373
magnesium concentration then remained between 20 and 30 mg.L-1. 374
3.2 Microstructural, chemical and mineralogical changes in the material samples
3753.2.1 Microstructural changes
376
Figure 6 shows the images of the samples of materials obtained by SEM in back-scattered electron 377
(BSE) mode before immersion and after the third and the fifth cycles. The surfaces in contact with 378
the fermenting biowaste are at the top of the images and the cores of the specimens at the bottom. 379
BSE images are characterized by a range of grey levels, which are proportional to the average atomic 380
weight of the analysed volume (or density). Thus, the grey level gives information about the different 381
phases, the heaviest elements being bright and the lightest elements being dark. The presence of a 382
small quantity of solid (i.e. a high quantity of porosity) in an analysed area is characterized by a 383
darker contrast. 384
After the immersion, the cores of the specimens showed a high density of anhydrous residual grains 385
(lighter grey grains). The outer layer (in contact with the biowaste) showed darker grey zones, 386
corresponding to a decrease of mass density following the exposure to the fermenting biowaste. 387
Most of the cracks observed were probably linked to shrinkage caused by sample preparation and to 388
the more fragile nature of the external zones. The CEM I paste already showed a lower density zone 389
after 3 cycles and a local dissolution was observed after the 5th cycle (top right of the image). This 390
dissolution may have been associated with high local concentrations of acid. 391
21
After the 3rd cycle, the CEM III paste showed cracks, probably due to the way the sample was 392
prepared. However, after the 5th cycle, no dissolution was observed but a zone of lower density 393
appeared in the external part. 394
In contrast, the MKAA paste did not show any sign of deterioration after 3 cycles and only a thin layer 395
on the external part presented a lower density after 5 cycles. 396
397
Figure 6: Observation of the paste by scanning electronic microscopy in back-scattered electron mode, before immersion and 398
after the third and fifth cycles. Surface in contact with the fermenting biowaste is at the top of each image and the core of 399
the specimen is at the bottom. 400
22
3.2.2 Chemical and mineralogical changes
401
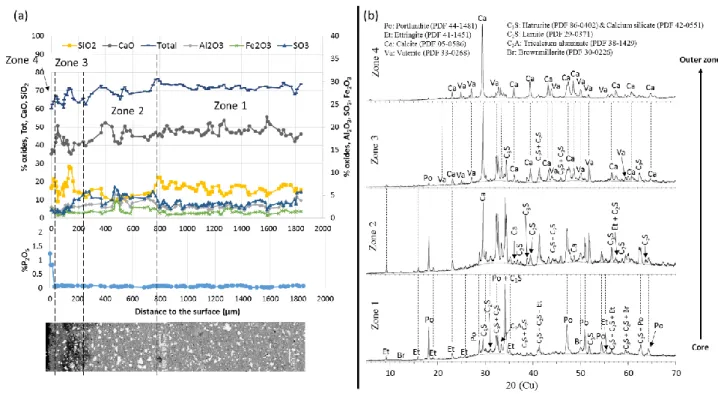
Chemical composition profiles (EPMA), microscopic observations (SEM in BSE mode) and XRD 402
analyses were carried out to identify the structural, chemical and mineralogical changes after the 3rd 403
cycle for the CEM I (Figure 7) and CEM III pastes (Figure 8). 404
3.2.2.1 CEM I and CEM III
405
406
Figure 7: (a) Chemical composition profile, according to the distance to the surface, of a CEM I paste immersed in the liquid 407
phase in anaerobic digestion conditions (EPMA), and SEM observations of the polished sections in BSE mode. (b) 408
Mineralogical analyses of the same sample immersed for three consecutive cycles 409
Zonation, from the core to the outer layer, was identified for the sample and is represented in the 410
chemical composition profile (zones 1 to 4): 411
Zone 1 corresponds to the sound zone. The SEM images show unaltered cement pastes where white 412
anhydrous grains are surrounded by the hydrated paste. Pastes are predominantly composed of 413
calcium and silicon, with minor amounts of aluminium, sulfur and iron. The mineralogical analyses 414
show peaks of hydrated phases and anhydrous phases: portlandite, ettringite, C2S, C3S and C4AF, and
415
also merwinite C3MS2 for the CEM III paste.
23
Zone 2 is 400 µm thick and shows an enrichment in sulfur. The relative silica content drops in this 417
zone whereas the aluminium content increases. The slight intensification of the ettringite peaks in 418
the mineralogical patterns suggests that, as in the study by Voegel et al. (2016), the sulfur 419
enrichment could come from the precipitation of secondary ettringite in this zone. This secondary 420
ettringite precipitation is classically observed in transition zones of specimens exposed to leaching 421
because of the diffusion of sulfates from the altered zone (Bertron et al., 2005a; Faucon et al., 1998). 422
The total oxide content remains stable. 423
Zone 3, the thickness of which is about 400 µm in the CEM I paste and 180 µm in the CEM III paste, is 424
first marked by a decrease in the calcium and sulfur contents. The total oxides content decreases as a 425
result of the decrease of CaO. In this zone, the SEM image shows a very low density and a 426
heterogeneous layer. The mineralogical patterns show the precipitation of calcium carbonates, 427
calcite and vaterite, with a decrease of the peak intensities in the initial phases. This suggests 428
combined dissolution/precipitation phenomena. 429
Zone 4, about 30 µm thick, is marked by a sudden increase of the phosphorus content - from 0 to 430
1.25% in the CEM I paste and from 0 to 1% in the CEM III paste. This zone also shows a decrease in 431
the CaO, SiO2 and total oxides contents. After the third cycle, the only remaining crystallized phases
432
are the calcium carbonates, calcite and vaterite. 433
24 434
Figure 8: (a) Chemical composition profile, according to the distance to the surface, of a CEM III paste immersed in the liquid 435
phase in anaerobic digestion conditions (EPMA), and SEM observations of the polished sections in BSE mode. (b) 436
Mineralogical analyses of the same sample immersed for three consecutive cycles 437
3.2.2.2 MKAA
438
The chemical composition of the MKAA specimen after the third cycle is presented in Figure 9. The 439
specimen did not seem to present degradation at any stage of the experiment, except on a thin outer 440
layer (50 µm after the third cycle), which was darker on the SEM image: the release of alkaline ions 441
did not impact the major oxides over more than 50 µm. 442
The XRD analyses after the third cycle were identical to the initial XRD analyses of the sound paste. 443
The crystallized phases were mainly quartz but hematite, calcite, anatase and mullite were also 444
present. Their analyses through time did not highlight any mineralogical change between the core of 445
the specimen and the outer zone. However, it should be noted that the mainly amorphous nature of 446
the sound MKAA paste did not allow every mineralogical change to be identified. 447
25 448
Figure 9: (a) Chemical composition profile according to the distance to the surface (EPMA) of an MKAA paste immersed in 449
the liquid phase in anaerobic digestion conditions), and SEM observations of the polished sections in BSE mode. (b) 450
Mineralogical analyses of the same sample immersed for three consecutive cycles 451
4 Discussion
452
4.1 Characteristics of the digestate as a function of the material nature during anaerobic
453digestion
4544.1.1 Production of biogas and volatile fatty acids
455
Correlations of the biogas production, the VFA production and the pH of each type of bioreactor 456
were investigated to understand the effect of the nature of each sample on the anaerobic digestion 457
process: the presence of materials had an impact on the digestion but it was limited in time. In the 458
short term, two types of behaviour were identified: 459
In the bioreactors containing CEM I and CEM III, the VFA were not well consumed and 460
accumulated in the liquid environment during the first cycle but biogas was still produced. 461
In the bioreactors containing MKAA, the material presence had a strong impact on the liquid 462
environment for three cycles since the VFA accumulated first and no biogas was produced 463
during two cycles. 464
26
For the control bioreactors, the first cycle showed an acidification of the media from a pH of 8.38 up 465
to 7.12, corresponding to VFA production (hydrolysis and acidogenesis steps) (Han et al., 2019). It can 466
be noticed that the initial value of the pH was much higher than the ones reported by Han et al. 467
(2019) and Yun et al. (2018), respectively 6.7 and 6.1. According to Yun et al. (2018), this low pH 468
comes from the partial acid peculiarity of the cattle manure. In the current study, since the cattle 469
manure was not fresh, the substrate acids were probably already consumed. Moreover, the inoculum 470
used was adapted to the substrate and was rich in bicarbonates, which explains the higher pH. A 471
maximum VFA concentration of 0.35 g.L-1 was reached and the VFA were then well consumed by the 472
microorganisms: after the thirteenth day, the total acid concentration decreased and biogas was 473
produced, meaning that the anaerobic digestion process was complete. This effective digestion of 474
the substrate continued through the following cycles with a pH that remained stable between 7.3 475
and 7.8, which is slightly lower but coherent with the pH values of the control check sample of Han et 476
al. (2019). 477
The bioreactors containing CEM I and CEM III pastes underwent a pH increase in the first three days 478
due to the alkaline nature of the materials, which released alkaline ions during the first cycle. 479
Afterwards, the pH decreased while the VFA concentration increased over a period of 10 days. The 480
increase in VFA concentration was slower and less significant in these bioreactors than in the control 481
ones (maximum VFA concentration of 0.26 g.L-1and 0.29 g.L-1 in the bioreactors containing CEM I and 482
CEM III respectively). From day 13, a slow consumption of the acids by the methanogenic archaea 483
occurred, highlighted by a decrease of the VFA concentration. The lack of efficiency in the VFA 484
production and consumption was associated with a low production of biogas during the first cycle. 485
During the second cycle, the bioreactors containing cementitious materials reached a pH about 7.5, 486
which was similar to that of the control bioreactors and suitable for anaerobic digestion - especially 487
the methanogenic microbial activities, for which the optimal pH range is between 6.5 and 8.2 488
(Kothari et al., 2014). During this cycle, the bioreactors containing the cementitious materials 489
produced biogas in greater quantities than the control ones did, due to the undigested cattle manure 490
27
remaining after the first cycle. From the third cycle, these bioreactors behaved similarly to the 491
controls and the presence of materials no longer disturbed the anaerobic digestion process. 492
The lower VFA production of the first cycle in the bioreactors containing cementitious materials was 493
also observed by Voegel et al. (2016). In their study, CEM I pastes (water/cement = 0.4) were 494
immersed in an inoculated synthetic biowaste, representative of organic domestic waste, for a single 495
cycle of anaerobic digestion. The substrate induced significantly higher maximum acid concentrations 496
than in the current study, about 2.90 g.L-1 (43 mmol.L-1) in the control bioreactors and a slightly lower 497
concentration, about 2.85 g.L-1 (41 mmol.L-1), in the bioreactors containing CEM I paste. Moreover, 498
the pH values between 7 and 8 found in the studies by Voegel et al. (2019b, 2016) were similar to 499
those encountered in the current study, whereas a slightly lower pH, around 7, was observed in the 500
liquid phase of a laboratory fermenter in a study by Koenig and Dehn (2016). 501
In the MKAA bioreactors, the pH was very high, between 9 and 9.5, during the first two cycles. This 502
can be explained by the strong release of alkalis that occurred during the first cycle (about 2 g/L of 503
Na+, Table 3). These high pH values were much higher than the ones tolerated by the methanogenic 504
archaea (optimal pH around 7 (Chae et al., 2010)). These are the most fragile microorganisms of the 505
anaerobic digestion process and are sensitive to pH variations (Chae et al., 2010), unsuitable pH 506
leading to very low biogas production. At the same time, the VFA accumulated in the medium and 507
accentuated the environment’s aggressiveness. The formation of VFA in the medium showed that 508
the high pH did not disturb the first steps of the anaerobic digestion (hydrolysis, acidogenesis), 509
although the optimal operating pH of these bacteria is between 5.5 and 6.5 (Hagos et al., 2017; Han 510
et al., 2016; J. Kim et al., 2003; M. Kim et al., 2003; Yu and Fang, 2002). The third cycle showed a 511
decrease of the pH, probably due to the accumulation of the VFA in the medium, since most alkalis 512
were released during the first cycle. This decrease of pH allowed the methanogenic activities to take 513
place, and thus the rapid consumption of the VFA, leading to a significant production of biogas. The 514
28
accumulation of methane produced during the third cycle indicated that not all the methane 515
potential was expressed earlier, due to the delay in the anaerobic digestion reactions. 516
According to the thermochemical equilibria (Reactions 1 and 2) associated with Henry’s law at 35°C, 517
the increase in pH during the first cycles in the bioreactors containing materials led to a reduction of 518
the volatilization potential of CO2, which can explain the lower CO2 amount in the gas phase during
519
this period. 520
In all the bioreactors containing materials, when conditions suited to anaerobic digestion were well 521
established, the process remained efficient over time. Moreover, the final total production of 522
methane was equivalent in all the bioreactors (Figure 2), so the presence of the materials 523
nevertheless allowed the expression of the methane potential of the entire amount of substrate. It 524
can be assumed that the retarding effect of the MKAA on the biogas production is only expressed in 525
the short term, as geopolymers rapidly lose their alkaline charge, which is mainly present in the liquid 526
contained inside pores (Khan et al., 2020). 527
4.1.2 Ammonium production
528
A significant difference of ammonium concentration was observed between, on the one hand, the 529
control bioreactors and the bioreactors containing the cementitious materials and, on the other 530
hand, the bioreactors containing MKAA. This suggests a specific behaviour of the MKAA towards 531
ammonium, which needs to be studied more thoroughly. 532
4.1.2.1 Control bioreactors and bioreactors containing CEM I and CEM III
533
The ammonium concentrations in the CEM I, CEM III and control bioreactors increased until a 534
maximum of about 750 mg.L-1 was reached on the 35th day. Similar concentrations were found in 535
Voegel et al.’s study (2016) (800 mg.L-1), where the presence of CEM I cement paste also did not 536
influence the ammonium production. It could be expected that each addition of cattle manure would 537
lead to an increase in the potential of hydrolysable nitrogen but the ammonium concentrations 538
29
actually decreased during the experiment, meaning that this element was mainly brought by the 539
inoculum. In Voegel et al. (2019b), the ammonium concentration did not increase with a new 540
substrate addition either, since the measured concentrations were 988 mg.L-1 (54.9 mmol.L-1) in the 541
first cycle and 940 mg.L-1 (52.24 mmol.L-1) in the second. The decrease of the ammonium 542
concentration could be explained by several phenomena: nitrogen consumption by bacteria for 543
growth (Kuypers et al., 2018), stripping of the ammonium in the gas phase in the form of ammonia 544
(Limoli et al., 2016), and/or formation of precipitates containing ammonium (struvite, for example) 545
(Cerrillo et al., 2015; Escudero et al., 2015). 546
Using the chemical oxygen demand (COD) of the CH4 production with the biomass production yields
547
proposed by the Anaerobic Digestion Model n° 1 (ADM1) (Batstone et al., 2002), the quantity of 548
biomass produced per cycle was estimated and its growth only required 61 mg of nitrogen, which is 549
insufficient to justify the difference of 253 mg of nitrogen lost between the maximum concentrations 550
(day 37) and the end of the fifth cycle. 551
The method used for gas chromatography did not allow identifying and measuring ammonia in the 552
gas phase. Thus, the thermochemical equilibrium (Reaction 4) associated with Henry’s law at 35°C 553
and atmospheric pressure, were used and it was found that the amount of volatile ammonia passing 554
into the gas phase did not exceed 0.15 mg for the whole experiment in these bioreactors. 555
(4)
Moreover, thermodynamic calculations using the geochemical code PHREEQC and considering the 556
temperature, the pH and the concentrations in the solution (N as ammonium, P as phosphate, K, Mg, 557
Cl, Ca, Na, inorganic carbon) (Table 3) were carried out to assess the possibility of struvite 558
precipitation during the digestion. The MINTEQ database was used together with the struvite 559
solubility value at 35°C; pKsp struvite= -13.20 (Bhuiyan et al., 2007). Figure 10 shows the variation of the
560
struvite saturation index of the liquid phase of the bioreactors containing CEM I and MKAA with time. 561
Precipitation conditions are met for a positive index, while a negative index corresponds to 562
30
dissolution if struvite is present. The bioreactors containing CEM I were chosen to represent the 563
bioreactors containing CEM I and CEM III and the control bioreactors. In these bioreactors, struvite 564
precipitation was continuously possible during the experiment, with higher indices in the first cycle 565
and values closer to 0 at the end of the experiment. The ammonium loss during the experiment could 566
thus be explained by the precipitation of struvite. 567
568
Figure 10: Variation with time of the Struvite Saturation Index of the liquid phase of the bioreactors containing CEM I and 569
MKAA 570
4.1.2.2 Bioreactors containing MKAA
571
In comparison with the other bioreactors, the bioreactors containing MKAA reached a lower 572
maximum ammonium concentration, of about 400 mg.L-1, on day 30. At this stage of the process, the 573
pH was about 9.5. According to the pKa of the acid and conjugate base NH4+/NH3, i.e. 9.25 (Reaction
574
4), the ammonium was thus present in the form of both ammonium and ammonia. The volatile 575
ammonia form could have passed into the gas phase, leading to a weaker ammonium concentration 576
measured in the liquid phase of the MKAA bioreactors. Nevertheless, this hypothesis implies that a 577
fall in pH should lead to an increase in the ammonium concentration in the liquid medium, whereas 578
the concentration actually dropped quickly during the second cycle, at the same time as the pH 579
31
started decreasing. Moreover, the thermochemical equilibrium (Reaction 4) associated with Henry’s 580
law at 35°C and atmospheric pressure allowed the amount of ammonia in the gas phase to be 581
calculated: this amount was very small throughout the experiment and did not exceed 0.5 mg of NH3,
582
which does not explain the lower ammonium concentration found in the liquid phase of the MKAA 583
bioreactors. 584
The thermodynamic calculations using the geochemical code PHREEQC allowed us to follow the 585
variation of the Struvite Saturation Index of the liquid phase of the bioreactors containing MKAA 586
(Figure 10). The index was positive during the first cycle, but with lower values than in the other 587
bioreactors, while the ammonium concentration was lower in the bioreactors containing MKAA. 588
Moreover, whereas the acidification of the environment (from day 66) led to negative or neutral 589
struvite saturation indices, the ammonium concentration decreased in the bioreactors containing 590
MKAA. Thus, even if struvite can precipitate at the beginning of the experiment, the trend of the 591
ammonium concentration in the bioreactors containing MKAA remains unexplained, and is probably 592
the result of a combination of phenomena. 593
According to the literature, natural zeolites (hydrated aluminosilicates) have been successfully used 594
in wastewater treatment to remove ammonium (Luukkonen et al., 2016; Wang et al., 2011). The ion 595
exchange properties of the material are attributed to the charge-balancing cation (Na+ or K+) being 596
replaced by another cation, such as K+, Ag+, NH4+ or Pb2+ (O’Connor et al., 2010). As synthetic zeolites,
597
metakaolin-based alkali-activated geopolymers have been studied for ammonium removal by 598
Luukkonen et al. (2016). In this study, the maximum capacity of metakaolin geopolymer to remove 599
NH4+ was 46% higher than that of natural zeolite, showing its potential interest in such an
600
application. The adsorption process is influenced by the pH: for pH higher than 9.25, NH4+
601
deprotonates to NH3 (Reaction 4) which is not favourable to adsorption. Actually, the ammonium
602
adsorption capacity seems to decrease even from pH ≥7 (Marañón et al., 2006). 603
32
According to the former results, it is thus possible that ammonium was adsorbed on the surface of 604
the MKAA pastes through an exchange mechanism between a cation of the sound paste and the NH4+
605
cation in the liquid phase. The liquid medium analyses showed high concentrations of Na+ (2000 606
mg.L-1 on average), this element being leached from the MKAA matrix. The drop of ammonium 607
concentration during the second cycle might be explained by the sudden drop of pH (due to the VFA 608
accumulation) leading to more suitable adsorption conditions. Then, although the ammonium 609
concentration appeared to be lower in the bioreactors containing MKAA, the production of 610
ammonium in the liquid medium due to digestion was probably similar in all the bioreactors, the 611
difference being adsorbed by the MKAA. 612
4.2 Exchange phenomena between the MKAA and NH
4+613
In order to investigate the assumption concerning the adsorption of NH4+ by the MKAA, based on the
614
literature, an additional test was carried out to study the interaction between the MKAA and the 615
NH4+ cation. The test design was adapted from the experimental protocols implemented by Lin et al.
616
(2013) and Luukkonen et al. (2016). 617
This experiment aimed (i) to investigate the exchange phenomena between the MKAA and NH4+ for
618
different pH values and (ii) to understand how the ammonium cation interacted with the material. To 619
this end, MKAA powder was immersed in an ammonium nitrate solution and the ammonium 620
concentration was monitored for various pH values. The remaining MKAA powder was also analysed. 621
4.2.1 Experimental protocol
622
An 800 mg.L-1 (0.0444 mol.L-1) ammonium nitrate solution was prepared with demineralized water 623
(according to the ammonium concentration found in the control bioreactors) and a cylindrical 624
specimen of MKAA paste (75 mm high and 35 mm in diameter) was ground to 80 µm using a disc 625
mill. 626
33
500 mL of solution was poured into a glass reactor thermostatically controlled at 35°C with magnetic 627
stirring (Annexe A). The pH value was measured continuously and recorded every 15 seconds. After 628
about 30 minutes (the time for the temperature of the ammonium nitrate solution to reach 35°C), 10 629
g of MKAA powder was poured into the reactor. After 3 hours, 1 mL of concentrated HNO3 acid (69%)
630
was added in order to lower the pH. Samples of the liquid were then taken at different stages of the 631
experiment to be analysed by Ion Chromatography (Thermo Electron ICS 300, CS16 column). The pH 632
evolution and the distribution of the liquid samples in time (W1 to W5) are presented in Figure 11 633
(a). The experiment was performed in duplicate (reactor 1 and reactor 2). In order to reach another 634
final pH, a supplementary experiment was run with the addition of 350 µL of HNO3 only. The pH
635
evolution and the distribution of the liquid samples S1 & S2 in time are presented in Figure 11 (b). 636
637
Figure 11: pH evolution according to time and distribution in time of the liquid sampling: (a) in the two duplicate reactors for 638
1 mL of added HNO3 and (b) in the solution of the supplementary experiment for 350 µL of added HNO3
639
After the end of the main experiment, the solution was centrifuged in order to collect the MKAA 640
powder. It was then immersed in isopropanol for 15 minutes to dry by solvent exchange (Scrivener et 641
al., 2016; Snellings et al., 2018). After another centrifugation, the powder was collected and placed in 642
a vacuum desiccator for 1 hour to finish drying. This powder and a control MKAA powder were 643
analysed in several ways: thermogravimetric analysis (NETZSCH STA 449F3); 27Al, 29Si and 1H nuclear 644
magnetic resonance (NMR) (Brucker Avance 4000 III HD MAS); and infrared spectrometry (FTIR) 645