Creep Resistance of Directionally Solidified Eutectic
Ceramics: Experiments and Model
by
Jin Yi
B.S. Material Science and Engineering
University of Science and Technology Beijing, 1993
S.M. Material Science and Engineering
University of Science and Technology Beijing, 1999
Submitted to the Department of Mechanical Engineering
in partial fulfillment of the requirements for the degree of
Doctor of Philosophy
at the
MASSACHUSETTS INSTITUTE OF TECHNOLOGY
June 2004
©
Massachusetts Institute of Technology 2004. All rights reserved.
A uthor ... ... ... ....
. . , /
'.
...
I . .
...
Department of
echanical Engineering
May 18, 2004
C ertified by ...
:...
.Ali.
Argon
Professor
Thesis Supervisor
A ccepted by ...
...
Ain A. Sonin
Chairman, Department Committee on Graduate Students
MASSACHUSETTS INSTI E
Creep Resistance of Directionally Solidified Eutectic Ceramics:
Experiments and Model
by
Jin Yi
Submitted to the Department of Mechanical Engineering on May 18, 2004, in partial fulfillment of the
requirements for the degree of Doctor of Philosophy
Abstract
The creep resistance of the directionally solidified eutectic ceramic of Al203/c-ZrO 2(Y203)
was studied in the temperature range of 1200-1520 C both exprimentally and by the mecha-nistic dislocation model. The topologically continuous majority phase of A1203 has a nearly
perfect growth texture in the [0001] direction and encapsulates the minority c-ZrO2(Y2O3)
phase in a variety of morphologies. This encapsulated minority phase, too, has a close to < 110 > growth texture, regardless of morphology. The two phases are separated by well-structured interfaces.
The tensile creep of the eutectic in its growth direction exhibits an initial transient that is attributed to stress relaxation in the c-ZrO2(Y2O3) phase, but otherwise in steady
state shows many of the same characteristics of creep in sapphire single crystals with c-axis orientation. The creep strain rate of the eutectic has stress exponents in the range of 4.5-5.0 and a temperature dependence suggesting a rate mechanism governed by oxygen ion diffusion in the A1203. Since the deformation is isolated in each phase and glide in any
available slip systems is not possible, the recorded creep strain is derived from the diffusion-controlled climb of pyramidal edge dislocations in the Al203 phase, which is supported by
TEM observations. The evidence suggests that the climbing dislocations in A1203 must
repeatedly circumvent the c-ZrO2(Y203) domains acting as dispersoids, resulting in the
stress exponents larger than 3. The mechanistic dislocation creep model is in very good agreement with the experiments. Low angel boundaries in the form of asymmetrical tilt boundaries are found between columnar colonies in the crept specimens. These could have formed by the reaction of basal dislocations and pyramidal dislocations, but generally were thought to result from aggregation of climbing pyramidal edge dislocations. The various possibilities of dislocation sources in A120 3 are also discussed.
Thesis Supervisor: Ali S. Argon Title: Professor
Acknowledgments
The years at MIT pursuing my doctorial degree have been a very challenging and
reward-ing experience. Durreward-ing these years, many have guided and helped me to overcome many
obstacles to finish this thesis. I realize that my appreciation to those people can hardly be
expressed in such a short acknowledgement.
With my sincere gratitude, I would like to thank Professor Ali S. Argon who has been
my advisor and mentor for the past five years. His academic vision and knowledge have
not only supported me through those years of long research "incubation" period, but also
stimulated and guided me to many new aspects in materials and mechanics.
My appreciation also goes to Professor David M. Parks and Professor Yet-Ming Chiang for serving on my committee, and for providing valuable comments and insights on my
research. I would like to acknowledge Professor John B. Vander Sande for his inspiring
guidance on my TEM experiments, Dr. Ali Sayir at NASA John Glenn Research Center for
his help on fabricating materials and research collaboration, Professor Arthur Heuer and
Professor K.P.D. Largel6f at Case Western Reserve University for providing very thoughtful
comments in this research. I would also like to thank Professor Mary Boyce, Professor Lallit
Anand and Professor Simona Socrate for their advices.
I would like to acknowledge the financial supports from AFOSR, MIT Graduate Student
Fellowship Program, and MIT Mechanics and Materials group of the Mechanical
Engineer-ing Department.
I am grateful to my colleagues at Mechanics and Materials Group, Gu, Tom, Yu, Steve, Heather, Mats, Ethan, Hang, Raj, Nici, Jeremy, Nuo, Franco, Ekrem, Ted, Mohit, Chris, Cheng, Yujie, Regina, Mike, Petch, Suvrat, Adam, Anastassia, Scott, Vaibhaw, Dora, Yin, Anu, Melis, Kristen. I shall thank them all for warm friendship which made my stay at
MIT a cherishing and memorable one, and for fruitful discussions and help. I am also very
friendly to me and all of my fellow graduate students.
I am deeply indebted to my parents who raised me and led me to be in love with science, and my wife, Yue, who provided endless support and love during my journey at MIT. I would
Contents
1 Introduction
2 Directionally Solidified Eutectic Material: Al20 3/c-ZrO 2(Y2O3)
2.1 M aterial Fabrication . . . . 2.2 Microstructure Characterization . . . .
3 Tensile Creep Experiments
3.1 Tensile Creep Specimens . . . .
3.2 Tensile Creep Apparatus . . . .
4 Creep Behavior of A1203/c-ZrO 2(Y2O3)
4.1 Transient Effects . . . .
4.2 Steady State Creep . . . .
4.3 Microstructure Coarsening Experiment . . . .
5 Transmission Electron Microscopy
5.1 TEM Foil Preparation . . . .
5.2 TEM Operations . . . .
5.3 Dislocation Systems in A1203 . . . .
5.4 Dislocations in A1203/c-ZrO 2(Y203) Specimens .
5.5 D iscussion . . . . 17 22 22 23 39 39 39 46 46 48 54 63 . . . . 63 . . . . 64 . . . . 65 . . . . 65 . . . . 79
6 Dislocation Model of A1203/c-ZrO 2(Y2O3) Steady State Creep 89
6.1 Basic Assumptions . . . . 89
6.2 The Creep Rate . . . . 92
6.3 Distribution of Stresses in the Eutectic A1203/c-ZrO2(Y203) . . . . 95
6.4 Effect of Internal Resistance Variations . . . . 96
6.5 Evaluation of the Creep Model . . . . 101
7 Creep Resistance of Sapphire and Eutectic Ceramics with Doping 106 7.1 Diffusion in Undoped Sapphire and Doped Sapphire . . . . 106
7.2 Creep Resistance of Undoped Sapphire and Doped Sapphire . . . . 111
7.3 Creep Resistance of Eutectic A1203/c-ZrO2(Y203) with Doping . . . . 114
8 Fracture Toughness of Directionally Solidified Eutectic Al20 3/c-ZrO 2(Y2O3)118 8.1 Evaluation by Internal Pore and Surface Flaw . . . . 122
8.2 Evaluation by Crack Deflection . . . . 125
8.3 Evaluation by Open-Crack Shape Analysis . . . . 130
9 Conclusions 137
A Nucleation of a pyramidal edge dislocation in Al203 from other
disloca-tions 140
B The kinematics of creep strain rate by climb 144
C Geometry of RVE for FEM analysis of stress distribution in eutectic
Al20 3/c-ZrO2(Y2O3) 146
D FEM analysis of stress distribution in eutectic A1203/c-ZrO 2(Y20 3) 150
E Diffusion-controlled Climbing Dislocation Velocity 159
List of Figures
1-1 Density vs. melting temperature for various binary compounds. (Fleischer
[1987]) . . . . 18
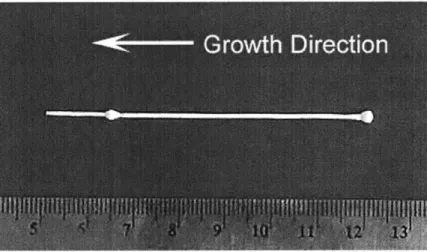
2-1 An as-grown directionally solidified eutectic A1203/c-ZrO 2 specimen fabri-cated by LHFZ, with two buttonhead ends. . . . . 28
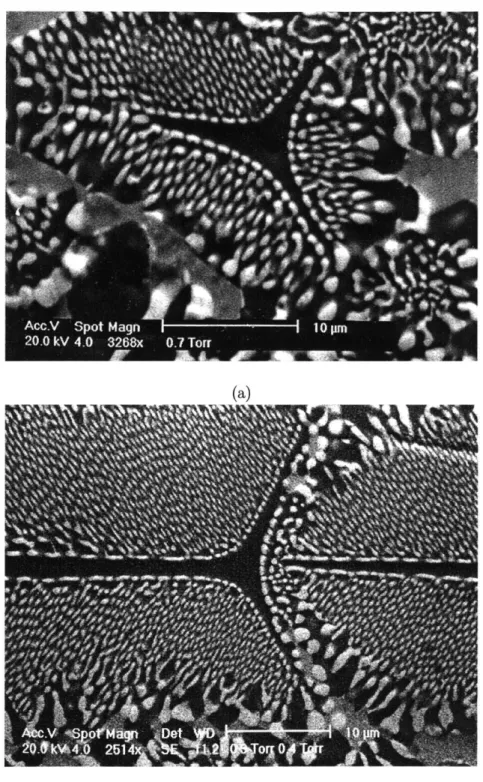
2-2 A typical microstructure of A1203/c-ZrO2(Y20 3) eutectic, (a) transversal
section (b) axial section. . . . . 29
2-3 A higher resolution view of typical microstructure of A1203/c-ZrO
2(Y203)
eutectic, (a) transversal section (b) axial section. . . . . 30
2-4 A lower magnification but with broader overview of the eutectic morphology
on a transversal section of a rod shows clearly the columnar colony structures
in the interior of the rod. . . . . 31
2-5 Element mapping by WDS (Wavelength Dispersive Spectrometry) of a
transver-sal section of A1203/c-ZrO 2(Y203) eutectic, (a) Backscattering electron
im-age (b) Al element area mapping (c) Zr element area mapping (d) Y element
area m apping. . . . . 32
2-6 Growth pores in directionally solidified eutectic A1203/c-ZrO 2(Y203) at (a)
interior (b) surface. . . . . 33
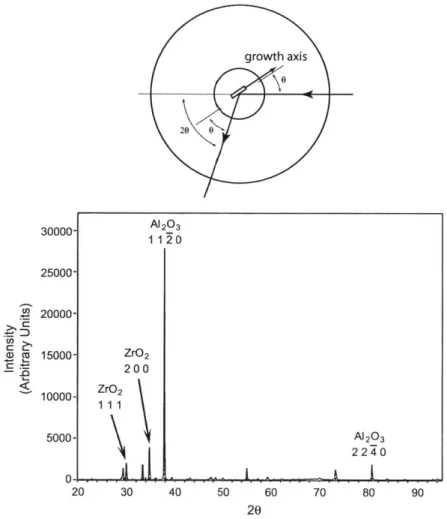
2-7 X-ray diffraction of transversal section of directionally solidified eutectic
2-8 X-ray diffraction of axial section of directionally solidified eutectic Al20 3
/c-ZrO 2(Y 2O 3). . . . . 35
2-9 Phase orientation relationship by electron diffraction of Al203/c-ZrO2(Y
20 3)
(a) transversal section (b) axial section. . . . . 36 2-10 An incoherent interface between A1203 and c-ZrO2 in an A1203/c-ZrO 2(Y203)
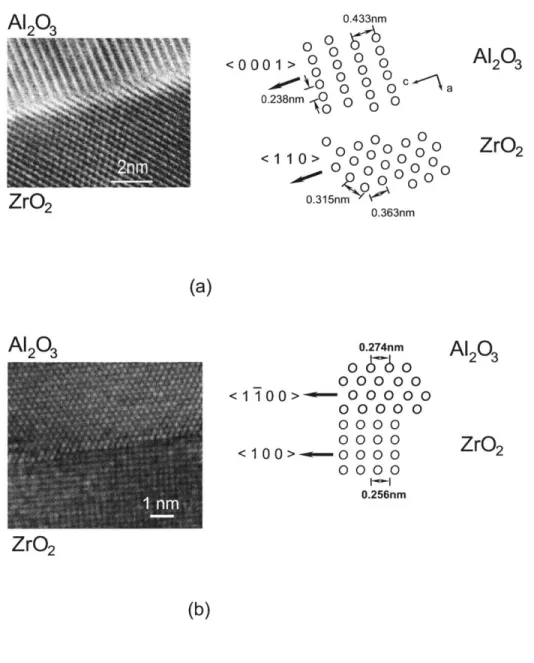
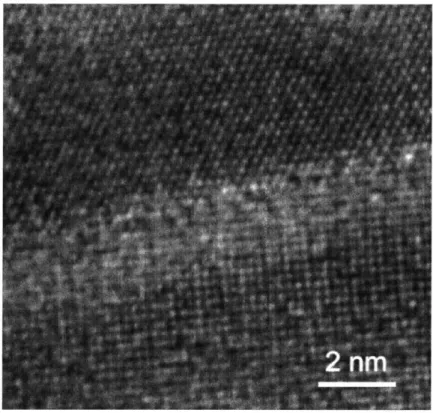
eutectic. (a) axial section (b) transversal section. . . . . 37 2-11 A direct lattice image of a typical interface between A1203 and c-ZrO2 in an
A1203/c-ZrO 2(Y203) eutectic shows an incoherent phase boundary. .... 38
3-1 Tensile creep testing apparatus, with test Configuration B . . . . 42
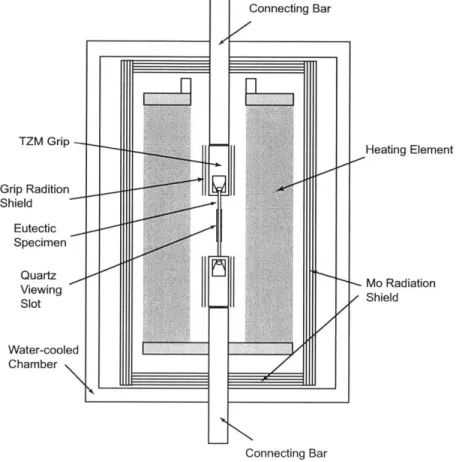
3-2 Test Configuration A having a full-length W mesh heating element and TZM
grip s . . . . . 43
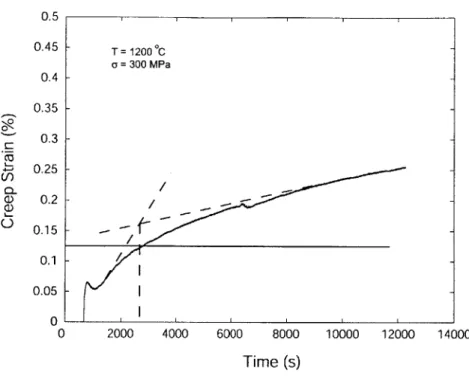
3-3 Test Configuration B having a customized Ta sheet heating element and m etallic friction grips. . . . . 44 4-1 A transient creep strain vs. time curve at 1200 C under a stress of 300 MPa. 47 4-2 A transient creep strain vs. time curve at 1400 C under stresses of 125 MPa,
225 MPa and 275 MPa. . . . . 47
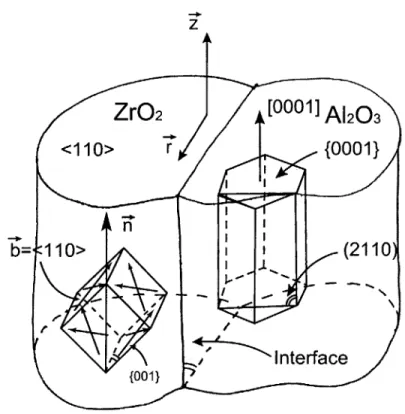
4-3 Schematic drawing of phase orientation relation of Al203 and c-ZrO2 with
the major slip systems in ZrO2 . .. . . . . . . . . . . . 49
4-4 Not well structured colonies in transversal section of A1203/c-ZrO 2. . . . . 51
4-5 A typical creep strain vs. time curve at 1520'C under two different stresses
of 150MPa and 200MPa . . . . 51 4-6 Plots of steady state creep rates as a function of stress for temperatures of
1200, 1400 and 1520'C compared with measurements reported by Sayir and
Farm er [2000]. . . . . 53 4-7 Determination of activation energy of steady state creep from temperature
4-8 As-aged microstructure of superalloy single crystal, present at the beginning of the coarsening experiment. Some degree of precipitate coalescence is evi-dent in the absence of externally applied stresses. (Pollock and Argon [1994]) 56 4-9 Coarsened inhomogeneous microstructure of superalloy single crystal within
an individual sample following the 1050 C and 50MPa stressed coarsening experiment. The plane of the micrograph is parallel to the stress axis, which
is in the vertical direction. (Pollock and Argon [1994]) . . . . 56 4-10 The microstructure of eutectic A1203/c-ZrO 2 specimen tested in 1400 C
without applying stress for different time periods. (a) as-grown; (b) 24 hours;
(c) 72 hours; (d) 168 hours . . . . 59 4-11 The microstructure of eutectic A1203/c-ZrO2 specimen tested in 1400'C
without applying stress for different time periods. (a) as-grown; (b) 24 hours;
(c) 72 hours; (d) 168 hours . . . . 61 4-12 The microstructure of a eutectic A120 3/c-ZrO 2 specimen tested in 1400 C
with 300MPa stress for about 168 hours. (a) low magnification (b) high m agnification . . . . 62 5-1 Crystal structure of sapphire, only filled and empty cation sites are shown;
the anions lying in close-packed layers between the cation layers are not shown. The Burgers vectors of basal, prismatic and pyramidal systems are identified in the figure. . . . . 66 5-2 Dislocations in crept specimen by a basal plane foil in electron bright-field
micrograph at 200kV. The dislocations in this micrograph are discussed in
m ore detail in Fig 5-6. . . . . 69
5-3 Low angle boundary formed between the columnar colonies. The boundary
5-4 Dislocation in basal plane foil of crept specimen. (a) bright field; (b) bright
field with {i210} operating reflection; and (c) bright field with {1120} oper-ating reflection. . . . . 71 5-5 Dislocations in A1203 phase channeling through c-ZrO2 domains. . . . . 72
5-6 Dislocations in basal plane foil of crept specimen (bright-field electron
mi-crograph, 200kV ). . . . . 73 5-7 Dislocations in lower part of Fig 5-6 under operating reflection of {1010}. 74
5-8 Dislocations in lower part of Fig 5-6 under operating reflection of {1120}. 75 5-9 Dislocation in lower part of Fig 5-6 under operating reflection of {2110}. . 76
5-10 A pair of dislocation attached to a phase boundary . . . . 77 5-11 A single segment of dislocation attached to a phase boundary. . . . . 78 5-12 A low angle asymmetrical tilt boundary and the closer view of its upper part. 80 5-13 Another low angle asymmetrical tilt boundary in A1203. . . . 81 5-14 Another low angle asymmetrical tilt boundary in A1203. . . . 82
5-15 High resolution lattice images of A1203 and c-ZrO2 interface where the
ser-rations along the phase interfaces are clearly shown. . . . . 85 6-1 Sketch of a round bar of a A1203/c-ZrO 2 eutectic with z axis parallel to the
[0001] direction of the A1203. The plane at angle
#
outlines a pyramidal glide plane. A local tensile stress o will make a positive edge dislocation climb inthe negative X2 direction. . . . . 94
6-2 Sketches of an idealization of the c-ZrO2 domains as ellipsoidal cylinders in
the topologically continuous Al203 component, for the purpose of a FEM
study of the internal stress distribution in the Al203 when a tensile stress o-,
6-3 Stress distribution results of the FEM study; a) deviatoric (Mises) stresses
in the two components of the eutectic; b) the distribution of the climb stress
u1 in the A1203 . . . . . . . . 99 6-4 Sketch depicting the required contortions that a climbing edge dislocation
need to suffer in bowing through the gaps between the c-ZrO2 domains that
consider to be impenetrable: a) critical climb configuration to bow through
the gap between two c-ZrO2 dispersoids at a spacing A; b) at the point when
the climbing dislocation is just about to pinch off; c) the cusped dislocation
line straightening out under the application of line tension. . . . . 102
6-5 Consequence of the repeated bowing out and straightening of the climbing
dislocation considered as a set of internal resistance o- alternately retarding
and speeding up the climbing dislocation: a) retardation and speeding up
considered as unfavorable and favorable internal stresses -i in the presence
of a climb stress a; b) effect of ai/- on the overall stress exponent m of
the dislocation velocity; c) effect of o-k/o- on the attenuation factor C on the
average climb velocity. (figures reproduced from Li [1968], courtesy of J.
W iley & Sons) . . . . 103 6-6 Plots of steady state creep rates as a function of stress for temperatures of
1200, 1400 and 1520 C. Broken lines represent predictions of creep model for
A1203/c-ZrO 2 at corresponding temperatures. . . . . 105
7-1 Oxygen diffusion data for undoped, MgO-doped and TiO2-doped a-A1203
from Lagerlof et al. [1989], together with data for undoped a-Al2O3 from
other researchers in period 1980-1996. See Heuer and Lagerlof [1999] for
7-2 Plots of steady state creep rates of single crystal sapphire as a function of
stress for temperatures of 1400, and 1500'C. Broken lines represent
predic-tions of creep model for A1203 at 1400'C and 1500'C. . . . . 112
7-3 Steady state creep rate data of eutectic Al203/c-Zr 2 (Fig 6-6) and single
crys-tal A1203 (Fig 7-2) along with the predictions from mechanistic dislocations
m odels . . . . 115
7-4 Secondary Ion Mass Spectrometry (SIMS) map showing the La distribution
in the as-hot pressed 500 p.p.m. La-doped alumina. (Cho et al. [1999]) . . . 117
8-1 Tensile strength of eutectic A1203/c-ZrO 2 from ambient temperature to
el-evated temperature plotted with c-axis sapphire data. (Sayir and Farmer
[2000]) . . . . 121
8-2 Schematic of indentation induced crack system (Sakai and Bradt [1993]) (a)
median (b) median/radial (c) Palmqvist. . . . . 121
8-3 Fracture surfaces of prematurely fractured specimen while applying loading
at test temperature at 1400'C. . . . . 123
8-4 Internal pore (a) and surface flaw (b) observed at prematurely fractured
specim en . . . . 124
8-5 Scanning electron micrographs of 00 sapphire fracture surface during creep
tests at 1800 C. A) Low magnification, entire cross section shown; B) mirror;
C) fine hackle; and D) coarse hackle. (Firestone and Heuer [1976]) . . . . . 128 8-6 Schematic of the fracture surface showing deflection having two characteristic
parameters, A, mean surface wave length and, h, root mean square surface
roughness... ... 129
8-7 Atomic Force Microscopy image of part of fracture surface shown in Fig 8-3b 129 8-8 An indentation made by Vickers indenter with 400g load on the transversal
8-9 Scanning Electron Microscopy micrograph of one crack emanated from the
corner of Vickers indent. . . . . 131
8-10 The non-dimensional open-crack displacement function for an isotropic elas-tic two-dimensional material from Haubensak and Argon [1997]. In this
cal-culation, the application of the point load dipole occurs at r/a = 0.65. . . . 133
8-11 Fracture toughness estimations based on the open-crack shape method (a)
crack0215 (b) crack0202. . . . 135
A-1 Nucleation of a pyramidal edge dislocation from a c-ZrO2 dislocation. . . . 143
C-1 Schematic drawing of c-ZrO2 elliptical fibers in Al203 phase. . . . . 149
D-1 Mises stress distribution under applied stress of 300 MPa at 1400'C (c-ZrO2
fiber aspect ratio = 1). . . . . 151
D-2 Mises stress distribution under applied stress of 300 MPa at 1400 C, and thermal stress caused by the temperature drop from 1875 C to 1400 C
(c-ZrO2 fiber aspect ratio = 1). . . . . 151
D-3 Mises stress distribution under applied stress of 300 MPa at 1400 C (c-ZrO2 fiber aspect ratio = 3). . . . . 152
D-4 Mises stress distribution under applied stress of 300 MPa at 1400 C, and
thermal stress caused by the temperature drop from 1875'C to 1400'C
(c-ZrO2 fiber aspect ratio = 3). . . . . 152
D-5 Mises stress distribution under applied stress of 300 MPa at 1400 C (c-ZrO2
fiber aspect ratio = 4). . . . . 153
D-6 Mises stress distribution under applied stress of 300 MPa at 1400'C, and thermal stress caused by the temperature drop from 1875'C to 1400'C
D-7 Mises stress distribution under applied stress of 300 MPa at 1400 C (c-ZrO2
fiber aspect ratio = 5). . . . . 154
D-8 Mises stress distribution under applied stress of 300 MPa at 1400 C, and thermal stress caused by the temperature drop from 1875*C to 1400 C
(c-ZrO2 fiber aspect ratio = 5). . . . . 154
D-9 Resolved climb stress distribution in pyramidal system under applied stress of 300 MPa at 1400'C (c-ZrO2 fiber aspect ratio = 1). . . . . 155
D- 10 Resolved climb stress distribution in pyramidal system under applied stress of 300 MPa at 1400'C, and thermal stress caused by the temperature drop
from 1875'C to 1400'C (c-ZrO2 fiber aspect ratio = 1). . . . . 155
D-11 Resolved climb stress distribution in pyramidal system under applied stress of 300 MPa at 1400'C (c-ZrO2 fiber aspect ratio = 3). . . . . 156
D-12 Resolved climb stress distribution in pyramidal system under applied stress of 300 MPa at 1400'C, and thermal stress caused by the temperature drop
from 1875'C to 1400'C (c-ZrO2 fiber aspect ratio = 3). . . . . 156
D-13 Resolved climb stress distribution in pyramidal system under applied stress of 300 MPa at 1400'C (c-ZrO2 fiber aspect ratio = 4). . . . . 157
D-14 Resolved climb stress distribution in pyramidal system under applied stress
of 300 MPa at 1400 C, and thermal stress caused by the temperature drop
from 1875'C to 1400'C (c-ZrO2 fiber aspect ratio = 4). . . . . 157
D-15 Resolved climb stress distribution in pyramidal system under applied stress of 300 MPa at 1400'C (c-ZrO2 fiber aspect ratio = 5). . . . . 158
D-16 Resolved climb stress distribution in pyramidal system under applied stress of 300 MPa at 1400'C, and thermal stress caused by the temperature drop
E-1 An edge dislocation lying along the axis of a cylinder and the dislocation line direction being parallel to its axis (Hirth and Lothe [1968]). . . . . 162
F-1 Interactions of three mobile dislocations with one another (Argon [1970]). . 166
F-2 Dependence of strain rate on mobile dislocation density at constant stress
List of Tables
2.1 Phase orientation relationship reported by various investigators . . . .
4.1 Recorded Steady State Strain Rates . . . .
5.1 5.2
6.1
6.2
Shortest Burgers Vectors in A120 3 (Snow and Heuer [1973]) . . . .
Dislocation slip systems in A1203 (Snow and Heuer [1973]) . . . .
Material Properties for Linear Elastic FEM Analysis . . . .
Volume Average Resolved Climbing Stress Acting on Pyramidal System in
A1203. . . . . . .. . . . . . . . . . . .. . . . . . . . . . . . . . . . 27 52 67 67 97 97
8.1 Evaluation of Fracture Toughness by the Size of Internal Pore or Surface Flaw127
8.2 Fracture Toughness Estimation by Vickers Indentation . . . . 136
Chapter 1
Introduction
In high temperature structural applications, such as gas turbines and rocket engines, the
creep resistance remains as the primary screening property for selecting proper structural
materials. Currently structural materials in high temperature service, such as single crystal
superalloys in -y/-y' form, have a service limit of around 1000 C.
As Fleischer [1987] noted, presented in Fig 1-1, to reach beyond the capabilities of the
present set of high-temperature superalloys and some intermetallic compounds, it is
neces-sary to consider other compounds such as oxides, carbides, borides, etc. to reach service
temperatures in the 1400-1600 C range. In this temperature range, especially for those
applications in open air working environment, oxidation resistance becomes another key
criterion. Oxides are the natural choice for their chemical stability in oxidation
environ-ment.
For some time single crystal sapphire fiber with [0001] axis orientation has been
consid-ered as an ideal material for high temperature application (Sayir and Farmer [2000]). In
that orientation, with its principal basal and prismatic systems unstressed, sapphire
sin-gle crystal fibers have remarkable creep resistance in the 1400-1600 C temperature range,
where only the pyramidal slip system is stressed. Early experiments of Firestone and Heuer
MAXIMLM MELTING TEMPERATURE (*F)
2000
4000
5000
6000
3000
MAXIMUM MELTING TEMPERATURE (C)
Figure 1-1: Density vs. melting temperature for various binary compounds. (Fleischer
[1987])
7000
30-20
cc10
CaJ a. 5I 37:
.4.1
---
/~.
4000
I
such sapphire crystals creep entirely by the climb of the 1/3< 1101 > pyramidal edge
dis-locations, with no slip line or stereo-TEM evidence of glide of such dislocations on any of
the possible pyramidal planes available. Those such dislocations are entirely sessile in glide
has now been established in very recent MD simulations of the core structures of these
dislocations (Chang et al. [2003], Bodur et al. [2004]). The stress dependence of the creep
rates of [0001] oriented sapphire crystals and their governing activation energy of oxygen ion
diffusion in Al203 have all been consistent with a pure climb mode of creep (Firestone and
Heuer [1976]). This is extremely rare in the creep of metals, with the only similar occurrence
having been reported by Edelin and Poirier [1973] in similarly oriented Mg crystals.
While oriented sapphire single crystal fibers have advantageous characteristies and have
been considered with diffusion barrier coatings as reinforcing elements in polycrystalline
A1203 matrixes for composite applications (Morgan and Marshall [1995], Lev and Argon
[1995]), the practice has been costly and lacked flexibility. As an alternative to sapphire-fiber-reinforced ceramic composites, a series of directionally solidified ceramic eutectics, consisting largely of an A1203 component together with compatible stable oxides of ZrO2 or YAG combine many of the advantages of sapphire fiber with morphological stability at
elevated temperatures and relative ease of production. Of these the A1203-ZrO2 system
eutectic, with additional Y203 modification to create cubic ZrO2, has received considerable
attention (Sayir [1998]). This eutectic has demonstrated some attractive characteristics.
In the Laser Heated Float Zone (LHFZ)-produced eutectic in the form of fibers or slender
rods, the A1203/c-ZrO 2(Y203)1 eutectics possess a sub-micron scale morphology in which
the majority Al203 phase maintains a topologically continuous form with a remarkably tight
[0001] growth texture (Fraser et al. [2001]). The c-ZrO2 phase, in turn, in various
morpho-logical shapes ranging from aligned fibers or platelets in either well organized colonies or
in less well ordered forms, usually has one narrow dimension in the 0.2pm range, and is 'It is noted in this thesis that about 4.2mol% of Y203 is required to form cubic zirconia in A1203-ZrO2
always fully encapsulated in the Al203 phase. This eutectic has fairly reproducible and
reasonably attractive levels of fracture toughness (Pastor et al. [2001]) and possesses high
quality, nearly coherent interfaces (Mazerolles et al. [1986]).
The eutectics contain significant levels of residual stress at room temperature, resulting
from thermal misfit between the component phases. The Al203 was found to be in a state
uniaxial tension parallel to the axis, at a level of 1.0 GPa, while the c-ZrO2 was in some form
of multiaxial compression, roughly at the same level (Dickey et al. [1999]). Such residual
stresses that decrease in level at elevated temperatures could still be of importance in initial
creep response (Dickey et al. [1999]) where they, however, should be rapidly relaxed with
the onset of steady creep flow.
This thesis research is to examine the creep behavior of directionally solidified eutectic
ceramic of A12 03/c-ZrO 2 in the temperature range of 1200'C-1520'C under various levels
of stress; and to identify the micro-mechanism of its high creep resistance by
Transmis-sion Electron Microscopy (TEM) observations along with a dislocation mechanistic model.
Moreover, a general assessment of the fracture toughness of this eutectic material is
neces-sary to be undertaken to complement its mechanical characteristics.
This thesis is organized in the following structure. A description of material fabrication
and microstructure characterization of directionally solidified as-grown eutectic specimen
are covered in Chapter 2. Chapter 3 and Chapter 4 report the creep experiment apparatus
and creep behaviors of this eutectic material at high temperature under various levels of
stress. The TEM observations of crept specimens are presented in Chapter 5. Based
upon these experimental findings, a mechanistic dislocation model is discussed in detail in
Chapter 6. Chapter 7 summarizes the defect chemistry of different types of doping and their
influences on the diffusion process in sapphire (single crystal a-A 203) and presents the
corresponding creep experiments on sapphire. Its indication to improve the creep resistance
of the eutectic material is discussed. Chapter 8 presents the fracture toughness evaluation
Chapter 2
Directionally Solidified Eutectic
Material: A1
2
0
3
/c-ZrO
2
(Y
2
O
3
)
2.1
Material Fabrication
The eutectic A1203/c-ZrO 2(Y203) have all been produced by the Laser Heated Float Zone
(LHFZ) method at the NASA John Glenn Research Center. This process has been reported
thoroughly by Sayir and Farmer [2000], Argon et al. [2001], and Yi et al. [2004b]. Source rods
were prepared using 99.999% pure polycrystalline A1203 powder (CERAC/pure, Ceralox Corp., Tucson, AZ 08676). These powders were blended in acetone for 70 hours using
high purity Y203 stabilized ZrO2. The slurry was dried, mixed again and formed into
cylindrical rods using cold isostatic pressing. These rods were then sintered at 1500'C
in air for 4 hours. A laser heated float zone (LHFZ) process was used to produce the
directional solidification of rods. The heating source was a coherent C0 2-laser beam
(FH-1500-Carbon Dioxide Laser, PRC Corp., Landing, NJ 0785) split into four beams, 900
apart from each other. Each beam is focused onto the molten zone and converges at the
top surface of a polycrystalline source rod located in the center of the processing chamber.
growth the source rod is moved vertically through the laser beam. The maximum available
laser power is 600 W, but only a small fraction of this power was needed as the radiation
from the C0 2-laser (wavelength= 10.6 pm) is effectively absorbed in the oxides. The molten
zone temperature was measured in the infrared radiation region with an Infrared Thermal
Monitor (Vanzetti Systems, Stoughten, MA 02072) and the output was used to control the
laser power. To initiate directional solidification of the eutectic, a seed of single crystal
sapphire (< 0001 > direction) was lowered onto the molten liquid until wetting occurred.
All growth experiments were conducted in air. Neither the seed crystal nor the source rod was rotated.
These rods were re-used as source rods to produce final samples. The objective of the
second solidification was to minimize the entrapment of the gases at the liquid solid interface.
The directional solidification rate was at 2mm/min for both processes. The directionally
solidified rod had cross-sectional dimensions in the range of 1-1.5 mm in diameter, varying
from rod to rod but showed only small thickness variations along their 200-220 mm length
in any one rod. Some short rods with lengths of 70-80 mm and diameters of 0.5~0.8
mm were also grown initially with buttonhead ends to fit in an earlier design of specimen
holder, as shown in Fig 2-1. Such forms of loading through button-head ends was generally
unsuccessful and results in premature fractures.
2.2
Microstructure Characterization
The directionally solidified eutectic rods were composed of 67% Al203 and 33% c-ZrO2 by
volume. The typical as-grown microstructures, shown in Fig 2-2 and Fig 2-3, where the light
phase, c-ZrO2 and the dark phase, Al203, have well-defined columnar colony microstructure.
Figure 2-4 on a lower magnification but with broader overview of the eutectic morphology
on a transversal section of a rod shows clearly this colony structure in the interior of the
Argon et al. [2001]). The micrographs also show that there are two forms of c-ZrO2 different
considerably in scale. In addition to the quite regular fine fibrillar structure of the c-ZrO2
inside the colonies, there is a coarse scale component located in the colony borders having
less regular shapes. The arrangements of the c-ZrO2 fibrils in the colonies have a clear
3-fold symmetry which is a direct consequence of the stoichiometry of A1203 where in the alternating cation and anion layers normal to the c-axis only 2/3 of the sites in the cation
layers are filled and the lattice of empty cation sites characterizes the basic basal 3-fold
symmetry of the structure. Between the fiber colonies, the symmetry axes are relatively
close to parallel to each other, with misalignments not exceeding ±10", as shown in Fig
2-4. The mean distance A in the A1203, between the c-ZrO2 filaments or platelets that is of
interest for mechanistic consideration in the model for creep resistance is typically between
0.5-2.0prm on the average.
A chemical composition analysis of an as-grown sample rod was conducted by Wave-length Dispersive Spectrometry (WDS) (JEOL JXA-733 Superprobes, JEOL). Fig 2-5 shows
an area mapping of three different elements, Al, Zr and Y, along with its backscattering
electron image. They prove that the light phase in Fig 2-2 is indeed c-ZrO2, while the
dark phase is A120 3. There is also often a certain light-grey phase, which is identified as
Y3A15012(YAG) by the composition ratio, existing along the boundary of colonies. A large amount of YAG found in this analysis is due to a higher-than-necessary ratio of Y203 in
the sample. In the samples with the correct Y203 doping level, the amount of YAG was
insignificant.
An unavoidable level of porosity was found along the center line of many samples, often
with substantial pore dimensions to constitute super-critical flaws for fracture. As shown
in Fig 2-6 (a) and Fig 2-6 (b), these pores always had smooth surfaces indicating they
resulted from inadequate wetting during melting and solidification of the initial charge. In
some instances they resulted in premature fracture after the stress was applied during creep
pre-existing critical cracks. This will be discussed in Chapter 8.
The crystallographic orientations of each phase were examined by x-ray diffraction. Fig
2-7 is an X-ray diffraction of the transversal section of the as-grown sample rod by Dickey [20011. The diffraction on the transversal section shows that there is a strong concentration
of (0001) planes parallel to the transversal section in the A1203 phase; while in the c-ZrO2
phase, the major reflections are the same as the ones from a powder diffraction pattern of
c-ZrO2, which indicates that the c-ZrO2 fibers have multiple orientations like a polycrsytal of
c-ZrO2 with a concentration on (110) planes. Another X-ray diffraction on the axial section
of the as-grown sample rod, shown in Fig 2-8, gives a similar pattern of ZrO2 without
the (110) planes concentration; while the reflections of A120 3 are from the prismatic plane
of Al203 and have a single crystal character. Dickey [2002] has conducted a pole figure
analysis on directionally solidified eutectic A1203/c-ZrO 2. It shows that Al203 has a strong texture of [0001] along the growth axis and c-ZrO2 is highly [110] textured along the growth
axis. These orientation evidences indicate that the topologically continuous majority phase
of A1203 has a nearly perfect growth texture in the [0001] direction and encapsulates the
minority c-ZrO2(Y2O3) phase in a variety of morphologies which has a close to < 110 >
growth texture, regardless of morphology.
Transmission Electron Microscopy (TEM) specimens from randomly spaced axial and
transverse sections were made for conducting electron diffractions to examine the phase
orientation relationship. Fig 2-9 gives the phase relationship between A1203 and c-ZrO2
in both axial and transversal sections. The electron diffraction patterns show strong
[0001]A1203
//
[112 c-ZrO2 and [21i10]A1203/[011
c-ZrO2 reflections. High resolution directlattice images shown in Fig. 2-10 also indicate a relationship in [O0011A12 03 //[110]c-ZrO2
and [1100]A2O3//[100c--ZrO2. Michel et al. [1984] and Mazerolles et al. [1986] have
re-ported same phase orientation relationship. Sayir [1998] found another phase orientation
relationship, [0001]A1203/ 1111 c-ZrO2 and [11
0 0 A1
orienta-2.1. Considering only the crystal plane matching to minimize the corresponding plane
distortion, all these pairs are possible to form semi-coherent phase boundary.
Planar interfaces and curved interfaces can be observed between Al203 phase and c-ZrO2
phase. Extensive observations by TEM indicate that the interface boundary thickness is in
the order of fractions of nanometer or less (a few atomic distances). It should be kept in
mind that these boundaries are viewed in projection, and consequently the actual thickness
of the interface might not be the thickness viewed under TEM micrograph. Two direct
lattice imaging observations, of Fig 2-10, obtained from transversal and axial sections, show
a typical interface that are semicoherent and atomically narrow. Incoherent phase boundary, such as shown in Fig 2-11 also exists in this eutectic material.
Table 2.1: Phase orientation relationship reported by various investigators
Research Group Orientation Relationship Shortest Plane Distancea
(A)
[0001]Al2 O3 //[11]c-ZrO2 2.17A203//6.29ZrO 2 [2110]A1203 //[01 1]c-ZrO2 4-76A203// 3.63ZrO2
Present Research and
[0001]A12 03//[110]c-ZrO2 2.17A203//3.6
3 ZrO2 [1IOO]A12 03 //[100]c-ZrO2 2.7 4A 203//5.14ZrO2 Mazerolles et al. [1986] and Michel et al. [1984] Sayir [1998] [00011A1203 //[010]c-ZrO2 [1IOO]A1203 //[100]c-ZrO2 and [00011A1203
/110]c-ZrO
2[1100]A1
203 //[OOI]c-ZrO2 [0001]A1203 //[11 1]c-ZrO2 [11001A1203 /A 0c-Zr02Al203 are calculated based on the ideal lattice unit cell structure
/5.14ZrO2 /5. 14 ZrO2 /3-63ZrO2 /5. 1 4ZrO 2 /8-90ZrO 2 /3-63ZrO2 2 .1 7AI2o3/ 2-74AI203/ 2.17A1203/ 2 -7 4A12o3/ 2 -1 7A12o3 2 -7 4Al2o3
"The shortest plane distances of
Figure 2-1: An as-grown directionally solidified eutectic A1203/c-ZrO 2 specimen fabricated
(a)
(b)
Figure 2-2: A typical microstructure of A1203/c-ZrO 2(Y2O3) eutectic, (a) transversal
(a)
(b)
Figure 2-3: A higher resolution view of typical microstructure of A12 03/c-ZrO 2(Y203)
Figure 2-4: A lower magnification but with broader overview of the eutectic morphology on
a transversal section of a rod shows clearly the columnar colony structures in the interior
BE 98-33
Zr 98-33
(a) (b)
(C) Y 98-33 (d)
Figure 2-5: Element mapping by WDS (Wavelength Dispersive Spectrometry) of a transver-sal section of A1203/c-ZrO 2(Y2O3) eutectic, (a) Backscattering electron image (b) Al
ele-ment area mapping (c) Zr eleele-ment area mapping (d) Y eleele-ment area mapping.
(
a)
( b)
Figure 2-6: Growth pores in directionally solidified eutectic A1203/c-ZrO 2(Y20 3) at (a)
2w a 20 0 growth axis -1 C C . 1000 500 0 30 40 50 60 220 ZrO2 200 Zro2 111 00.6 311 400 331 420
A10A Zro2 Zro, Zro2 Zro2
Zro A10
70 80
20
Figure 2-7: X-ray diffraction of transversal section of directionally solidified eutectic
(>M -E 30000- 25000- 20000- 15000- 10000- 5000-20 30 40 50 20 60 70 80 90
Figure 2-8: X-ray diffraction of axial section of directionally solidified eutectic A120 3/c-ZrO2(Y203). A1203 ZrO 2 200 Zr02 A1203
I2
240 iiI
IA I growth axis0 00 * .0 0 0 0 U 0 0 0* s 0 o , 000 * 0 0 0 0 o 0 8 0 * ZrO2 1 1 2 o A1203 0 0 0 1
*
ZrO2 0 11 o A120321T0 0Figure 2-9: Phase orientation relationship
(a) transversal section (b) axial section.
by electron diffraction of A1203/c-ZrO 2(Y203)
0 0 * 0 0 0 0 0 0 (a) (b) 0
0.433nm <0001> 0 0 0
0
0
0
0 000 0 0.238nm 0 0 0 00 0000 < 0 000 0-315nm 0.363nm 0.274nm 0 60 00000 <1i00>--*- 000 00 00000 0000 0000 <100>- 0 0 0 0 0000 -I 0.256nm A1 203ZrO
2ZrO
2(b)
Figure 2-10: An incoherent interface between A1203 and c-ZrO2 in an A1203/c-ZrO 2(Y203)
eutectic. (a) axial section (b) transversal section.
A1,
Q
23ZrO
2A1
20
3ZrO
2(a)
A1
20
3Figure 2-11: A direct lattice image of a typical interface between A1203 and c-ZrO2 in an
Chapter 3
Tensile Creep Experiments
3.1
Tensile Creep Specimens
Creep specimen rods directionally solidified by LHFZ in this research had cross-sectional
dimensions ranging from 1.0 mm to 2.0 mm from rod to rod but showed only small diameter
variations along their 200-220 mm length in any one rod. An earlier version of specimens
with buttonhead ends were of 80~100 mm in length and had diameters ranging from 0.5~0.8
mm. These specimens were all used in as-grown condition, without any surface grinding or
other means of surface preparation and without any further heat treatment.
3.2
Tensile Creep Apparatus
The creep experiments were carried out in tension in a lever-loaded creep testing machine
with a high temperature Centorr vacuum chamber (Centorr Vacuum Industries, Nashua, NH 03062), as shown in Fig 3-1. The load was smoothly applied by initially supporting the dead weight loads with a hydraulic jack. After reaching the desired test temperature,
the jack was slowly lowered until the load was fully applied, in a time period of about 15
seconds. All the creep tests were conducted under constant load mode. Since very small
The vacuum was maintained at a pressure in the order of 10-6 torr (1 torr = 1.333224
millibar = 133.3224 Pa) for the purpose of protecting Ta or W heating elements.
There were two different types of heating zone design used in the research, which are
referred here as test Configuration A and test Configuration B.
For test Configuration A, the furnace was equipped with a normal full-length W mesh
heating element produced by Centorr Vacuum Industries, Nashua, NH. The eutectic
spec-imens with buttonhead ends were mounted in slotted TZM grips. The upper and lower
grips were then screwed on water-cooled upper and lower connecting bars of the load train, respectively. The TZM grips were surrounded by two layers of platinum radiation shield
with a gap separating the two layers and the most inner layer from the grips. Considering
the high-vacuum nature in the testing chamber and the low thermal conductivity of
speci-men rod, the heat transfer from heating elespeci-ment to the specispeci-men is dominated by thermal
radiation. Therefore, the water-cooling connecting bar to the grips and radiation shields
were able to create a reasonable large thermal gradient along the specimen rod within the
gripping portion. The creep deformation was then concentrated on the portion of specimen
which is directly exposed to the heating element. Figure 3-2 gives a schematic drawing of
test Configuration A.
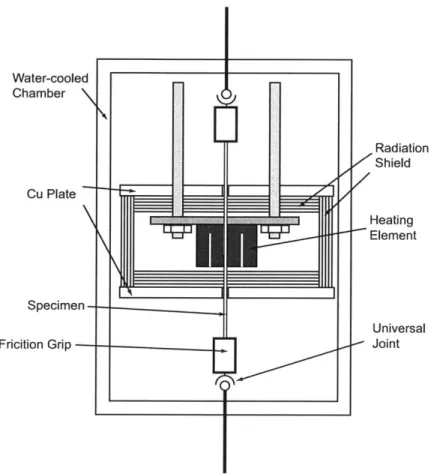
For test Configuration B, the furnace was equipped with a specially designed heating
zone, shown in Fig 3-3, of 50 mm in diameter and 58 mm in length made up of a split
cylindrical configuration of a 1 mm thick Ta sheet with alternating up-and-down slits to
increase the path length of the heating element. The heating zone was surrounded by a
series of Mo radiation shields with gaps separating layers. The long specimens (200~220
mm in length) threaded through the heating zone and were gripped at their ends by metallic
friction grips which had a hinge mechanism to accommodate the uneven shape of the
as-grown rod, clamping down on the ends of the specimens through annealed soft nickel sheets
to avoid high local contact forces on the rods that could have resulted in fracture. The
and lower connecting bars of the load train, respectively. Two relatively massive water
cooled OFHC Cu plates were placed between the two exits of the heating zone and the
specimen grips to assure that the gripping conditions were, as much as possible, at low
temperature not to exceed about 200 C to avoid slippage caused by thermal expansion in
the grips. Since the temperature of the specimen inside the heating zone was higher by
~1200-1300 C above the portions of the sample outside the heating zone and the openings on the radiation shields through which the specimen rod threaded is fairly small, less than
4 mm, the gauge length was taken as the axial extent of the heating zone.
It has been proved that the test Configuration B was able to tolerate the misalignment
caused by the loading train and the non-uniform shape of as-grown specimens very
effec-tively. Because of the brittle nature of this eutectic material, test Configuration B was the
one used in most of the creep experiments in this research. Although Configuration A and
B had different gripping mechanisms, the creep deformation was concentrated in the gauge
section and temperature distribution along the gauge section was uniform in both
configura-tions. Therefore, the creep results generated from both configurations are not distinguished
here.
An optical grade quartz window on the front side of vacuum chamber permitted viewing
the hot specimen through a narrow axial slit in the heating elements to allow direct
measure-ments of the specimen temperature by means of a two-wave-length pyrometer (from Omega
Vanzetti, Sharon, MA.), providing emissivity-independent measurements. In addition to
a control thermocouple inside the heating zone, another thermocouple placed close to the
specimen without physically touching it was used to actually record the steady temperature
in the thermal cavity. The temperature measured by this second thermocouple and that
measured by the pyrometer on the specimen usually agreed quite well. The heating zone
temperature was automatically controlled by a PID controller of the Centorr equipment.
LVDTs
High
Vacuum
Chamber
Test Frame
LVDTs
Weights
Hydraulic Jack
1H111
n
TZM Grip -44 Grip Radition Shield Eutectic Specimen Quartz Viewing Slot Water-cooled Chamber Connecting Bar/
/ Heating Element - Mo Radiation / Shield Connecting BarFigure 3-2: Test Configuration A having a full-length W mesh heating element and TZM
Watercoole Water-cooled Chamber Cu Plate Specimen Fricition Grip ---/
Figure 3-3: Test Configuration B having a customized Ta sheet heating element and metallic friction grips. Radiation Shield
7
// Heating Element Universal - Jointthe measurements, the displacements of the two ends of the load train immediately outside
the vacuum chamber were simultaneously measured by sets of four LVDTs at both the top
and bottom ends of the Centorr chamber. The differences between these two measurements
then corresponded to the extension of the specimen. Strain resolution of 1.4 x 10⁻⁵ was
possible with this system. To evaluate the strain measurement system, a Ni-based superalloy
CMSX-3 sample was tested at 800 C under a stress of 300 MPa. The creep strain measured was very close to that reported by Pollock (1990].
Even under ideal conditions the total creep strain was never too uniquely determinable.
To overcome this difficulty all creep strains at steady state were always measured
incre-mentally at a given temperature under two different applied stresses and often as loading
and unloading cycles. This practice of relative measurements of creep strain did not only
give more reliable determinations of the strain rates at the two different levels of stress but
also demonstrated the nearly complete absence of transients in such incremental changes
in steady state creep. A typical response of this type is shown in Fig. 4-5 for creep at
1520'C at stress levels of 150MPa and 200MPa. The random-appearing irregularities on the creep curves in Fig. 4-5 were attributed to be of instrumental origin. When determining
actual increments of creep strain in any interval of time these variations were operationally
Chapter 4
Creep Behavior of
Al
2
0
3
/c-ZrO
2
(Y
2
0
3
)
4.1
Transient Effects
Upon initial application of stress to a virgin specimen a strain transient was always observed.
One such transient recorded during an experiment at 1200'C under a stress of 300 MPa with
test Configuration A is shown in Fig. 4-1. There is a strain overshoot at the initial stage
of loading, followed by a short incubation period. These two phenomena are more clearly
shown in a test with test Configuration B at 1400'C under a series of stresses of 125 MPa, 225 MPa and 275 MPa shown in Fig. 4-2, where in the early stage of creep experiment, under applied stresses of 125 MPa and 225 MPa, the strain decreasing is appeared; while
for the later stage, under applied stress of 275 MPa, the strain decreasing is almost not
happened.
The characteristic time constant of the transient in Fig 4-1 decreased with increasing
temperature, e.g. from c.a. 3.4 x 10³sec at 1200 C to 200 sec at 1400 C. The usual
explana-tion of the transient to be due to initial work hardening in the creeping components prior to
met-0.5 0.45 0.4 k 0.35 k 0.3
F
0 2000 4000 6000 8000 10000 12000 14000 Time (s)Figure 4-1: A transient creep strain vs. time curve at 1200'C under a stress of 300 MPa.
I---0
a
CD 0.35 0.3 0.25 0.2 0.15 0.1 0.05 0 0 0.2 0.4 0.6 0.8 1 1.2 1.4 1.6 1.8Time (s)
2 X10Figure 4-2: A transient creep strain vs. time curve at 14000C under stresses of 125 MPa, T =1200 0C a = 300 MPa 10 a/) ca-C-) 0.25 0.2 0.15 0.1 0.05 -0 14009C - 225 M Pa 125
MPa-als, was discounted here since no prominent transients were found following stress increases
at steady state creep. The most likely cause of the transient was the rapid stress relaxation
in the coarse c-ZrO2 component by creep since for the measured texture of that component
there is an abundance of the < 110 >
{100}
principal slip systems that are well oriented for slip, as shown in Fig 4-3 of the loading direction. Moreover, the creep resistance of c-ZrO2 in this temperature range is known to be poor (Messerschmidt et al. [1998]). In more ideal morphologies, as presented in Section 2.2, the coarse component of the c-ZrO2 is located oncolony borders. In the usual less ideal morphologies where fibrillar c-ZrO2 is still aggregated
but does not form well structured colonies the coarse fraction was found to be less regularly distributed (see Fig. 4-4). An upper bound estimate of this effect could be assessed from a Finite Element (FEM) study that will be presented in Section 6.3 where it was found that for the complete relaxation of the deviatoric stresses in the entire c-ZrO2 phase the
volume average deviatoric stresses as well as mean normal stresses in the Al203, increase
roughly by 25-30% which would result in an increment of additional elastic strain in the sample of about 6 x 10⁻⁴. This level is illustrated in Fig. 4-1 by the horizontal line. The
actual amount of stress relaxation in the c-ZrO2, however, is difficult to determine since a
substantial fraction of this component has phase dimensions in the range of 0.2-0.4pm and is likely to be dislocation-free and incapable of plastically deforming (as will be discussed in Chapter 6). These, and the difficulties in determining the absolute measures of strain derived from the heating zone portions of the specimen requires the de-emphasizing of this portion of the creep response.
4.2
Steady State Creep
As already mentioned in Section 3.2 the main information on steady state creep was ob-tained from incremental experiments of sudden stress increases and decreases at constant
z
Zr02
[0001]
A1203
<110> r {0001}
b= C110>
(2110)
Figure 4-3: Schematic drawing of phase orientation relation of Al203 and c-ZrO2 with the
-magnitude of the instantaneous stretches or contractions for stress increases or decreases, utilizing the appropriate information on the temperature dependent Young's modulus of
Al203 (Wolfenden, Wolfenden [1997]) gave in all cases that the recorded jumps were all
about a factor of 2 larger than what could be expected from the sample in the heating zone.
Since this was well within the additional flexures and relaxations in the loading train the
recorded strain rates were considered to be reliable.
Utilizing test Configuration B, several determinations of steady state creep rate were
successfully made, all together at 3 temperatures of 1200, 1400, 1520 C at stress levels
ranging from 150MPa to 275MPa, derived from incremental experiments similar to those in
Fig. 4-5. These measurements are listed in Table 4.1 and are plotted in Fig. 4-6 together
with the creep rates at 1400'C due to Sayir and Farmer [2000], also quoted in Sayir [1998]a.
The stress exponents of the creep rates at 1400'C and 1520'C, shown in Fig. 4-6, are 4.16
and 5.38 and are lower than that of Sayir at 6.00. As discussing in the creep model in
Section 6.2, these exponents are relatively high and need to be explained.
Table 4.1 contains also sufficient information for the determination of the activation
energy of the governing creep process. The plot of the creep rates at a stress of 200MPa for
three temperatures of 1200 C, 1400 C and 1520 C in Fig. 4-7 gives an activation energy of
Q
= 299 kJ/mol for the rate controlling process in steady state creep which is considered to be due to oxygen ion diffusion which is known to be the slowest species in A1203. It is certainly
lower than the activation energy in single crystal c-ZrO2 governing its creep process, which
is range from 539 to 857 kJ/mol from 1300'C to 1800'C compiled by Messerschmidt et al.
[1998]. The value from eutectic is to be compared with 311 kJ/mol at 114 MPa and 340 kJ/mol at 75 MPa for 0' sapphire, both from 1600'C to 1800'C, measured by Firestone
and Heuer [1976]. It also can be compared with 441 kJ/mol for temperatures above 1400 C
and 109 kJ/mol for temperatures below 1400 C for the same process measured by Oishi
aThe higher creep rates and the larger exponents in these early investigations are most likely a result of not reaching steady state but still being in a late stage of transient behavior.
Figure 4-4: Not well structured colonies in transversal section of A1203/c-ZrO 2. x103 3.5 3.0 0-2.5 2.0 1.5 1.0 C 0.5 1.0 1.5
Time (s)
2.0 2.5 5 x 10Figure 4-5: A typical creep strain vs. time curve at 1520'C under two different stresses of
200 MPa
200 MPa
Table 4.1: Recorded Steady State Strain Rates
Stress (MPa) Strain Rate (sample
#)
(sec-1) average rate (sec-1)12000 C 200 1.97 x 10⁻¹⁰ (142-18) 1.97 x 10⁻¹⁰ 14000 C 200 3.6 x 10⁻⁹ (187-29) 3.6 x 10⁻⁹ 225 2.26 x 10⁻⁹ (187-27-2); 8.16 x 10⁻⁹ (187-27-1) 5.21 x 10⁻⁹ 250 5.53 x 10⁻⁹ (187-29) 5.53 x 10⁻⁹ 275 9.95 x 10⁻⁹ (187-27-2); 1.10 x 10⁻⁸ (187-27-1) 1.05 x 10⁻⁸ 15200 C 150 1.57 x 10⁻⁹ (142-16); 4.40 x 10⁻⁹ (142-16) 2.98 x 10⁻⁹ 200 1.20 x 10⁻⁸ (142-16); 1.60 x 10⁻⁸ (142-16) 1.40 x 10⁻⁸
10 4
* Sayir (1400 C)
-s5 1520C
6.0
1
0 1400 C
o 1200 C 10 0m=5.38
108 -< m=4.16 10 1 0-10 i i i l 100 200 300 400Stress, MPa
Figure 4-6: Plots of steady state creep rates as a function of stress for temperatures of 1200, 1400 and 1520'C compared with measurements reported by Sayir and Farmer [2000].
![Figure 1-1: Density vs. melting temperature for various binary compounds. (Fleischer [1987]) 30- 700020cc10CaJa.5I37:.4.1---/~](https://thumb-eu.123doks.com/thumbv2/123doknet/14517954.530873/18.918.261.634.291.773/figure-density-melting-temperature-various-binary-compounds-fleischer.webp)