HAL Id: cea-02614708
https://hal-cea.archives-ouvertes.fr/cea-02614708
Submitted on 21 May 2020HAL is a multi-disciplinary open access
archive for the deposit and dissemination of sci-entific research documents, whether they are pub-lished or not. The documents may come from teaching and research institutions in France or abroad, or from public or private research centers.
L’archive ouverte pluridisciplinaire HAL, est destinée au dépôt et à la diffusion de documents scientifiques de niveau recherche, publiés ou non, émanant des établissements d’enseignement et de recherche français ou étrangers, des laboratoires publics ou privés.
Rivers
O. Evrard, Fabien Pointurier, Yuichi Onda, Caroline Chartin, Amélie Hubert,
Hugo Lepage, Anne-Claire Pottin, Irène Lefevre, Philippe Bonté, J. Patrick
Laceby, et al.
To cite this version:
O. Evrard, Fabien Pointurier, Yuichi Onda, Caroline Chartin, Amélie Hubert, et al.. Novel Insights into Fukushima Nuclear Accident from Isotopic Evidence of Plutonium Spread along Coastal Rivers. Environmental Science and Technology, American Chemical Society, 2014, 48 (16), pp.9334-9340. �10.1021/es501890n�. �cea-02614708�
Novel insights into Fukushima nuclear accident from isotopic evidence of plutonium spread along coastal rivers
Olivier Evrard1*, Fabien Pointurier2*, Yuichi Onda3, Caroline Chartin4, Amélie Hubert2, Hugo Lepage1, Anne-Claire Pottin2, Irène Lefèvre1, Philippe Bonté1, J. Patrick Laceby1, Sophie Ayrault1
1 Laboratoire des Sciences du Climat et de l’Environnement (LSCE/IPSL), Unité Mixte de Recherche 8212 (CEA/CNRS/UVSQ), 91198 Gif-sur-Yvette Cedex, France.
2
CEA, DAM, DIF, 91297 Arpajon, France. 3
Center for Research in Isotopes and Environmental Dynamics, University of Tsukuba, Tsukuba 305-8572, Japan.
4
George Lemaître Centre for Earth and Climate Research, Earth & Life Institute, Université catholique de Louvain, Louvain-la-Neuve, Belgium.
(*) Corresponding authors (email addresses: olivier.evrard@lsce.ipsl.fr and fabien.pointurier@cea.fr).
Abstract
The Fukushima Dai-ichi Nuclear Power Plant (FDNPP) accident led to important releases of radionuclides into the environment, and trace levels of plutonium (Pu) were detected in
northeastern Japan. However, measurement of Pu isotopic atom and activity ratios is required to differentiate between the contributions of global nuclear test fallout and FDNPP emissions. In this study, we used a double-focusing sector field ICP-MS to measure Pu atom and activity ratios in recently deposited sediment along rivers draining the most contaminated part of the inland radioactive plume. Results showed that plutonium isotopes (i.e., 239Pu, 240Pu, 241Pu, and 242Pu) were detected in all samples, although in extremely low concentrations. The 241Pu/239Pu atom ratios measured in sediment deposits (0.0017–0.0884) were significantly higher than the corresponding values attributed to the global fallout (0.00113±0.00008 on average for the Northern Hemisphere between 31°-71°N, Kelley, J.M.; Bond, L.A.; Beasley, T.M., Global distribution of Pu isotopes and 237
Np, Sci. Total. Env., 1999, 237/238, 483-500). The results indicated the presence of Pu from FDNPP, in slight excess compared to the Pu background from global fallout that represented up to ca. 60% of Pu in the analyzed samples. These results demonstrate that this radionuclide has been transported relatively long distances (∼45 km) from FDNPP and been deposited in rivers representing a potential source of Pu to the ocean. In future, the high 241Pu/239Pu atom ratio of the Fukushima accident sourced-Pu should be measured to quantify the supply of continental-originating material from Fukushima Prefecture to the Pacific Ocean.
Introduction
The Fukushima Daiichi Nuclear Power Plant (FDNPP) accident that affected the northeastern part of Japan in March 2011 has led to the largest release of anthropogenic radionuclides into the
environment since the Chernobyl accident in 1986. Both accidents were rated 7, the maximum on the International Nuclear and radiological Event Scale (INES). Nevertheless, the total quantities of radionuclides emitted during the Fukushima accident are estimated to correspond to 10 to 15% of Chernobyl emissions1. The emitted radionuclides mainly consisted of volatile substances, i.e.133Xe,
132
Te, radioiodine and radiocesium. However, semi-volatile and low-volatile radionuclides (e.g., 95Nb, 103
Rb) were also detected in the atmosphere after the accident, indicating the likely occurrence of core melting at FDNPP2. A broad meltdown of reactor cores was also suggested by modeling studies relying on radionuclide records available from International Monitoring System (IMS) of the
Comprehensive Nuclear Test-Ban-Treaty Organization3.
Most studies that aimed at identifying the emitted radionuclides and tracking their fate in the environment focused on gamma-emitting substances, particularly 134Cs and 137Cs, because of their high abundance and their relatively long half-lives4. These substances mainly represent a risk for external exposure of local populations and biota. The presence of alpha-emitters and particularly of long-lived plutonium isotopes would present an additional risk for internal exposure5. Although the literature is conflicting on the potential volatilization of actinides in the physico-chemical conditions that prevailed at FDNPP6, the presence of plutonium with 238Pu/239+240Pu activity ratios significantly higher than the ratio measured from plutonium global fallout (~0.037,8) in the region was
demonstrated in six soil samples analyzed under the authority of MEXT9. Moreover, two recent studies10,11 showed that the average of these measured 238Pu/239+240Pu activity ratios in surface soils at the source correlated well with the model estimates of the spent-fuel inventory from reactors Units 1 and 3, and thus concluded that plutonium was released into the local environment during the venting of these reactors. Plutonium is generally produced in reactor fuel as a mixture of isotopes, among which a dominance of 239Pu (T1/2 = 24 100 years) is generated by neutron capture in
238 U and subsequent β-decay. When fuel elements containing 239Pu are left in the reactor, they are exposed to further neutron capture, and isotopes with higher mass, i.e. 240Pu (T1/2 = 6560 years), 241Pu (T1/2 = 14.325 years), and 242Pu (T
1/2 = 3.76 × 10⁵ years), are produced14. Several authors6,10,12 provide estimations of the Pu isotopic activities present in the nuclear fuel of FDNPP reactors and spent fuel storage pools (SFSPs) at the time of the accident. Based on those estimations, it is possible to reconstruct the isotopic composition of the Pu that was potentially emitted by the three damaged reactors and the SFSPs. Zheng et al.13 also provide estimation of the released Pu isotopic composition from an analysis of litter and surface soil samples. The Pu isotopic ratios characteristic of the three damaged reactors at the time of the accident documented in those studies are compiled in Table S1. As plutonium isotopic atom and activity ratios provide a powerful tool to quantify those sources and to discriminate between plutonium originating from various past nuclear atmospheric weapon tests (referred to as ‘global fallout’) and local fallout characterized by significantly different signatures, it is of obvious interest to measure as many Pu isotopic abundances as possible with the highest
achievable precision. To this end, the use of mass spectrometry techniques (TIMS or ICP-MS) can provide a more detailed isotopic picture of the Pu detected in the analyzed samples than standard alpha spectrometry techniques, which are not able to differentiate between 239Pu and 240Pu, nor to measure 241Pu14. Furthermore, analytical techniques associated with very low detection limits (like for instance sector-field ICP-MS) should be used, as the presence of 239+240Pu in very low activity concentrations (typically in the tens of mBq/kg to the Bq/kg range) had been reported in the few available studies conducted in the Fukushima Prefecture by 201314,15. Several Pu isotopic
measurements conducted on soil samples collected in the vicinity of Fukushima using mass spectrometry have already been published, and 240Pu/239Pu, 241Pu/239Pu and 241Pu/239+240Pu ratios higher than the global fallout signature were measured by ICP-MS in one soil and two litter samples collected within the 20 to 30 km zone around FDNPP15. Furthermore, a 240Pu/239Pu ratio higher than the global fallout value was found in a river water sample collected in Abukuma River16. A recent
study based on measurements of 238Pu/239+240Pu activity ratio in soils combined with analysis of 240
Pu/239Pu atom ratio in a set of nine roadside dust samples (associated with radioactive dose rates higher than 100 µSv h-1 measured at contact, and referred to as ‘black substances’ by the authors) and litter samples demonstrated the presence of Pu of FDNPP-origin in material collected in the vicinity of the power plant (i.e., in Futaba, Namie, Okuma municipalities) as well as in Iitate-Mura and Minamisoma City (i.e., outside of the 20-km exclusion zone, to the northwest of FDNPP)17. In contrast to observations made on the continent, Pu originating from Fukushima FDNPP was not detected in the marine environment19,19.
However, the fate of this plutonium in the environment remains poorly documented. As recent publications demonstrated the spread of Fukushima fallout from the main inland contamination plume including Iitate-Mura and Minamisoma City to the Ocean20.21, we use cutting-edge analytical techniques to document the presence of Pu and measure the Pu isotopic abundances and
concentrations of four plutonium isotopes (239Pu, 240Pu, 241Pu, and 242Pu) in recently deposited riverbed sediment collected along rivers draining the most contaminated part of the inland radioactive plume. This study will thereby provide crucial clues on the origin and the fate of
plutonium in coastal catchments that were the most affected by the initial radioactive fallout, which may possibly represent a perennial source of plutonium to the Pacific Ocean during the next decades.
Methodology
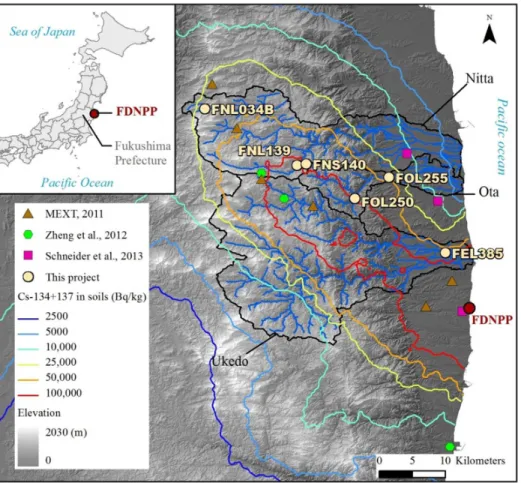
Study area and sampling. Fieldwork was conducted in the accessible parts of the Nitta R., Ota R. and
Ukedo Rivers draining the main radioactive pollution plume between November 2011 and May 2013 (Fig. 1). Their catchments, covering respectively 271, 79 and 425 km², are dominated by steep forested slopes in upstream mountainous parts (up to 1000 m elevation), and by paddy fields and built-up areas in valley bottoms and coastal plains20. Fine sediment that appeared to have recently deposited (i.e., mud drapes on channel-bed sand) was collected along these three rivers. An additional soil sample was taken in the vicinity of the most contaminated sediment sample to allow for comparison.Samples were dried in an oven at 40°C for 72 h, sieved to 2 mm, ground to a fine powder using an agate mortar and stored at room temperature before analysis. Details on the field sampling campaign and strategy are given in a previous publication20. For this study, we selected samples to document the Pu contamination of fine sediment deposits along each of the rivers draining the main radioactive contamination plume.
Gamma spectrometry. Radionuclide activities (134Cs, 137Cs, 110mAg) in all samples were determined by gamma spectrometry using very low-background HPGe detectors. All gamma radionuclide activities were expressed in Bq per kg of dry weight (Bq kg-1). Counting time of soil and sediment samples varied between 8 x 10⁴ and 200 x 104 s to allow the detection of 110mAg, which was present in much lower activities in the samples (2–2390 Bq kg-1) compared to 134Cs and 137Cs (500–1,245,000 Bq kg-1). Six samples were selected for further Pu analyses because of their high activities in both 134+137Cs and 110m
Ag.
Sample preparation and purification procedure for plutonium analysis. ∼5 gram-aliquots of each
furnace to decompose organic matter. During heating, beakers were covered with watch glasses to prevent cross contaminations. After cooling to room temperature, limited amounts of 244Pu (∼100 fg) were added to the samples as isotopic dilution tracer for plutonium quantitative analysis. The stock solution of ∼1 pg·g-1 used for spiking was prepared by gravimetric dilutions of the mother solution prepared from NBS 131 Certified Reference Material (New Brunswick Laboratory, Argonne, IL, USA). Then, ashes were leached on hot plates with strong acid media in five successive steps: first leaching with fuming HNO3 (30 ml), evaporation to dryness, second leaching with fuming HNO3 (30 ml), evaporation to dryness, third leaching with fuming HNO3 (30 ml) and H2O2 (1 ml), evaporation to dryness, fourth leaching with concentrated HCl (30 ml), evaporation to dryness, fifth leaching with 4M HCl (50 ml), evaporation to dryness. Samples were not fully digested. At each leaching step, solutions were back flow heated (120-150°C) for several hours and then evaporated to dryness. All acids used were of analytical grade. Samples were filtered using single-use 0.45 µm analytical filter units (Thermo Scientific, Rochester, NY, USA). Plutonium in the soil and sediment samples, and especially the plutonium possibly released by the FDNPP, was assumed to be present in the dissolved fractions. Therefore, only the dissolved fractions of the samples were further processed. Dissolved fractions were then evaporated to dryness and recovered with 30 ml of concentrated HNO3. Adjustment and redox state stabilization of Pu at +IV oxidation state were performed by addition of small amounts of NaNO2 followed by evaporation. Samples were recovered with 30 ml of 8N HNO3 just before introduction into the conditioned ion-exchange resin columns. It should be noted that three process blanks were prepared in the same conditions as the samples. No Pu isotopes were detected in the process blanks.
A first Pu purification was performed with a 20-ml column filled with Dowex AG1X8 anion-exchange resin (10 ml of 50/100 mesh resin at the bottom and 10 ml of 100/200 mesh resin on the top) rinsed twice and conditioned with 8M HNO3. Further Pu purification is obtained by using a 2 ml-column filled with Dowex AG1X4 anion-exchange resin (100–200 mesh). Both resins are washed with 8 M HNO3 (U fraction elution), 10 M HCl (Th fraction elution) and, finally, with NH4I (1.5%) – 12 M HCl solution prepared just before use to elute Pu fraction. Final solutions were evaporated to dryness and recovered with 3 ml of 2% HNO3 which is the suitable media for ICP-MS measurement. Global Pu recoveries reached an average of ∼45% (between 35% and 57% depending on samples).
Mass spectrometry for Pu atom ratio and concentration measurements. Pu isotopic composition
and concentrations were measured with a double-focusing sector field ICP-MS (“Element XR”, Thermo-Scientific, Bremen, Germany). The separation of the isotope ion beams is carried out through a double-focusing arrangement, both in angle and energy, by means of an electrostatic sector followed by a magnetic sector. This instrument is equipped with the “jet interface” option, composed of a desolvating module (“Apex”, ESI, Omaha, NE, USA), high efficiency cones, and a higher capacity primary pump that decreases vacuum in the interface. This option provides increase in sensitivity by a factor of ten compared to the standard configuration of the instrument (i.e. ∼4×10⁷ counts s-1 per µg L-1 versus ∼4×10⁶ counts s-1 per µg L-1 for the standard configuration). Instrumental background is typically ∼0.3±0.2 count s-1 in the actinide mass range.
The performance of the instrument is daily optimized with respect to sensitivity, short term stability (10 minutes) and background. The instrument is operated in electric scanning by varying the accelerating voltage, with the intensity of the magnetic field set to a fixed value. A Teflon
micro-concentric nebulizer (“PFA100”, ESI, Omaha, NE, USA) was used for sample introduction into the “Apex” desolvating device.
In order to reach high accuracy for isotopic ratio determinations, instrumental mass bias – due to variations in the transmission efficiencies of ions of different masses in the instrument – had to be carefully corrected22. This is done by standard bracketing of samples with diluted solutions of NBS U005 (New Brunswick Laboratory, Argonne, IL, USA) and IRMM-184 (IRMM, Geel, Belgium) isotopic standards. The mass bias per mass unit (ε) is determined according to the linear function:
(
R
certifiedR
measured−
)
∆
m
=
1
/
ε
, where ∆m is the mass difference between the isotopes of interest. During the analyses, great care must be taken to avoid contamination and memory effects. As a rule, the glassware, the sampler and skimmer cones must be regularly and carefully cleaned to ensure the lowest background and the best sensitivity and stability. Moreover, the “Element XR” ICPMS is located in a clean room, class 1000, to avoid contamination when handling of the samples. Rinsing blank periods, intended to suppress any memory effect and to avoid cross-contamination by the sample probe, separated the sample measurements. Raw signals were systematically corrected for mass bias, tracer isotopic impurities, peak tailing and 238U hydrides. In order to obtain the most accurate measurement results, raw signals are corrected for polyatomic interferences (mainly PbO2, IrO3, and HgAr) that interfere with Pu isotopes23,24. Uncertainty calculations followedrecommendations from the Guide to the expression of Uncertainty in Measurement25. Relative standard uncertainties ranged from 3% to 5% for the 240Pu/239Pu ratios, from 6% to 17% for the 241Pu/239Pu ratios, and from 12% to 48% for the 242Pu/239Pu ratios
Results and discussion
Measured activities for plutonium isotopes, 137Cs and 110mAg are compiled in Table 1, while measured atom ratios and mass concentration for plutonium are given in Table 2. All measured plutonium isotopes (239Pu, 240Pu, 241Pu, 242Pu) were detected in the entire set of samples, although in low activities. Figures 2, 3 and 4 show respectively 241Pu/239Pu versus 240Pu/239Pu atom ratios, 242Pu/239Pu versus 240Pu/239Pu atom ratios, and 241Pu/239Pu versus 242Pu/239Pu atom ratios. Moreover, Pu
measurements conducted on soil samples from 54 locations around the world and reported in the literature7,14,26 are also plotted on these graphs. These measurements provide a global baseline for identifying inputs of non-global fallout Pu. All 241Pu/239Pu ratios were corrected for radioactive decay to the reference date of 15 March 2011, using a half-life of 14.325 years27.
240
Pu/239Pu atom ratios. Many studies characterised the Pu content in soil samples due to global
fallout associated with the nuclear tests. They showed that isotopic signatures in soils are not uniform, and that variations may be observed depending on distance from nuclear test sites, proportion of stratospheric / tropospheric debris, location in the Southern or Northern hemisphere, etc. As shown in the literature26, even samples collected at the same time and at the same location show significant heterogeneities that may be attributed to different amounts of the tropospheric fallout component (the 240Pu/239Pu signature for tropospheric fallout does usually not exceed half that of stratospheric fallout). In this context, fallout isotopic signatures are better represented by “mixing lines”, rather than by averages26. This allows for a better depiction of regional variations of stratospheric fallout inventories compared to tropospheric fallout inventories. The lowest and
highest 240Pu/239Pu ratios amount respectively to ∼0.062 (Eureka, Nevada, USA – an area close to the Nevada Test Site) and ∼0.205 (Punta Arenas, Chile)26. The average 240Pu/239Pu atom ratio for the Northern hemisphere is 0.176±0.007 (standard-uncertainty, 1 SD). Regarding Japan, several authors published values representative of the global fallout in Japanese soils. Kelley et al.26 reported 240
Pu/239Pu of respectively 0.1755±0.0024 and 0.1765±0.0022 in two soil samples from Tokyo and Sapporo. Muramatsu et al. (2003) also reported 240Pu/239Pu atoms ratios measured in Japanese forest soils and they ranged from 0.155±0.003 (1 SD) to 0.194±0.005 (1 SD) (average value 0.176±0.011, 1 SD) with an extremely low value of 0.037±0.002 for a sample collected at Nagasaki28, a ratio lower than the lowest ratio of 0.062 measured in a soil sample from Eureka (Nevada, USA). Zhang et al.29measured a ratio of 0.1922±0.0044 in a composite reference material prepared from soil samples collected at 14 stations in Japan between 1963-1979. In the sediments of the Western North Pacific and its marginal seas, 240Pu/239Pu atom ratios ranging from 0.15 to 0.28 were measured before the FDNPP accident18,19. Average Pu ratios in the Northern Hemisphere and Pu ratios measured for Japanese soils due to global fallout are also reported in Table S2. However, since the FDNPP accident, several authors measured 240Pu/239Pu atom ratios significantly higher than the global fallout ratios. Values comprised between 0.286 and 0.365 were measured by Yamamoto at al.17 in radioactive roadside dust samples collected in the same area. It appears from Figures 2 and 3 that for all of the samples but FNL 034B, 240Pu/239Pu atom ratios measured in this study (red plan circles) are not significantly different from the published global world baseline for fallout Pu (blue empty circles). Actually, 240Pu/239Pumeasured in this study in 5 out of the 6 samples collected in the vicinity of Fukushima are comprised between 0.150 (FOL 250) and 0.203 (FOL 255) (Table 2). Sample FOL 250 shows a significantly lower 240Pu/239Pu atomic ratio than the average ratio reported in soils of the Northern hemisphere and in Japanese soils analyzed before the accident (see excerpt in Fig. 2).
241
Pu/239Pu and 242Pu/239Pu atom ratios. Only a few values are available regarding the 241Pu/239Pu and 242
Pu/239Pu atom ratios due to global fallout (see Table S2). Average values for the Northern Hemisphere is 0.00113±0.00008 (1 SD) for the 241Pu/239Pu atom ratios and 0.00387±0.00071 (1 SD) for the 242Pu/239Pu ratios26. In contrast, 241Pu/239Pu atom ratios measured in the 6 samples analyzed in this study (0.0017 – 0.0884) were systematically higher than the corresponding atom ratios
attributed to the global fallout (Fig. 2 and 4). This demonstrates that the 241Pu/239Pu atom ratio is a much more sensitive indicator of the presence of Pu from nuclear spent fuels like the ones
originating from FDNPP than the 240Pu/239Pu ratio. Actually, most of the 241Pu from the global fallout plutonium has disappeared because of its relatively short radioactive period (14.325 years). To a lesser extent, the 242Pu/239Pu atom ratio is also a valuable indicator of FDNPP-derived Pu (see Figures 3 and 4). Even though the 242Pu/239Pu ratios measured in this study have fairly large uncertainties, most of them (with exception of FNS 140 and FOL 250) are higher than the global fallout signature and corresponding ratios measured in Japanese soils26.
Origin and fate of the detected Pu. Overall, our results demonstrate that Pu isotopic compositions
similar to the ones found in roadside dust samples outside the 20-km exclusion zone in Iitate-Mura and Minamisoma municipalities17 could also be measured in fresh riverbed sediment deposits. They confirm that Pu originating from FDNPP could be transported relatively long distances from the damaged power plant and is already being supplied to coastal rivers, thereby representing a
potential source of Pu to the Ocean (Fig. S1). In the main radioactive contamination plume where the highest radiocesium activities were found, the highest plutonium concentrations were measured, i.e. in samples FNS 140, FOL 250, and FEL 385. However, plutonium in these samples is mainly originating
from global fallout as showed by their isotope ratios close to the global fallout signal in Japanese soils. The relatively low 240Pu/239Pu ratio (0.150±0.005, 1 SD) of sample FOL 250 is very interesting, as its 239Pu abundance is clearly higher than the one of the other samples. The sample FOL 250 could therefore contain Pu from another source than one or several of the damaged reactors from FDNPP, which would have higher 239Pu abundance than the reported global fallout measured in Japanese soils26,28,29. However, the 240Pu/239Pu ratio of this sample remains within the range of ratios reported for global fallout (Table S2).
In the coastal plains where initial cesium fallout was comparatively much lower, total Pu
concentrations are also lower, although the Pu atom ratios show a clear FDNPP signature, especially higher 241Pu and 242Pu isotopic concentrations. This result would corroborate the findings previously published based on the spatial pattern of 110mAg:137Cs ratio measured in soils after the Fukushima accident (Fig. S1)20,30. However, the outlying atom ratios found in sample FNL034B – which is also the most contaminated in both plutonium and radiocesium – are rather surprising. This sample, collected in Nitta River headwaters, is not located within the main radioactive plume, but in its prolongation to the northwest. As this zone is currently being decontaminated, more analyses should be conducted to better understand the Pu isotopic atom ratio patterns and distribution across this area. Transport of Pu to longer distances in Fukushima than in Chernobyl may be explained by the different
accidental conditions that prevailed at both sites. In Chernobyl, the Pu bearing particles were larger because of the graphite fires, which likely explains that they deposited at a shorter distance from the power plant1.
Respective proportions of FDNPP Pu and of global fallout Pu. It is possible to calculate for each
analyzed sample the fraction of Pu which originates from the FDNPP, using isotopic abundances. Values taken into account for isotopic compositions of Pu from FDNPP reactors were respectively taken from previous studies6,10,12,13 (see Table S1). Abundance for the global fallout was the one measured by Kelley et al.26 for a soil sample collected in Tokyo. The fraction of Pu from FDNPP in a given sample (XFD,i) may be calculated as follows for any iPu isotope (i = 239, 240, 241, and 242):
(
)
(
)
(
i)
FD(
i)
GF GF i Mes i i, FD Pu A Pu A Pu A Pu A X − − = (1) Where A( )
iPuMes,( )
GF iPuA , and A
(
iPu)
FD are the iPu isotopic abundances respectively in the Pumeasured in the sample, from the global fallout, and from FDNPP. The standard uncertainty on XFD,i is calculated by using the propagation error formula.
Results obtained with the isotope 241Pu are the most precise and are given in Table S3. Fractions of Pu originating from FDNPP calculated using 240Pu and 241Pu isotopes remained in relatively good agreement. However, results obtained with the 240Pu isotopes have high standard uncertainties, especially for the samples for which both 240Pu/239Pu ratios are very close. Negative values were even obtained for FNS 140 and FOL 250 samples using the 240Pu abundances as 240Pu/239Pu atom ratios in both samples were slightly lower than the value taken into account for characterizing the Pu isotopic composition of global fallout. Calculations with the 241Pu abundances were performed with a higher precision and were referred to hereafter. If we consider the isotopic compositions derived from the values published by Nishihara et al.12, the fractions of Pu from FDNPP in the analyzed soils range from ∼1% for FNS 140 and FOL 250 samples to ∼60% for FNL 034B sample. Again, this result is rather
surprising as the FNL 034B sampling site is the farthest from FDNPP (∼45 km). However, these results are relatively consistent with previous findings. Schwantes et al.10 observed that vented plutonium from Units 1 and 3 accounts for ∼16% of the total plutonium present in surface soil located at up to 45 km from the source. Yamamoto et al.14 calculated a proportion of FDNPP-originating Pu comprised between 2–44 % in surface soils collected ∼25 km NW from FDNPP (Iitate-Mura). In addition, Zheng et al.15 calculated that the percentage of Fukushima-derived Pu was 87% is surface soil samples collected in the J-village, 20 km south of FDNPP.
Overall, the additional Pu activity supplied by FDNPP accident to the soils and sediment of the region remains very low. However, the sample characterized by the Pu isotopic composition which is the closest to the global fallout signature – and which contains thus the lowest FDNPP Pu contribution – is also the one with the highest Pu concentration (FNS 140, 490±87 pg·g-1). Total 239+240+241+242Pu activity concentrations in the six analyzed soil and riverine sediment samples range from 2.1 (FOL 250 and FNS 140) to 20.6 Bq kg-1 dry weight (FNL 034 B). 238Pu activity was not considered, but its inclusion would not significantly modify these figures. It should be noted that the most part of this activity is due to the relatively short-lived 241Pu isotope. Overall, the 239+240Pu activity concentrations are between 0.16 and 1.56 Bq kg-1 dry weight, within the range of the typical global fallout 239+240Pu activity of 0.15 to 4.31 Bq kg-1 dry weight reported in the literature31. 241Pu activities measured in the samples range from 1.2 to 17.7 Bq kg-1, in the same range as the high 241Pu activities (from 4.5 to 34.8 Bq kg-1 dry weight) measured previously in surface soils and litters collected in the vicinity of
FDNPP15.
Future studies should focus on analyzing Pu isotope and atom ratio values on a large set of soils from the area located to the northwest of the exclusion zone in order to better understand its spatial distribution across the area and the succession of events (burn-up, release of radionuclides, etc.) that occurred at FDNPP in March 2011 and their consequences on Pu dispersion in the environment. Furthermore, similar analyses should be conducted on a larger set of river sediment samples collected in coastal rivers draining this area as this study showed their potential delivery to the Ocean. Our results show that the high 241Pu/239Pu atom ratio of the Fukushima accident sourced-Pu may particularly provide a relevant tracer of continental-originating material from Fukushima Prefecture to the Pacific Ocean.
Associated content
Supporting information. Figure displaying the location of the analyzed samples on a map of 110mAg: 137
Cs activity ratio in soils of Fukushima Prefecture, and Tables detailing the Pu isotopic composition used for calculation of the fraction of Pu from FDNPP in the analyzed soil samples (Table S1) and the results of Pu isotopic measurements carried out on Japanese soil samples or atmospheric deposition samples in Japan (Table S2). This material is available free of charge via the Internet at
http://pubs.acs.org.
Author information
Corresponding authors
*Tel: +33-1-69-82-35-20 (O.Evrard), +33-1-69-26-49-17 (F. Pointurier); e-mail: olivier.evrard@lsce.ipsl.fr (O. Evrard), fabien.pointurier@cea.fr (F. Pointurier).
Author contributions
O.E., F.P. and Y.O. conceived the study. Fieldwork and sampling collection was conducted by O.E., C.C., H.L., I.L. and P.B. Then, O.E., H.L., I.L. and P.B. processed samples and conducted gamma spectrometry analyses, whereas plutonium analyses were performed by F.P., A.H. and A.C.P. The manuscript was written by O.E. and F.P., and was reviewed by Y.O., C.C., H.L., I.L., J.P.L., P.B. and S.A.
Acknowledgements
This work has been supported by ANR and JST in the framework of the joint TOFU ANR Flash/J-RAPID Franco-Japanese project (ANR- 11-JAPN-001), the French AMORAD project (ANR-11-RSNR-0002), and by CEA (Direction des Relations Internationales) and UVSQ (Bonus de Qualité Internationale) grants. The authors are grateful to CEA/SPR Saclay (S. Scapolan, S. Brun) for conducting preliminary alpha spectrometry analyses. Fieldwork assistance by K. Hisadome, F. Kono, H. Kato was also greatly appreciated. The authors thank four anonymous reviewers whose comments helped improve the manuscript.
References
1. Steinhauser, G.; Brandl, A.; Johnson, T.E. Comparison of the Chernobyl and Fukushima nuclear accidents: A review of the environmental impacts. Sci. Total Environ., 2014, 470-471, 800-817.
2. Le Petit, G.; et al. Analysis of radionuclide releases from the Fukushima Dai-ichi Nuclear Power Plant accident, Part I. Pure Appl. Geophys., 2014, 171, 629-644.
3. Achim, P.; et al. Analysis of radionuclide releases from the Fukushima Dai-ichi Nuclear Power Plant accident, Part II. Pure Appl. Geophys., 2014, 171, 645-667.
4. Kato, H.; Onda, Y.; Teramage, M. Depth distribution of 137Cs, 134Cs, and 131I in soil profile after Fukushima Dai-ichi Nuclear Power Plant Accident. J. Environ. Radioact., 2012, 111, 59–64. 5. Kamada, N.; Saito, O.; Endo, S.; Kimura, A.; Shizuma, K. Radiation doses among residents
living 37 km northwest of the Fukushima Dai-ichi Nuclear Power Plant. J. Environ. Radioact.,
2012, 110, 84-89.
6. Kirchner, G.; Bossew, P.; De Cort, M. Radioactivity from Fukushima Dai-ichi in air over
Europe; part 2: what can it tell us about the accident? J. Environ. Radioact., 2012, 114, 35-40. 7. Hardy, E.P., Krey, P.W., Volchok, H.L., Global inventory and distribution of fallout plutonium,
Nature, 1973, 241, 444–445.
8. Krey, P.W.; Hardy, E.P.; Pachuki, C.; Rourke, F.; Coluzza, J.; Benson, W.K. Mass isotopic composition of global fallout plutonium in soil: Transuranium nuclides in the environment, Proceedings of a symposium jointly organized by (USERDA/ IAEA symposium proceedings, San Francisco, 17-21/11/1975), STI/PUB/410, IAEA, 1976.
9. Ministry of Education, Culture, Sports Science and Technology (MEXT). Results of the Nuclide Analysis of Plutonium and Strontium by MEXT.
http://radioactivity.nsr.go.jp/en/contents/5000/4167/24/1750_093014.pdf, (2011) Date of access: 01/04/2014.
10. Schwantes, J.M.; Orton, C.R.; Clark, R.A. Analysis of a nuclear accident: Fission and activation product releases from the Fukushima Dai-ichi nuclear facility as remote indicators of source identification, extent of release, and state of damaged spent nuclear fuel. Environ. Sci.
Technol., 2012, 46, 8621-8627.
11. Schneider, S.; et al. Plutonium release from Fukushima Dai-ichi fosters the need for more detailed investigations. Sci. Rep., 2013, 3, 2988.
12. Nishihara, K., Iwamoto, H., Suyama, K., Estimation of fuel compositions in Fukushima-Daiichi Nuclear Power Plant, 2012, JAEA-Data/Code No. 2012-018.
13. Zheng, J.; Tagami, K.; Uchida, S. Release of plutonium isotopes into the environment from the Fukushima Dai-ichi Nuclear Power Plant accident: what is known and what needs to be known. Environ. Sci. Technol., 2013, 47, 9584-9595.
14. Yamamoto, M.; et al. Early survey of radioactive contamination in soil due to the Fukushima Dai-ichi Nuclear Power Plant accident: with emphasis on Pu analysis. Geochem. J., 2012, 46, 341-353.
15. Zheng, J.; et al. Isotopic evidence of plutonium release into the environment from the Fukushima-DNPP accident. Sci. Rep., 2012, 2, 304.
16. Sakaguchi, A.; et al. Isotopic determination of U, Pu and Cs in environmental waters following the Fukushima Dai-ichi Nuclear Power Plant accident. Geochem. J., 2012, 46, 355-360.
17. Yamamoto, M.; et al. Isotopic Pu, Am and Cm signatures in environmental samples
contaminated by the Fukushima Dai-ichi Nuclear Power Plant accident. J. Environ. Radioact.,
2014, 132, 31-46.
18. Zheng, J.; Aono, T.; Uchida, S.; Zhang, J.; Honda, M.C. Distribution of Pu isotopes in marine sediments in the pacific 30 km off Fukushima after the Fukushima Dai-ichi nuclear power plant accident. Geochem. J., 2012, 46, 361-369.
19. Bu, W.T.; et al. Determination of plutonium isotopes in marine sediments off the Fukushima coast following the Fukushima Dai-ichi Nuclear Power Plant accident. Biogeosciences
Discuss., 2013, 10, 643–680.
20. Chartin, C.; et al. Tracking the early dispersion of contaminated sediment along rivers draining the Fukushima radioactive pollution plume. Anthropocene, 2013, 1, 23-34. 21. Evrard, O.; et al. Evolution of radioactive dose rates in fresh sediment deposits along rivers
draining Fukushima contamination plume. Sci. Rep., 2013, 3, 3079.
22. Pointurier, F.; Baglan, N.; Hémet, P. Ultra low-level measurements of actinides by sector field ICP-MS. Applied Rad. Isot., 2004, 60, 561-566.
23. Pointurier, F.; Hémet, P.; Hubert, A. Assessment of plutonium measurement in the femtogram range by ICP-MS; correction from interfering polyatomic species. J. Anal. At.
Spectrom., 2008, 23, 104-112.
24. Pointurier, F.; Hubert, A.; Fauré, A.L.; Hémet, P.; Pottin, A.C. Polyatomic interferences in plutonium determination in the femtogram range by double-focusing sector-field ICP-MS, J.
Anal. At. Spectrom., 2011, 26, 1474-1480.
25. Guide to the expression of Uncertainty in Measurement (‘GUM’, International Organization for Standardization, ISBN 92-67-10188-9, 1995).
26. Kelley, J.M.; Bond, L.A.; Beasley, T.M., Global distribution of Pu isotopes and 237Np, Sci. Total.
Env., 1999, 237/238, 483-500.
27. Wellum, R., Verbruggen, A., Kessel,R., A new evaluation of the half-life of 241Pu, J. Anal. Atom.
Spectrom., 2009, 24, 801-807.
28. Muramatsu, Y.; Yoshida, S.; Tanaka, A. Determination of Pu concentration and its isotope ratio in Japanese soils by HR-ICP-MS, J. Radioanal. Nucl. Chem., 2003, 255, 477-480. 29. Zhang, Y., Zheng, J., Yamada, M., WU, F., Igarashi, Y., Hirose, K., Characterization of Pu
concentration and its isotopic composition in a reference fallout material, Sci. Total Environ.
2010, 408, 1139–1144.
30. Lepage, H.; Evrard, O.; Onda, Y.; Patin, J.; Chartin, C.; Lefèvre, I.; Bonté, P.; Ayrault, S. Environmental mobility of 110mAg: lessons learnt from Fukushima accident (Japan) and potential use for tracking the dispersion of contamination within coastal catchments. J.
Figures
Figure 1. Location of the main inland radiocesium contamination plume in northeastern Japan (colored lines), the analyzed samples (white dots), and samples analyzed in other studies in which plutonium was detected (colored dots).
Figure 2. Plot of the 241Pu/239Pu atom ratios versus the 240Pu/239Pu atom ratios measured in the frame of this study (red plain circles) and by Hardy et al.7, Krey et al.8, and by Kelley et al.26 (blue empty circles). Uncertainties are standard uncertainties (k=1). 241Pu/239Pu ratios are corrected from radioactive decay to the 15 March 2011. Note that log scales are used for both axes. Excerpt: zoom for FOL 250 and FNS 140 samples and previously published data for Japanese soils22 and for average Northern Hemisphere soils (linear scale)22.
Figure 3. Plot of the 242Pu/239Pu atom ratios versus the 240Pu/239Pu atom ratios measured in the frame of this study (red plain circles) and by Hardy et al.7, Krey et al.8, and by Kelley et al.26 (blue empty circles). Uncertainties are standard uncertainties (k=1). Note that log scales are used for both axes. Excerpt: zoom for FOL 250 and FNS 140 samples and previously published data for Japanese soils22 and for average Northern Hemisphere soils (linear scale)22.
Figure 4. Plot of the 241Pu/239Pu atom ratios versus the 242Pu/239Pu atom ratios measured in the frame of this study (red plain circles) and by Hardy et al.7, Krey et al.8, and by Kelley et al.26 (blue empty circles). Uncertainties are standard uncertainties (k=1). 241Pu/239Pu ratios are corrected from radioactive decay to the 15 March 2011. Note that log scales are used for both axes.
Tables
Table 1. Activity concentrations in radionuclides in the analyzed samples. 241Pu activities are
corrected from radioactive decay to 15 March 2011. Uncertainties are standard-uncertainties (given with a coverage factor of 1). Pu isotopic concentration activities are given in Bq per kg of dry weight material. Sample Date 239Pu (Bq·kg-1) 240 Pu (Bq·kg-1) 241 Pu (Bq·kg-1) 242 Pu (Bq·kg-1) 137 Cs (Bq·kg-1) 110m Ag (Bq·kg-1) FNL 034B Nov. 2011 0.121±0.013 0.125±0.013 20.3±2.4 0.00027±0.00005 715 780 ± 360 3 090 ± 120 FNL 139B April 2012 0.094±0.010 0.069±0.008 3.5±0.9 0.00005±0.00003 172 370 ± 160 590 ± 70 FNS 140 April 2012 0.954±0.098 0.603±0.062 4.1±0.7 0.00027±0.00004 188 450 ± 200 1 040 ± 100 FOL 250 Nov. 2012 0.444±0.046 0.243±0.025 1.4±0.3 0.00010±0.00003 64 200 ± 200 650 ± 140 FOL 255 Nov. 2012 0.118±0.012 0.088±0.009 4.5±0.6 0.00007±0.00003 116 420 ± 340 600 ± 220 FEL 385 May 2013 0.497±0.051 0.330±0.034 5.1±1.0 0.00018±0.00003 102 430 ± 380 400 ± 240
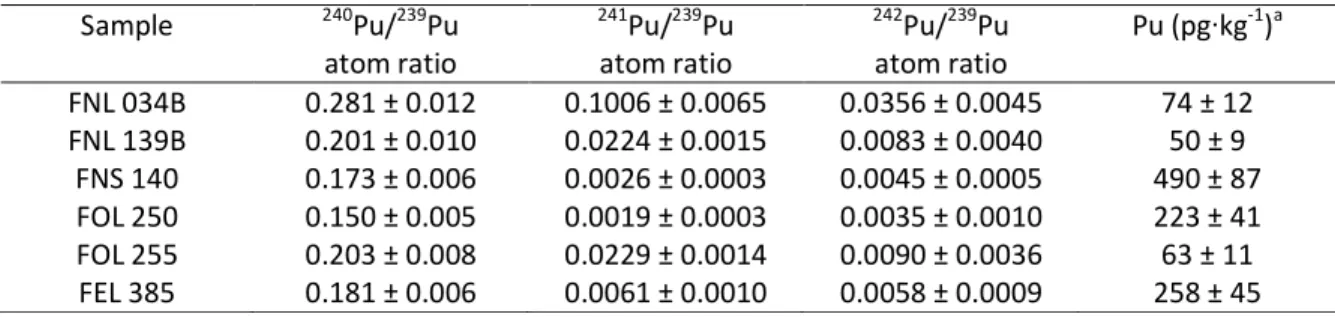
Table 2. Pu concentration and atom ratios measured in this study. 241Pu/239Pu ratios are corrected from radioactive decay to 15 March 2011. Uncertainties are standard-uncertainties (given with a coverage factor of 1). Pu concentrations are given in pg per kg of dry weight material.
Sample 240Pu/239Pu atom ratio 241 Pu/239Pu atom ratio 242 Pu/239Pu atom ratio Pu (pg·kg-1)a FNL 034B 0.281 ± 0.012 0.1006 ± 0.0065 0.0356 ± 0.0045 74 ± 12 FNL 139B 0.201 ± 0.010 0.0224 ± 0.0015 0.0083 ± 0.0040 50 ± 9 FNS 140 0.173 ± 0.006 0.0026 ± 0.0003 0.0045 ± 0.0005 490 ± 87 FOL 250 0.150 ± 0.005 0.0019 ± 0.0003 0.0035 ± 0.0010 223 ± 41 FOL 255 0.203 ± 0.008 0.0229 ± 0.0014 0.0090 ± 0.0036 63 ± 11 FEL 385 0.181 ± 0.006 0.0061 ± 0.0010 0.0058 ± 0.0009 258 ± 45