HAL Id: hal-01213898
https://hal.archives-ouvertes.fr/hal-01213898
Submitted on 12 Oct 2015
HAL is a multi-disciplinary open access
archive for the deposit and dissemination of
sci-entific research documents, whether they are
pub-lished or not. The documents may come from
teaching and research institutions in France or
abroad, or from public or private research centers.
L’archive ouverte pluridisciplinaire HAL, est
destinée au dépôt et à la diffusion de documents
scientifiques de niveau recherche, publiés ou non,
émanant des établissements d’enseignement et de
recherche français ou étrangers, des laboratoires
publics ou privés.
Percolation in suspensions and de Gennes conjectures
Stany Gallier, Elisabeth Lemaire, Francois Peters, Laurent Lobry
To cite this version:
Stany Gallier, Elisabeth Lemaire, Francois Peters, Laurent Lobry. Percolation in suspensions and de
Gennes conjectures. Physical Review E : Statistical, Nonlinear, and Soft Matter Physics, American
Physical Society, 2015, 92, pp.020301. �10.1103/PhysRevE.92.020301�. �hal-01213898�
Stany GALLIER∗
SAFRAN-Herakles, Le Bouchet Research Center, 91710 Vert le Petit, France
Elisabeth LEMAIRE, Fran¸cois PETERS, and Laurent LOBRY
CNRS-University of Nice, LPMC-UMR 7336, 06108 Nice, France (Dated: August 16, 2015)
Dense suspensions display complex flow properties, intermediate between solid and liquid. When sheared, a suspension self-organizes and forms particle clusters that are likely to percolate, possibly leading to significant changes in the overall behavior. Some theoretical conjectures on percolation in suspensions were proposed by De Gennes some 35 years ago. Although still used, they have not received any validations so far. In this paper, we use three-dimensional detailed numerical simulations to understand the formation of percolation clusters and assess De Gennes conjectures. We found that sheared non-colloidal suspensions do show percolation clusters occurring at a critical volume fraction in the range 0.3∼0.4 depending on the system size. Percolation clusters are roughly linear, extremely transient, and involve a limited number of particles. We have computed critical exponents and found that clusters can be described reasonably well by standard isotropic percolation theory. The only disagreement with De Gennes concerns the role of percolation clusters on rheology which is found to be weak. Our results eventually validate De Gennes conjectures and demonstrate the relevance of percolation concepts in suspension physics.
Dense suspensions are ubiquitous in nature and industry. They exhibit an intricate physics which is far from being understood completely [1, 2]. Early simulations of sheared non-Brownian suspensions have shown that their microstructure does not remain isotropic and that particles form large clusters globally oriented along the compression axis [3, 4]. Those structures usually spread over a long distance and may transmit significant stresses across the suspension [5]. They are also believed to contribute to thixotropy and shear-thickening in concentrated suspensions [6, 7]. Clusters are likely to percolate, which means they can form a connected network of particles spanning across the whole domain. This percolation may result in dramatic changes in the overall suspension behavior, such as a discontinuous isolating/conducting transition if particles are conducting and carrying fluid is insulating. In a seminal paper, De Gennes [8] proposed a set of theoretical conjectures about percolation clusters in sheared suspensions. This study is extensively cited in the literature [9] ; nonetheless it is still conjectural and it has surprisingly not received any validations so far. In this paper, we intend to assess some of the 35-year-old De Gennes conjectures using three-dimensional numeri-cal simulations of suspensions.
The suspensions considered in this work are non-Brownian, non-colloidal and composed of monodisperse spheres of radius a. Fluid and particle inertia are neglected. Numerical simulations are based on a fic-titious domain method which solves the flow at the particle scale and explicitly accounts for the long-range many-body hydrodynamic interactions between particles [10]. A correction procedure is considered for lubrication interactions similarly to Stokesian Dy-namics [4]. More details on our lubrication technique may be found in [10, 11]. We consider rough particles
having a roughness size hr= 5.10−3a, which is a typical
experimental value [12, 13]. Particle roughness involves actual contacts – despite lubrication – that are modeled by a normal repulsion force Fc given by a Hertz law
Fc= kn|δ|3/2· n where n is the normal vector n=r/krk
with r the branch vector joining the sphere centers and δ = krk − 2a − hr. The stiffness kn is chosen large so
as to mimic rigid particles (i.e., |δ| a). Simulations are performed in a wall-bounded linear shear flow with a domain size L in velocity (x) and velocity-gradient (y) directions (Lx=Ly=L) while a constant Lz=20a
is fixed in the vorticity (z) direction. The system size L will be varied between 20a and 40a giving a total number of particles in the range 1000∼3000. Upper and lower walls are prescribed with opposite velocities to produce a linear flow of shear rate ˙γ. The flow is periodic in velocity (x) and vorticity (z) directions. Computations are conducted during at least 100 ˙γ−1 and instantaneous particle configurations are stored every 0.01 ˙γ−1. The resulting set of about 10,000 realizations
is then processed to detect and study particle clusters. A percolation cluster (more rigorously, a spanning cluster) is here defined as a cluster of particles in contact that entirely spans the computational domain in the y-direction, i.e. it simultaneously connects both walls. A remark is that the cluster definition completely hinges on roughness. Yet, the physical relevance of our roughness model seems confirmed by experiments [14]. Moreover, roughness size hr is available experimentally and lies in
the range 10−2a ∼ 10−3a [12, 13]. This choice of physical values precludes any arbitrary cut-off distance to define contacts. Note that perfectly smooth spheres can not be handled but such spheres do not exist in practice and make anyway simulations extremely problematic [15].
In the following, we address and check different conjectures proposed by De Gennes. Conjectures are
2
here numbered for practical reasons (this is not the case in the original article where they are peppered all along the paper). Quotes denote exact citations taken from De Gennes [8].
Conjecture 1: ”When volume fraction φ exceeds a critical value φcr (of order 1/5), an infinite cluster
appears in analogy with percolation problem”.
Our simulations suggest that above a threshold vol-ume fraction φ∗, an incipient cluster spans the domain.
This onset of percolation can be investigated using the probability hΠi that a cluster spans the domain, i.e Π=1 when there is at least one spanning cluster in the suspension and Π=0 otherwise. Brackets h.i will indicate an ensemble average all along this paper. Likewise, the strength P is defined as the probability for a given particle to belong to spanning clusters. Therefore, hP i is the average fraction of particles in spanning clusters. Simulations show that there can exist several spanning clusters simultaneously, in accordance with theoretical results [16]. The probabilities hΠi and hP i are shown in Fig. 1 for different system sizes L. The threshold fraction φL
∗ for system size L is defined as
φL∗ = sup{φ : hΠ(L, φ)i = 0} and ranges from φL∗ ≈ 0.29 for L=20a to φL
∗ ≈ 0.37 for L=40a. Obviously, hP i and
hΠi both become non-zero at the same threshold φL ∗. In
any case, for φ & 0.42, a permanent percolation regime exists (i.e., hΠi=1) which means that there is always at least one spanning cluster in the suspension. The fraction hP i of particles involved in spanning clusters is only about 50 % at φ ≈ 0.42 although spanning clusters are always present in the suspension since hΠi=1. There is however an abrupt increase of hP i for φ ≈ 0.4. Figure 1 also shows that the probabilities hΠi and hP i strongly depend on the system size which is expected due to finite-size effects, which occur when the size of the largest clusters is similar to the system size L. This tends to smooth the evolution of probabilities as well as to enlarge the percolation/non-percolation transition zone. In the limit of an infinite domain (L → ∞), the probability hΠi is expected to be a Heaviside sharp function having discontinuity at the critical volume fraction φcr. For finite systems, as apparent from
Fig. 1, spanning clusters may occur prior to the critical fraction, i.e. φL∗ ≤ φcr (the equality φL∗=φcr holds for
L → ∞). Globally, the obtained thresholds φL∗ are consistent with the scarce available simulations, between 0.3 and 0.4 [17–19]. Experimentally, Blanc et al. [20] noted the first spanning clusters occurring in a Couette rheometer by φ∗≈ 0.3 [21]. Overall, this first conjecture
is confirmed by our simulations although percolation thresholds are larger than expected by De Gennes (about 0.2). Note that his value was taken from experiments on colloidal suspensions [22], so that colloidal interactions could possibly explain this discrepancy.
Conjecture 2: ”Clusters have a branched structure. [...] We find that one sphere may be in contact [...]
FIG. 1. Spanning probability hΠi (a) and spanning strength hP i (b) as a function of volume fraction φ for different system sizes L.
simultaneously with up to eight neighbours”.
Spanning clusters are indeed found to be relatively linear with some branched structures as seen in Fig. 2. This figure represents an instantaneous particle configuration (φ=0.32 ; L=30a) showing a spanning cluster connecting upper and lower walls (a spanning cluster for φ=0.39 is also provided in Supplementary Materials). For the sake of clarity, particles not belonging to this cluster are not represented. The roughly linear structure can be confirmed by computing the average coordination number (number of contacts per particle) which is found to be close to 2, independently of volume fraction (Fig. 3). The instantaneous maximum coordination number can reach up to 8 as postulated by De Gennes. This occurs for the highest volume fractions (φ & 0.45) ; for moderate φ, it lies between 4 and 7. This maximal coordination of 8 was still found at φ=0.5 but higher fractions led to system crystallization. The average ori-entation angle θ (with respect to the velocity direction) for particle pairs in spanning clusters was computed in the (x,y) plane and found to be hθi ≈ 120o regardless
of volume fraction. This means that spanning clusters are always globally oriented along the compression axis (θ = 135o).
FIG. 2. A spanning cluster in a sheared bounded suspen-sion (φ=0.32 ; L=30a). Only particles belonging to spanning cluster are represented.
FIG. 3. Average (•) and maximum (◦) coordination number in spanning clusters as a function of volume fraction (L=20a).
Conjecture 3: ”The clusters are not permanent. While rotating in ambient fluid, some links are removed, and some others are established”.
From the time evolution of Π(t), we have investigated the temporal dynamics of spanning clusters by comput-ing a time scale hτsi defined as the average duration
of spanning events. As seen in Fig. 4 for L=20a, the time scale hτsi is found to be rather small, typically
of the order of 0.1 ˙γ−1, from φ=φ∗ (≈ 0.29) until φ ≈
0.38. This means that spanning clusters are extremely transient and their life time is short. This unsteady behavior remains even at higher volume fractions : at φ=0.4 (and L=20a), this time scale hτsi is still as low as
0.6 ˙γ−1 although clusters span during 90 % of the time (hΠi ≈ 0.9). Then, for φ & 0.42 (L=20a), hτsi diverges
since there is a permanent percolation. Note that even in this case, clusters have a constantly evolving structure although they always span the domain. In contrast, the average waiting time hτwi between two spanning
events shows a different evolution with a continuously decreasing power-law hτwi ∝ (φ − φL∗)δ with δ ≈ −3.1.
Those results show that on a large volume fraction range, spanning clusters have a rather constant life time but occur with increasing frequency as volume fraction grows. This confirms the very transient nature of clusters conjectured by De Gennes.
FIG. 4. Characteristic spanning times hτsi (•) and waiting
times hτwi (◦) as a function of volume fraction (L=20a ;
φ∗=0.29). Times are rescaled by the inverse shear rate ˙γ−1.
Conjecture 4: ”Scaling near threshold is given by stan-dard isotropic percolation”.
Following standard percolation theory, most quantities obey scaling laws close to critical fraction that are largely insensitive to the network structure. For instance, the strength hP i, correlation length hξi and mean cluster size hSi should obey [23, 24]
hP i ∝ (φ − φcr)β, φ → φ+cr (1)
hξi ∝ |φcr− φ|−ν, φ → φcr (2)
hSi ∝ |φcr− φ|−γ, φ → φcr (3)
Note that Eq. (1) holds only for φ > φcrwhereas Eq. (2)
and Eq. (3) are valid for any φ 6= φcr as long as infinite
clusters are excluded. Standard isotropic percolation the-ory proposes that critical exponents β, ν and γ are uni-versal with β=0.41, ν=0.88, and γ=1.82 in 3D [23, 24]. To assess whether percolation theory is adequate for sus-pensions, we provide a first estimation of critical expo-nents β, ν and γ as well as φcr. As it will be seen,
the correlation length ξ does not need to be explicitly computed to estimate exponent ν. For a given particle configuration, the mean cluster size S is defined as
S = P0 ss 2n s P0 ssns (4)
where nsis the cluster number distribution, i.e. the
prob-ability that a cluster contains s particles (sns is
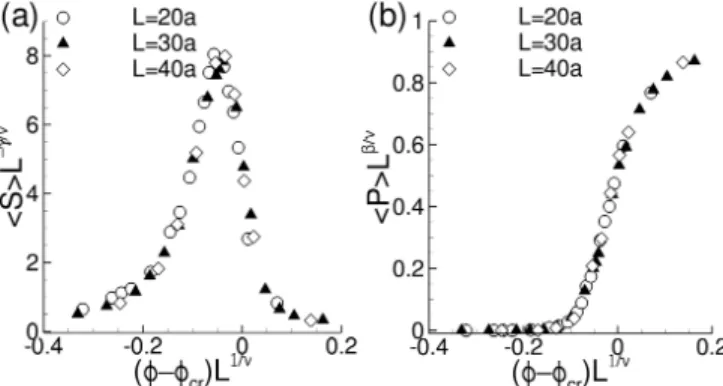
there-fore the probability that a given particle is part of an s-cluster. An example of such a distribution is provided in Supplementary Materials). In Eq. (4), the primed sum means that spanning clusters are excluded from the sum. For small finite systems however, the above power laws Eq. (1) to Eq. (3) are not observed directly and, for in-stance, hξi and hSi remain finite at the critical fraction. In that case, it is generally preferred to consider finite-size scaling theory [25]. According to this theory, mean clus-ter size and clusclus-ter strength should read hSi ∝ Lγ/νF (q)
and hP i ∝ L−β/νG(q) with q = (φ − φcr)L1/ν. This
means that the rescaled mean cluster size hSiL−γ/ν and strength hP iLβ/ν can be described by some unique
func-tions F and G (not known in general) as a function of (φ − φcr)L1/ν. We have therefore considered all our
re-sults for various φ and L values and run a minimiza-tion simultaneously on (φcr, γ, ν, β) so as to obtain the
best data collapse on rescaled cluster size and strength. This best collapse is reached for φcr ≈ 0.415 ± 0.005,
γ ≈ 1.91 ± 0.15, ν ≈ 1.02 ± 0.10 and β ≈ 0.18 ± 0.05. The resulting scaling functions F and G are shown in Fig. 5. This seems to be the first attempt in estimat-ing critical exponents for percolation in suspensions. Ex-cept for β, which is low compared to theory (0.18 vs. 0.41), the obtained exponents are relatively consistent with standard percolation theory. The discrepancy on β can not presently be explained and could possibly come from relatively small system size, or the presence of walls. Additional simulations in larger domains (not
4
done due to huge computational demand) could confirm whether this arises from small systems or actual devia-tion from isotropic percoladevia-tion theory. Finally, note that the computed φcr≈ 0.415 is close to Blanc’s experiments
φcr≈ 0.45 [20].
FIG. 5. Rescaled mean cluster size hSiL−γ/ν(a) and rescaled strength hP iLβ/ν(b) as a function of (φ − φ
cr)L1/ν. The best
data collapse is obtained for φcr=0.415, γ=1.91, ν=1.02 and
β=0.18. Scales are arbitrary since they depend on L (here, L is dimensional with a=0.1).
Conjecture 5: ”At critical concentration we would ex-pect an anomaly in the plot of apparent viscosity versus concentration”.
De Gennes was aware that this was not supported by ex-periments since he mentioned that ”nothing of this sort has been observed ”. Indeed, Blanc’s experiments [20] confirm that when percolation clusters are noticed, this results in no change in the viscosity. Figure 6 presents the computed suspension relative viscosity ηr = ηs/ηf
(where ηs and ηf are the suspension and fluid viscosity, respectively) as a function of strain. A gray circle indi-cates the presence of at least one spanning cluster in the suspension. There seems to be no clear links between viscosity and occurrence of spanning clusters. Maximal values or rapid variations in the viscosity are not related to spanning events. It is sometimes argued that large viscosity fluctuations might be connected to percolation clusters but this is clearly not supported by our results. To investigate the role of clusters on rheology, we intro-duce a stress enhancement factor hW i as
hW i = h1 P Σp,sc xy Σpxy i (5) where Σp
xy is the particle tangential stress (directly
re-lated to relative viscosity ηr) and superscript sc refers
to spanning clusters. This factor can be viewed as the average tangential stress supported by a particle belong-ing to spannbelong-ing clusters scaled by the average tangential stress of a particle in the suspension. This stress factor is computed for L=20a and different volume fractions in Tab. I together with the average strength hP i. The computed values of hW i are greater than 1 indicating that particles in spanning clusters do support tangential
FIG. 6. Suspension relative viscosity ηras a function of strain (φ=0.34, L=20a). A gray circle marks the presence of at least one spanning cluster.
stresses that are larger (by 19 to 39 %) than in the rest of the suspension. Although this stress concentration ex-ists, the overall effect on the suspension remains weak. For low φ, this is due to the small fraction of particles hP i involved whereas for highest φ, the stress factor hW i gets closer to 1. In the latter case, there are many large – but non-spanning – clusters in the suspension that trans-mit significant stresses as well. The viscosity ηr is pre-dicted to evolve progressively with φ unlike hP i which grows abruptly at the critical fraction. Computations do not show viscosity changes at the critical threshold. Formally, De Gennes assumption is valid since spanning clusters result in higher tangential stresses (hence, viscos-ity) but the overall effect is quite weak – and can hardly be measured – which might explain the lack of experi-mental evidence so far.
As a general remark, we have also investigated the ef-fect of roughness size : all our conclusions remain qual-itatively valid although percolation thresholds can be slightly shifted depending on roughness (see Supplemen-tary Materials).
TABLE I. Stress factor hW i (Eq. (5)) and strength hP i for L=20a (φ∗≈ 0.29).
Volume fraction φ Stress factor hW i Strength hP i
0.34 1.39 0.008
0.36 1.27 0.025
0.38 1.22 0.127
0.40 1.19 0.314
In conclusion, we have considered direct numerical sim-ulations of sheared suspensions to check the relevance of some conjectures on percolation proposed by De Gennes 35 years ago. By and large, most ideas proposed are in very good accordance with present simulations. In particular, a sheared suspension can percolate as soon as φ lies in the range 0.3∼0.4 and its behavior globally matches percolation theory (although more simulations are required for a definite conclusion). Yet, percolation has a very weak effect on rheology. Rheology may there-fore track the size or orientation of clusters rather than their percolation nature. Future work should also con-sider the effect of friction which is found to be important
in suspension rheology [7, 11].
[1] J.J. Stickel and R.L. Powell, Annu. Rev. Fluid Mech. 37, 129 (2005)
[2] D.J. Pine, J.P. Gollub, J.F. Brady and A.M. Leshansky, Nature 438, 997 (2005).
[3] G. Bossis and J.F. Brady, J. Chem. Phys. 80, 5141 (1984) [4] J.F. Brady and G. Bossis, J. Fluid Mech. 155, 105 (1985) [5] G. Bossis, A. Meunier, and J.F. Brady, J. Chem. Phys.
94, 5064 (1991)
[6] G. Ovarlez, F. Bertrand, and S. Rodts, J. Rheol. 50, 259 (2006)
[7] R. Seto, R. Mari, J.F. Morris, and M.M. Denn, Phys. Rev. Lett. 111, 218301 (2013)
[8] P.G. De Gennes, J. Phys. (Paris) 40, 783 (1979) [9] A Google Scholar search returns 66 citations [April 2015]. [10] S. Gallier, E. Lemaire, L. Lobry, and F. Peters, J.
Com-put. Phys. 256, 367 (2014)
[11] S. Gallier, E. Lemaire, F. Peters, and L. Lobry, J. Fluid Mech. 757, 514 (2014)
[12] J.R. Smart and D.T. Leighton, Phys. Fluids A 1, 52 (1989)
[13] F. Blanc, F. Peters, and E. Lemaire, Phys. Rev. Lett. 107, 208302 (2011)
[14] O.I. Vinogradova and G.E. Yakubov, Phys. Rev. E 76,
045302 (2006)
[15] J.R. Melrose and R.C. Ball, Europhys. Lett. 32, 535 (1995)
[16] M. Aizenman, Nucl. Phys. B 485, 551 (1997)
[17] T.N. Phung, J.F. Brady, and G. Bossis, J. Fluid Mech. 313, 181 (1996)
[18] C. Chang and R.L. Powell, J. Fluid Mech. 253, 1 (1993) [19] A. Meunier and G. Bossis, Eur. Phys. J. E 25, 187 (2008) [20] R. Blanc, M. Belzons, C. Camoin, and J. Bouillot, Rheol.
Acta 22, 505 (1983)
[21] Reported thresholds are from two-dimensional experi-ments and simulations but are here recast in volume frac-tions.
[22] E.B. Vadas, H.L. Goldsmith, and S.G. Mason, T. Soc. Rheol. 20, 373 (1976)
[23] M. Sahini and M. Sahimi, Applications of percolation the-ory (CRC Press, 1994)
[24] D. Stauffer and A. Aharony, Introduction to percolation theory (Taylor and Francis, 1991)
[25] V. Privman, Finite-size scaling theory (Singapore World Scientific, 1990)