HAL Id: hal-00800710
https://hal.archives-ouvertes.fr/hal-00800710
Submitted on 18 Mar 2013
HAL is a multi-disciplinary open access archive for the deposit and dissemination of sci-entific research documents, whether they are pub-lished or not. The documents may come from teaching and research institutions in France or abroad, or from public or private research centers.
L’archive ouverte pluridisciplinaire HAL, est destinée au dépôt et à la diffusion de documents scientifiques de niveau recherche, publiés ou non, émanant des établissements d’enseignement et de recherche français ou étrangers, des laboratoires publics ou privés.
Holidays and Turnout at Presidential Elections in
France: An Update
Eric Dubois
To cite this version:
Eric Dubois. Holidays and Turnout at Presidential Elections in France: An Update. French Politics, Palgrave Macmillan, 2012, 10 (2), pp.181-187. �hal-00800710�
Holidays and Turnout at Presidential Elections in France:
An Update
Eric Dubois
1membre associé, CES-Université de Paris 1
Abstract: This short note aims to update the model of Dubois and Ben Lakhdar (2007) which
showed the significant impact of holidays on the turnout at French presidential elections. The main result of this update is that holidays are still relevant in the explanation of turnout after the sample was expanded in both spatial and temporal dimensions. More precisely, estimations from a sample composed of the maximum number of territories (96 Metropolitan departments) and of the maximum number of periods (9 elections between 1965 and 2012) indicate that holidays affect the turnout rate by about 1 point.
Keywords: Turnout, Presidential elections, Holidays
JEL code: D72
This short note aims to update the model of Dubois and Ben Lakhdar (2007) published in this journal and possibly to improve it by enlarging the sample and by implementing a better control of the effects previously obtained. This model was built to assess the impact of the school calendar, and more precisely of the spring holidays, on the turnout at the French presidential elections. Table 1 displays the dates of spring holidays in each of the four areas which comprise Metropolitan France2 and the dates of the first rounds of presidential elections since 1988. The cells in bold indicate that in these areas, the first round fell in a holiday period.
Table 1. Dates of spring holidays and presidential elections
1
Dates of the election Area A Area B Area C Corsica (first round) 1988 04/18-05/01 04/01-04/18 03/26-04/11 04/02-04/18 04/24 1995 04/08-04/24 04/22-05/09 04/15-05/02 04/22-05/09 04/23 2002 04/06-04/22 03/30-04/15 04/13-04/29 04/06-04/22 04/21 2007 03/31-04/16 04/14-05/02 04/07-04/23 04/14-05/02 04/22 2012 04/07-04/23 04/21-05/07 04/14-04/30 04/21-05/07 04/22 Year Dates of Spring holidays
The original model covered 67 departments on the 1988-2002 period, with a total of 201 observations. The spatial dimension was reduced to 67 departments instead of 96 because some data were not available in 27 departments and because the two Corsican departments have a specific calendar. Regarding the temporal dimension, data for one control variable are not available from before 1982 and the election of 1981 therefore has to be disregarded. Moreover, when the article was written, the 2007 election has still not been held.
The model has the following structure. The explained variable is the turnout rate in the first round. The second round had not been considered because it never fell in a holiday period. Four explanatory variables are included: the evolution of unemployment, the political supply (number of candidates), the meteorological climate, and a holiday dummy. This late variable takes 1 in the departments where the election takes place during holidays, and 0 otherwise. Of course, this variable takes into account the fact that France is divided into four areas in order to stagger the holiday period. With regard to these four variables, spatial fixed effects are added to account for a turnout which may have been structurally lower or higher in certain departments. These rigidities can be explained by socio-demographical factors which are difficult to comprehend otherwise than as fixed effects, because data for these factors were not available by department and/or for the whole period being studied.
Our objective is to update this model but we wish first of all to expand its spatial dimension by increasing the number of departments in the sample. In order to do this, we decided to remove the climatic variable. The inclusion of this variable cost 27 departments for each election; a total of 81 observations. It may be somewhat disturbing to remove a relevant variable (underfitting bias) but nothing can guarantee that even if the sample included all the departments, the climatic variable would be still relevant (possible selection bias). Moreover, we have included the two Corsican departments by obtaining their specific holiday calendar
for each election year. The 2007 model can therefore be re-estimated with 288 observations. The results are shown in column 1 of table 23.
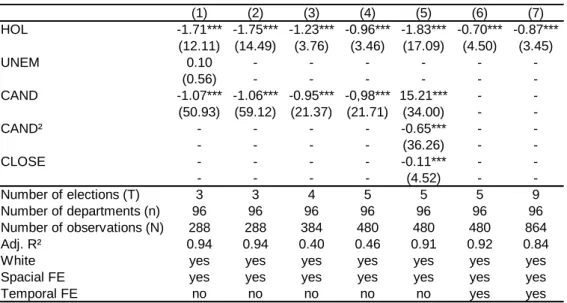
Table 2. Estimates' results
(1) (2) (3) (4) (5) (6) (7) HOL -1.71*** -1.75*** -1.23*** -0.96*** -1.83*** -0.70*** -0.87*** (12.11) (14.49) (3.76) (3.46) (17.09) (4.50) (3.45) UNEM 0.10 - - - -(0.56) - - - -CAND -1.07*** -1.06*** -0.95*** -0,98*** 15.21*** - -(50.93) (59.12) (21.37) (21.71) (34.00) - -CAND² - - - - -0.65*** - -- - - - (36.26) - -CLOSE - - - - -0.11*** - -- - - - (4.52) - -Number of elections (T) 3 3 4 5 5 5 9 Number of departments (n) 96 96 96 96 96 96 96 Number of observations (N) 288 288 384 480 480 480 864 Adj. R² 0.94 0.94 0.40 0.46 0.91 0.92 0.84
White yes yes yes yes yes yes yes
Spacial FE yes yes yes yes yes yes yes
Temporal FE no no no no no yes yes
We can observe that the unemployment variable is no longer relevant (it was significant at 10 % in the previous study). We may assume that it is a consequence of the enlargement of the sample. However, it is more probably due to data revision in the unemployment series because when we estimate the model on 67 departments (old sample), the unemployment variable is non-significant. The correlation between the old and the new series of unemployment is 0.71. Another important point is the fact that we have removed the climatic variable. If this was correlated with the unemployment variable, this might explain why unemployment turns to be non-significant when this variable is dropped. But the correlation between both variables is not so large (0.44). Perhaps the combined effects of revised data and multicolinearity can be said to explain this change.
Column 2 shows the estimates without the unemployment variable. We can see that the relevance of holidays is robust with regard to the inclusion of the 29 departments which were missing in the first study. The inclusion of the 2007 election (column 3) and of the 2012 election (column 4) leads to somewhat different results. If the holiday variable remains highly significant, its explanatory power dramatically falls, as indicated by its Student-t and by the
adjusted R². In particular, the decrease of the coefficient between 2007 and 2012 (in absolute value) may be explained by the fact that before the 2007 election, the procedure of vote by proxy ("vote par procuration") has been simplified. This seems to indicate that taking into account other potential explanatory factors could improve the model.
We chose to include two additional control variables. The first one accounts for the closeness of the ballot. Following the theory of instrumental voting developed by Downs (1957), when results are expected to be close, people participate more because this closeness increases their probability of being decisive. To our knowledge, this effect has never being studied in an empirical model explaining the turnout at French presidential election (or in other types of elections, see for example Fauvelle-Aymar and François, 2006). Here the difficulty lies in the way of defining a closeness variable. Usually, the number of candidates envisaged is two and it is therefore easy to compute the gap between them. In our case, we have more than two candidates. We have considered that what matters is not the gap between the two main candidates but the gap between the candidate ranked 2 and the candidate ranked 3. What is important for voters in the first round of the presidential election is that their candidate will qualify for the second round. Other stakes appear to be minor. For example, being ranked first in the first round does not guarantee the victory in the second one (see the examples of F. Mitterrand in 1974, V. Giscard d'Estaing in 1981, or L. Jospin in 1995). In a similar vein, being the first candidate among several extreme-left candidates can be of interest. But this kind of situation concerns few potential voters and does not greatly affect therefore the turnout much. To build our measure of closeness, we have computed the mean of the gap in absolute value in the vote intentions (in % of expressed votes) in favour of the candidate ranked two and the candidate ranked three in the last survey published before the first round by the six main poll institutes (variable noted CLOSE). We expect a negative sign for this variable: the lower the closeness is, higher the turnout will be.
The second control variable we would like to include in our model accounts for a possible non-linearity in the political supply. Up to now, we have considered only the positive influence of the number of candidates on turnout: the higher the number of candidates, the larger the choice for voters and the higher the turnout will be ("expression effect"). A large political supply thus reduces what is called "abstention by indifference". However, we can also expect that beyond a certain threshold, the growing number of candidates decreases the turnout by introducing a "confusion effect". Confronted with a high number of candidates,
people cannot choose and abstain (see in the French case Hoffmann-Martinot 1992, 1994, Hoffmann-Martinot et al. 1996, Fauvelle-Aymar and François 2005). Considering this, we have introduced into our empirical model, beside the number of candidates (a variable noted as CAND), the square of the number of candidates to allow a curvilinear impact of political fragmentation on turnout (variable noted CAND²). A positive sign is therefore expected for the linear term and a negative sign is expected for the quadratic one.
Other potential factors that may affect turnout have been disregarded after a preliminary examination. In, for example, the case of a possible "long weekend effect", elections can be held outside the holiday period but near to a (single) holiday. After a close examination, the first round was never affected by such an event in our studied period4. We have also envisaged other classical influences on turnout identified by the literature but these controls are irrelevant here because our study concerns a single country and the legal framework is homogenous over time in this country (simultaneity with other elections, compulsory voting, frequency of elections, existence of automatic registration, age to vote, proximity of the deadline of registration from the ballot, possibility of voting by post, number of days of polling, payment of a poll tax to vote, alphabetization test to register, economic development, unicameralism, federalism, degree of proportionality, relative importance of the election, length of day, etc.).
The column 5 displays the results. The non-linearity in the political supply is strongly supported by our data, thus attesting to both an expression effect and a confusion effect. The closeness variable has the expected negative sign: closer is the election, higher is the turnout rate. However, the effect is small: when the gap between the candidate ranked 3 and the candidate ranked 2 increases of one point, the turnout rate diminishes of about 0.1 point.
These two new variables share a common characteristic: they take into account the specific context of each election. However, we have to note that they do not account for the entire context. For example, the implementation of a new vote by proxy mechanism, a boring campaign, close platforms among candidates, or a potential demobilization effect due the feeling that the election has already been decided are not captured by these variables. To take
into account all the context-specific influences, we have included temporal fixed effects5. Estimates are shown in column 6. They confirm once again the influence of holidays on turnout, even if the size of the coefficient is reduced. This not really a surprise, since temporal fixed effects account for more influences than previous variables.
We can remark that there is still room to expand our sample. Indeed, up to now, the inclusion of the unemployment variable was the reason why we have to begin our study in 1988. Since we have dropped this variable, we can extend the period under study. Nothing prevents us from basing our estimate on the 1965-2012 period, which would encompass all the presidential elections held during the Fifth Republic6. We just need to create some slight hypotheses, since some departments had been modified7. The estimates are presented in column 7. The coefficient of HOL remains significant at 1 %.
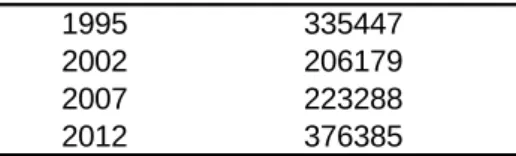
We can retain this coefficient estimated over a long period and controlled for both spatial and temporal effects, to make some computations. For example, we can estimate the number of votes lost because of the holidays. In each department where there were holidays, we have multiplied the number of registered voters by 0.87 %8 and computed the total.
Table 3. Number of votes lost due to holidays
1995 335447
2002 206179
2007 223288
2012 376385
5 We recall here that (1) we can include only T-1 time dummies, the remaining date being the reference period
(2) we cannot include simultaneously time dummies and variables such as CAND, CAND², or CLOSE because, like the temporal dummies, they have the same value for all the departments in the same election but different values across elections. However, we have to note that this is not important, since time dummies precisely take into account variables such as CAND, CAND², or CLOSE.
6 HOL takes 0 for all departments in the 1965, 1969, 1974, and 1981 elections. 7
We can note two main changes. Firstly, until 1976, the two Corsican departments were gathered. For the 1965 and the 1969 elections, we have considered that the turnout rates are the same in both department and are equal to the turnout rate of the whole Corsica. Secondly, in 1968, the departments near Paris were redistricted. The departments of Seine and Seine-et-Oise were split in 7 departments: Paris, Yvelines, Essonne, Hauts-de-Seine, Seine-Saint-Denis, Val-de-Marne, and Val-d'Oise. For the 1965 election, we have first gathered the figures of Seine and Seine-et-Oise and we have carried out the same process as with the Corsican departments: we have assigned the turnout rate of Seine + Seine-et-Oise to Paris, Yvelines, Essonne, Hauts-de-Seine, Seine-Saint-Denis, Val-de-Marne, and Val-d'Oise.
8
Put in other words, if there were no holidays in these departments, the turnout rate would be higher at 0.87 points.
These figures show that if holidays have a clear statistical impact on turnout, the number of votes lost would not be high. Despite how statistically significant this might be, the presence of holidays should be considered as a marginal factor that affects fragile voters only. In this case, should the calendar of holidays and/or of the election be changed? The date of the election is constrained by legal dispositions9. The solution should be therefore to advance the holidays but make sure they are not held too close to the winter vacations10. Perhaps, in the future, technical progress will make it possible to have an electronic national file of registered voters that permits voters to vote with a national ID card wherever they are. However, this will require holding more electoral polls in holiday destinations and therefore this could be somewhat more difficult in terms of organization.
References:
Downs, A. (1957). An Economic Theory of Democracy, New York: Harper and Row.
Dubois, E. and C. Ben Lakhdar (2007). More on Seasonal Determinants of Turnout: Holidays and French Presidential Elections. French Politics, 5, 144-159.
Fauvelle-Aymar, C. and François, A. (2005). Campaigns, Political Preferences and Turnout: An Empirical Study of the 1997 French Legislative Elections. French Politics, 3, 49-72. Fauvelle-Aymar, C. and François, A. (2006). The Impact of Closeness on Turnout: An Empirical Relation Based on a Study of a Two-Round Ballot. Public Choice, 127, 469-491. Hoffmann-Martinot, V. (1992). La participation aux elections municipales dans les villes francaises. Revue francaise de science politique, 42, 3-35.
Hoffman-Martinot, V. (1994). Voter Turnout in French Municipal Elections. In Local
Elections in Europe, Barcelona: Institut de ciències polítiques i socials, 11-42.
Hoffmann-Martinot, V., Rallings, C. and Thrasher, M. (1996). Comparing Local Electoral Turnout in Great-Britain and France: More Similarities than Differences? European Journal
of Political Research, 30, 241-257.
9 The presidential election is held between 20 and 35 days before the end of the current president’s mandate.
Since the mandate of Nicolas Sarkozy began on 16 May 2007, the first round should have been held between April, 10th and April, 25th, 2012. This left two Sundays only, on April, 15th and on April, 22th, to organize the