HAL Id: inserm-00753913
https://www.hal.inserm.fr/inserm-00753913
Submitted on 19 Nov 2012
HAL is a multi-disciplinary open access
archive for the deposit and dissemination of
sci-entific research documents, whether they are
pub-lished or not. The documents may come from
teaching and research institutions in France or
abroad, or from public or private research centers.
L’archive ouverte pluridisciplinaire HAL, est
destinée au dépôt et à la diffusion de documents
scientifiques de niveau recherche, publiés ou non,
émanant des établissements d’enseignement et de
recherche français ou étrangers, des laboratoires
publics ou privés.
Determinants of non- response to a second assessment of
lifestyle factors and body weight in the
EPIC-PANACEA study.
Anne May, Lotte Adema, Dora Romaguera, Anne-Claire Vergnaud, Antonio
Agudo, Ulf Ekelund, Annika Steffen, Philippos Orfanos, Nadia Slimani,
Sabina Rinaldi, et al.
To cite this version:
Anne May, Lotte Adema, Dora Romaguera, Anne-Claire Vergnaud, Antonio Agudo, et al..
Deter-minants of non- response to a second assessment of lifestyle factors and body weight in the
EPIC-PANACEA study.. BMC Medical Research Methodology, BioMed Central, 2012, 12 (1), pp.148.
�10.1186/1471-2288-12-148�. �inserm-00753913�
R E S E A R C H A R T I C L E
Open Access
Determinants of non- response to a second
assessment of lifestyle factors and body weight in
the EPIC-PANACEA study
Anne M May
1,2*, Lotte E Adema
1, Dora Romaguera
3, Anne-Claire Vergnaud
3, Antonio Agudo
4, Ulf Ekelund
5,
Annika Steffen
6, Philippos Orfanos
7, Nadia Slimani
8, Sabina Rinaldi
8, Traci Mouw
3, Sabine Rohrmann
9,
Silke Hermann
9, Heiner Boeing
6, Manuela M Bergmann
6, Marianne Uhre Jakobsen
10, Kim Overvad
10,11,
Nicholas J Wareham
5, Carlos Gonzalez
4, Anne Tjonneland
12, Jytte Halkjaer
12, Timothy J Key
13,
Elizabeth A Spencer
13, Veronica Hellstrom
14, Jonas Manjer
15, Bo Hedblad
16, Eiliv Lund
17, Tonje Braaten
17,
Françoise Clavel-Chapelon
18,19, Marie-Christine Boutron-Ruault
18,19, Laudina Rodríguez
20, Maria J Sánchez
21,
Miren Dorronsoro
22, Aurelio Barricarte
23, Jose Maria Huerta
24, Androniki Naska
7, Antonia Trichopoulou
7,
Domenico Palli
25, Valeria Pala
26, Teresa Norat
3, Amalia Mattiello
27, Rosario Tumino
28, Daphne van der A
2,
H Bas Bueno-de-Mesquita
2, Elio Riboli
3and Petra HM Peeters
1,3Abstract
Background: This paper discusses whether baseline demographic, socio-economic, health variables, length of follow-up and method of contacting the participants predict non-response to the invitation for a second assessment of lifestyle factors and body weight in the European multi-center EPIC-PANACEA study.
Methods: Over 500.000 participants from several centers in ten European countries recruited between 1992 and 2000 were contacted 2–11 years later to update data on lifestyle and body weight. Length of follow-up as well as the method of approaching differed between the collaborating study centers. Non-responders were compared with responders using multivariate logistic regression analyses.
Results: Overall response for the second assessment was high (81.6%). Compared to postal surveys, centers where the participants completed the questionnaire by phone attained a higher response. Response was also high in centers with a short follow-up period. Non-response was higher in participants who were male (odds ratio 1.09 (confidence interval 1.07; 1.11), aged under 40 years (1.96 (1.90; 2.02), living alone (1.40 (1.37; 1.43), less educated (1.35 (1.12; 1.19), of poorer health (1.33 (1.27; 1.39), reporting an unhealthy lifestyle and who had either a low (<18.5 kg/m2, 1.16 (1.09; 1.23)) or a high BMI (>25, 1.08 (1.06; 1.10); especially ≥30 kg/m2, 1.26 (1.23; 1.29)). Conclusions: Cohort studies may enhance cohort maintenance by paying particular attention to the subgroups that are most unlikely to respond and by an active recruitment strategy using telephone interviews.
Keywords: Non-response, Non-participation, Lost-to-follow-up
* Correspondence:a.m.may@umcutrecht.nl
1Julius Centre for Health Sciences and Primary Care, University Medical
Centre Utrecht, Utrecht University, PO Box 85500, 3508, GA Utrecht, The Netherlands
2National Institute for Public Health and the Environment (RIVM), Bilthoven,
The Netherlands
Full list of author information is available at the end of the article
© 2012 May et al.; licensee BioMed Central Ltd. This is an Open Access article distributed under the terms of the Creative Commons Attribution License (http://creativecommons.org/licenses/by/2.0), which permits unrestricted use, distribution, and reproduction in any medium, provided the original work is properly cited.
Background
Large cohort studies are subject to the problem of attri-tion. The most prominent types of attrition include those participants who have died during the follow-up period, those who cannot be located because of (e)mi-gration, and those who do not respond to the follow-up survey (i.e., non-responders) [1,2]. Although some causes cannot be influenced by the researcher, study de-sign and efforts to contact the study population can modify the degree of attrition [2].
High rates of non-participation to a follow-up survey can lead to selection bias, when the persons who drop-out differ significantly from the participants in character-istics that are related to the outcome being studied [3,4]. This loss of a selective group can reduce the external validity as well as the generalizability of the research findings [1,2,5,6]. The success of any longitudinal study, therefore, depends upon its participants remaining in the study [2]. Assessment of information on initial par-ticipation and retention rates helps to evaluate potential selection bias when non-participation during follow-up is not random [1,7,8]. Furthermore, assessment of deter-minants of attrition may identify characteristics of participants who are most unlikely to respond to the follow-up survey [1]. This may aid in management strat-egies to target specifically individuals with such charac-teristics and thus leading to reducing non-response [1,4,6,9]. Various population-based longitudinal cohort studies have shown that non-responders often differ from those who respond to a follow-up survey with re-spect to demographic, socioeconomic and health charac-teristics. Many factors have been investigated, though not all factors are consistently found to be significantly associated with non-response [10,11]. However, in most studies, non-responders are more likely to be among the youngest [1-3,12] or oldest participants [6,8,9], to live alone [1-4,6,9,13], to be less educated [1,4,6,8,11-14], un-employed [2,5,9,14] and to have a low income [5,6,11]. Non-responders are more likely to have an unhealthy lifestyle, especially being a smoker [2-4,7,8,11,13]. The general health profile of non-responders tends to be worse than that of responders [1,4,8,9,11,13,15,16] and a higher prevalence of obesity is observed [3,8,12].
To date, studies on determinants of non-response have been mainly conducted in single population-based cohorts where all participants were followed for the same time period. The present study, however, is based on data from almost 500.000 participants from 10 European countries, as part of the EPIC-PANACEA (European Prospective Investigation into Cancer and Nutrition-Physical Activity, Nutrition, Alcohol, Cessation of Smoking, Eating out of home And obesity) study. EPIC-PANACEA aims to investigate the determinants of obesity and body weight changes in Europe. For
the purpose of EPIC-PANACEA data from a second assessment of body weight collected several years after baseline were centralized and combined with the EPIC baseline dataset. The length of follow-up as well as the method of contacting participants (i.e. by postal surveys, directly by phone or by a request to visit a study center for physical examination) dif-fered between the collaborating centers. This allows insight in whether non-response differs with various methods of contacting participants and diverse dura-tions of follow-up.
The purpose of the present study was twofold. First, we investigated whether baseline demographic, socio-economic, health variables, length of follow-up and method of contacting the participants predicted non-response to an invitation for a second assessment of life-style factors and body weight excluding those who were not (yet) contacted, and those who either died or emi-grated during follow-up. This provides insight in import-ant determinimport-ants of non-response that can be used to enhance cohort maintenance in future studies. Second, we compared all baseline participants for whom a sec-ond body weight assessment was missing (including non-responders, (e)migrated, deceased or not yet con-tacted participants) with responders, to evaluate whether the population lost to follow-up formed a selective group causing potential selection bias in future analyses. Methods
Study population at baseline
The PANACEA study is part of the large EPIC study. EPIC is an ongoing multi-center prospective cohort study, designed to investigate the relationship of nutri-tion and lifestyle with cancer and other chronic diseases [17]. The study is conducted in several centers in ten European countries (Denmark [Copenhagen, Aarhus], France, Germany [Potsdam, Heidelberg], Greece, Italy [Florence, Varese, Ragusa, Turin, Naples], The Netherlands [Utrecht, Doetinchem, Amsterdam/Maastricht], Norway, Spain [Asturias, Granada, Murcia, Navarra, San Sebastian], Sweden [Malmø, Umea] and the United Kingdom [Oxford general health, Oxford health conscious, Cambridge]). In the present study, multiple centers within a country were treated as a single study center, when length of follow-up and data collection methods did not differ and when coordination took place out of one center. Therefore, data from multiple centers in Spain and Denmark are treated as single centers, whereas the centers from the UK, Germany, The Netherlands, Italy and Sweden are treated separately in our ana-lyses. In Norway and Greece one coordinating center was situated.
Enrolment took place between 1992–2000, which resulted in recruitment of 521.448 male and female
May et al. BMC Medical Research Methodology 2012, 12:148 Page 2 of 9
participants aged between 20–80 years. In many centers participants were invited from the general population residing in a given town or geographical area except for France where members of the health insurance for tea-chers were included; a large part of the Spanish and Italian centers included blood donors; the cohorts in Utrecht and Florence included women attending the breast cancer screening program. Half of the participants recruited by the Oxford centre are ‘health conscious’ vegetarian or healthy eaters partly recruited by contacting members of The Vegetarian Society of the UK and all surviving partici-pants in the Oxford Vegetarian Study [18]. In France, Norway, Utrecht (The Netherlands) and Naples (Italy) only women were recruited. Participants were either invited by mail (Navarra and Asturias (Spain), Ragusa (Italy), France, Germany, Netherlands, United Kingdom, Denmark, Sweden, Norway), in person (Turin (Italy) or in person and by mail (Granada, Murcia and San Sebastian (Spain), Greece, Florence, Naples and Varese (Italy). Indi-viduals who provided written informed consent were mailed standardized questionnaires on diet and on life-style, socio-economic and health variables. Most partici-pants completed these questionnaires at home and were then invited to a study centre for an examination. In Spain and Ragusa (Italy), the participants received the non-dietary questionnaire by mail. The lifestyle questionnaire was self-administered when visiting the study centre, where also an interviewer-administered computer-driven dietary questionnaire was completed. Participants in Greece who were recruited in person completed an interviewer-administered questionnaire on diet and a questionnaire on lifestyle at the study centre. In Denmark and Malmö (Sweden), the participants filled in dietary questionnaires at home and lifestyle questionnaires at the study centres.
In all EPIC centres, at the study centre anthropometric measurements were performed and blood samples were taken. Only in France, Oxford-Health conscious group and Norway anthropometric measurements were self-reported by the participants. A detailed description of the data collection in each EPIC centre has been reported earlier [17].
Approval was obtained from the ethical review boards of the International Agency for Research on Cancer and from all local centers.
The EPIC-PANACEA project is designed to investigate the determinants of obesity and weight changes in Europe. From the 521.448 participants recruited initially, 23.479 participants were excluded because of missing information on dietary or lifestyle variables, unavailable information on body mass index (BMI), extreme values on anthropometry data, pregnancy or due to an extreme ratio between energy intake and energy re-quirement. Thus, 497.969 participants with complete
baseline data on anthropometry were available for the baseline EPIC-PANACEA analyses.
Follow-up data collection
EPIC participants are followed for vital status, cause of death and disease occurrence. In most of the centers these data are obtained by regular record linkage with the exception of Greece and Potsdam (Germany) where an active follow-up is used. For updating lifestyle and anthropometric data participants were contacted a sec-ond time several years after recruitment. For the pur-pose of EPIC-PANACEA the second assessment of body weight was centralized and combined with the baseline dataset.
Follow-up time between first and second anthropom-etry assessment differed between study centers due to logistical and financial reasons, and varied between two (in Heidelberg, Germany) to eleven (in Varese, Italy) years. Assessment was conducted through mailed ques-tionnaires, with several exceptions: Spain and Greece contacted their participants by phone and also com-pleted the questionnaire on the phone. Varese used a combination of postal survey and telephone interview. Cambridge (United Kingdom) and Doetinchem (i.e. a sub-cohort of the EPIC Bilthoven cohort, The Nether-lands) invited their participants to come to the research center for a second measurement of anthropometry and other lifestyle factors.
In Ragusa (Italy), Turin (Italy) and Potsdam follow-up assessment is currently ongoing. Data from Ragusa and Turin are therefore not included in the present study. Potsdam provided available data from participants who were contacted so far. Naples (Italy) took a random sam-ple of 700 participants of their baseline population for the second assessment round. In Doetinchem 1,101 baseline participants were not contacted for the follow-up survey. Hence, from all baseline participants 25,355 participants had not (yet) been contacted for a second assessment.
Missing data on follow-up assessment of body weight
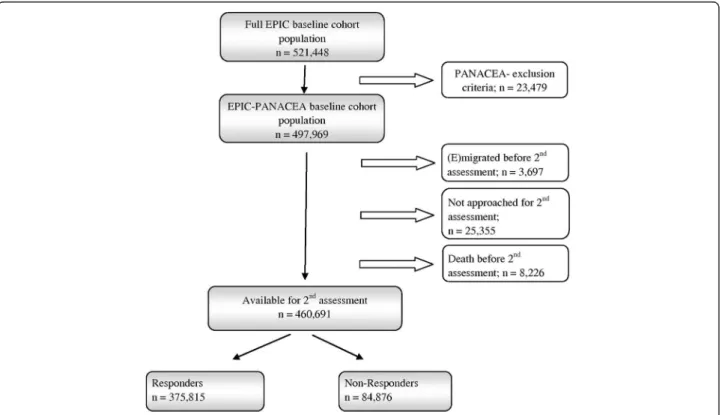
In addition to the above mentioned reason for missing follow-up lifestyle and anthropometric data, i.e. not (yet) contacted, we defined three other reasons for missing data at follow-up, i.e. death (n = 8,226), (e)migration (this information was not provided by France, Spain, Greece and Germany) (n = 3,9697), and non-response to the in-vitation to participate in the second assessment round (n = 84,876). We defined non-responders as baseline par-ticipants who were contacted for the second assessment (alive and not (e)migrated), but who did not respond to the invitation to participate, i.e. a second assessment of body weight is not available in the EPIC-PANACEA dataset. We defined ‘persons with missing second
assessment data’ as all persons for whom a second body weight assessment is missing (i.e. non responders, death, emigrated, or not contacted yet). Figure 1 sum-marizes the flow of the participants through the EPIC-PANACEA study.
Potential determinants of non-response
Determinants were chosen based on their importance in fu-ture weight change analyses in EPIC-PANACEA or because they were related to non-response in other studies [1-9,12,13]. Selected demographic and socioeconomic vari-ables included sex (male/female), age (≤40/41-60/>60 years), marital status (married or living together/single, divorced or separated, widowed) and highest educational level (pri-mary school or less/vocational secondary school/other sec-ondary school/college or university). Lifestyle variables included physical activity according to a validated physical activity index based on work and leisure time activity (in-active/moderately in(in-active/moderately active/active) [19], smoking status (never smoker/former smoker/current smoker) and alcohol consumption (non users/light alcohol users (0–18 g/day)/moderate alcohol users (18–60 g/day)/ heavy alcohol users (>60 g/day)). Health variables included BMI (<18.5/18.5-25/25-30/≥30 kg/m2), having cancer or a chronic condition or disease (hypertension, stroke, myocardial infarction, diabetes mellitus) at baseline, or having developed cancer between baseline and the invitation for the second assessment of body
weight. Finally recruitment strategy for the second as-sessment (postal survey, survey completed by telephone, request to visit a study center) and mean follow-up time (0–4 years, 4.1-8 years, >8 years) were taken into account.
Data analysis
Response rates for the assessment of a second body weight were calculated according to the standard defini-tions used by the American Association for Public Opin-ion Research (AAPOR) [20]; i.e. the number of participants with a second weight assessment (respon-ders) divided by the sum of the responders and partici-pants who did not respond (non-responders), died, emigrated or were not yet contacted. Response rates were also calculated for the number of responders divided by the number of non-responders (i.e. excluding baseline participants who were not yet approached, died or emigrated before the second weight assessment from the denominator).
Baseline characteristics of responders (n = 375,815) were compared to characteristics of non-responders (n = 84,876). This information is important because it may help in defining strategies to prevent non-response. To predict probability of non-response by baseline char-acteristics a multivariate logistic regression model was used with response status (0 for response and 1 for non-response) as the dependent variable and all above
Figure 1 Flow of participants through the EPIC-PANACEA study.
May et al. BMC Medical Research Methodology 2012, 12:148 Page 4 of 9
mentioned baseline characteristics, recruitment strategy and mean follow-up time as independent variables. Odds ratios mutually adjusted for all variables and their 95% confidence intervals were calculated.
Secondly, baseline characteristics of responders (n = 375,815) were compared to characteristics of all those persons who had missing data for the second body weight assessment either because of death, (e)migration, not (yet) contacted or non-response (n = 122,154). This information is important in future analyses to interpret whether differences between cross-sectional relations in the baseline cohort (for example between physical activ-ity and BMI) and results from longitudinal studies (for example relations between baseline physical activity and future weight change) can be explained by selection bias. Again a multivariate logistic regression model was used with response status as the dependent variable and above mentioned baseline characteristics as independent variables.
All analyses were performed with SPSS software, ver-sion 15.0 for Windows.
Results
Response
From all baseline participants (n = 497,969), a second as-sessment of weight was obtained for 375,815 persons (75.5%). When taking in the denominator only those persons who were contacted (n = 460,691 excluding deceased, (e)migrated and not approached persons) the response rate was 81.6%.
Table 1 shows the EPIC-PANACEA centers ranked according the time between first and second body weight assessment. Furthermore, the distribution of centers according to the different groups of attrition (i.e. not (yet) approached, deceased, (e)migrated, second assessment missing, non-response) is shown.
Baseline characteristics of non-responders
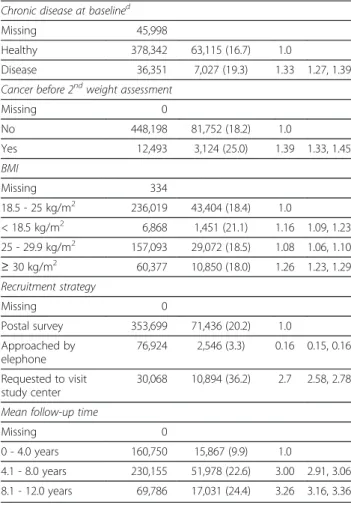
Table 2 presents mutually adjusted associations between baseline characteristics and non-response. Non-responders were more likely to be male, to be young (≤40 years), to live alone (single, divorced/separated, widowed), to be less educated (primary or vocational secondary school), to be physically inactive (i.e. seden-tary job and no recreational activity), to be current smo-kers, to be either a non or heavy alcohol user, to have a chronic disease at baseline but not cancer, to have devel-oped cancer between baseline and second weight assess-ment and to have either a low (<18.5 kg/m2) or a high BMI (>25, especially ≥30 kg/m2). Based on the Wald statistic, the characteristics that strongly predicted non-response were recruitment strategy and duration of fol-low-up. A more active way of contacting participants, i.e. through direct telephone interview instead of a
mailed questionnaire, resulted in a six-fold higher re-sponse. Non-response was more than three-fold if the follow-up assessment occurred after a long period, par-ticularly more than 8 years.
When comparing characteristics of the baseline cohort to the characteristics of all persons who had a missing second anthropometric assessment (death, (e)migrated, not yet contacted and non-response) on average the same characteristics were related to missingness (data not shown). Participants for whom a second weight as-sessment was missing were more often male, young (<40 years), living alone (single, divorced/separated, widowed), less educated (primary or secondary school as highest attained educational level), former or current smo-kers, alcohol abstainers, chronically diseased at baseline, having developed cancer between baseline and second weight assessment and having either a low (<18.5 kg/m2) or a high BMI (>25, especially ≥30 kg/m2). A missing sec-ond body weight assessment was not related to heavy al-cohol use or physical inactivity.
Discussion
We investigated whether baseline demographic, socio-economic and health variables were different between responders and non-responders to a second assessment of body weight in a large European cohort. Our results suggest that non-response was non-random, but linked to specific characteristics of the participants at baseline. Both analyses, responders versus non-responders and responders versus all participants with missing second body weight assessment showed that non-responders were more often male, aged under 40 years, living alone, less educated, of poorer health, reported an unhealthy lifestyle and had either a low or a high BMI. Moreover, important predictors of a high response were a short follow-up time and an active way of follow-up using per-sonal telephone interviews.
Non-response
Overall response for the EPIC-PANACEA cohort was 81.6%, varying from 58.2% to 98.8% per center/country. One explanation for the generally high response is that all responders already were participants in the EPIC study assessing relations between lifestyle and chronic diseases. Usually this is a selective population with higher interest in medical and health issues and there-fore higher motivation to participate in follow-up assess-ments. Follow-up time and recruitment strategy differed between the different study centers explaining part of the differences in response between the centers. A shorter time between first and second assessment was associated with a higher response, possibly because par-ticipants in centers with short follow-up duration still felt more involved in the study. Direct approach by
telephone also yielded a higher response when compared to using a postal questionnaire. This implies that efforts of researchers to try and contact participants by tele-phone may enhance participation. However, requesting participants to visit a research center causes a burden to some persons, resulting in a lower response when com-pared to mailed or telephone administered question-naires. However, we should be cautious with these conclusions because we did not study effects of different follow-up times and recruitments strategies within a center. So, center differences may also contribute to the observed differences in response between centers with
different follow-up times and recruitments strategies. For example, in the Spain where participants where con-tacted by phone, blood donors were included and donors might be cooperative with regard to health related initia-tives in general.
We identified several demographic and socioeconomic determinants that were independently related to non-response. The lower response among participants below age 40 years may relate to work obligations and family commitments and consequently less time to take part in research. This effect of age is in agreement with some studies [1-3,12], although others found non-response
Table 1 Characteristics of the EPIC-PANACEA Cohort
EPIC-PANACEA
centersa Total baselinepopulation
n Mean age yrs (SD) Mean follow-up time yrs (SD) Method of contacting
for 2ndassessment Not (yet)contacted
n (%) Death n (%) (E) migrated n (%) 2nd assessment missingb n (%) Nonresponsec n (%) Heidelberg (GE) 24,954 51.0 (8.1) 2.1 (0.6) P 0 129 (0.5) na 1,771 (7.1) 1,642 (6.6) Spain 40,418 49.3 (8.0) 3.3 (0.4) T 0 202 (0.5) na 703 (1.7) 501 (1.2) France 71,910 52.9 (6.7) 3.4 (0.8) P 0 382 (0.5) na 4,544 (6.3) 4,162 (5.8) Cambridge (UK) 24,818 59.3 (9.3) 3.7 (0.7) C 0 637 (2.6) 0 10,199 (41.1) 9,562 (39.5) Utrecht (NL) 16,869 57.7 (6.0) 4.4 (0.8) P 0 225 (1.3) 859 (5.1) 4,723 (28.0) 3,639 (23.1) Malmo (SW) 27,463 58.1 (7.6) 4.9 (0.5) P 0 776 (2.8) na 5,832 (21.2) 5,056 (18.9) Doetinchem (NL) 7,139 44.0 (11.8) 5.0 (0.2) C 1,101 (15.5) 68 (1.0) 80 (1.1) 2,584 (36.2) 1332 (22.6) Denmark 55,753 56.7 (4.4) 5.3 (0.3) P 0 1,610 (2.9) 317 (0.6) 11,594 (20.8) 9,667 (18.0) Oxford (UK) Health Conscious 47,208 44.5 (14.5) 5.3 (0.5) P 0 827 (1.8) 393 (0.8) 17,188 (36.4) 15,968 (34.7) Oxford (UK) General Health 7,221 53.1 (7.9) 5.6 (0.6) P 0 138 (1.9) 29 (0.4) 1,945 (26.9) 1,778 (25.2) Norway 35,829 48.2 (4.3) 6.2 (0.5) P 0 375 (1.0) 157 (0.4) 9,491 (26.5) 8,959 (25.4) Amsterdam/ Maastricht (NL) 14,920 42.3 (10.9) 6.2 (1.1) P 0 163 (1.1) 533 (3.6) 5,483 (36.7) 4,787 (33.7) Greece 25,997 53.2 (12.6) 7.7 (2.1) T 0 590 (2.3) na 1,832 (5.3) 792 (3.1) Potsdam (GE) 26,891 50.5 (9.0) 8.5 (0.9) P 4,282 (15.9) 827 (3.1) na 8,528 (31.7) 3,419 (15.7) Naples (IT) 4,947 50.3 (7.7) 8.7 (1.2) P 4,271 (86.3) 1 (0.0) 0 4356 (88.1) 84 (12.4) Florence (IT) 13,089 51.6 (7.7) 9.3 (1,1) P 0 230 (1.8) 108 (0.8) 2,883 (22.0) 2,545 (20.0) Umea (SW) 25,048 46.1 (10.3) 9.9 (0.3) P 0 759 (3.0) 1012 (4.0) 11,501 (45.9) 9,730 (41.8) Varese (IT) 11,797 51.6 (8.2) 11.1 (1.1) P/T 0 287 (2.4) 209 (1.8) 1,749 (14.8) 1,253 (11.1) Ragusa (IT)d 5,949 47.3 (7.6) - - 5,949 (100) - - 5,949 (100) -Turin (IT)d 9,749 50.2 (7.7) - - 9,749 (100) - - 9,749 (100) -Total 497,969 51.5 (9.9) 5.3 (2.4) 25,355 (5.1) 8,226 (1.7) 3,697 (0.7) 122,154 (24.5) 84,876 (18.4) Abbreviation: yrs - years, SD – standard deviation, na - no information available, C - 2ndassessment at study center; P - 2ndassessment by postal survey; T - 2nd
assessment by telephone interview.
aMultiple centers within a country were treated as a single study center, when length of follow-up and data collection methods did not differ and when
coordination took place out of one center (Spain, France, Denmark). In Norway and Greece only one research center was situated.
bPercentage corresponds to the overall response rates calculated according to the standard definitions used by the American Association for Public Opinion
Research (AAPOR) [20].
cFor calculation of the proportion non-response, baseline participants who were not (yet) approached, died or emigrated before the second assessment were
excluded (n = 37,278).
dRagusa and Turin did not contact any of their participants for a second assessment yet.
May et al. BMC Medical Research Methodology 2012, 12:148 Page 6 of 9
increasing with age [6,8,9]. Similar to what has been consistently reported in previous studies [1-4,6,9,13], we found lower response among participants living alone, i.e. single, divorced/separated or widowed. They depend on their intrinsic motivation to maintain participation in the study and might lack the encouragement of a partner. Furthermore, in agreement with others [3,13], who reported educational level as one of the most im-portant predictors of non-response, low education was associated with lower response. Reporting a less healthy lifestyle at baseline, i.e., physical inactivity, being a smoker and both, either absence of alcohol or heavy use, was related to higher non-response. Similar results for alcohol use were reported by Thomas et al. [11], who suggested that three-quarters of alcohol abstainers
Table 2 Multivariate odds ratios of non-response to a second assessment of body weight in the EPIC-PANACEA studya
Participants available for 2ndassessment (n = 460,691) Number of participants n Non-responders (n = 84,876) n (%) ORb 95% CI Sex Missing 0 Male 130,030 26,190 (20.1) 1.0 Female 330,661 58,686 (17.7) 0.92 0.90, 0.94 Age Missing 0 ≤40 years 50,789 14,911 (29.4) 1.0 41-60 years 317,177 51,997 (16.4) 0.48 0.47, 0.49 >60 years 92,725 17,968 (19.4) 0.51 0.50, 0.53 Marital status Missing 106,239 Married/living together 279,994 52,581 (18.8) 1.0 Living alonec 74,458 19,077 (25.6) 1.4 1.37, 1.43
Highest educational level
Missing 19,063
College or university 110,246 18,893 (17.1) 1.0
Other secondary school 100,618 15,447 (15.4) 0.93 0.90, 0.95 Vocational secondary
school
104,299 23352 (22.4) 1.08 1.05, 1.10 Primary school or less 126,465 22,300 (17.6) 1.35 1.31, 1.38
Cambridge physical activity index
Missing 65,002 Active 73,596 13,859 (18.8) 1.0 Moderately active 96,772 14,710 (15.2) 0.98 0.95, 1.01 Moderately inactive 137,438 20,802 (15.1) 0.99 0.96, 1.01 Inactive 87,883 14,593 (16.6) 1.15 1.12, 1.19 Smoking status Missing 9,722 Never 227,854 37,297 (16.4) 1.0 Former 122,690 23,209 (18.9) 1.02 1.00, 1.04 Current 100,425 22,452 (22.7) 1.33 1.30, 1.35 Alcohol consumption Missing 0
Light alcohol users 302,995 59,630 (19.7) 1.0
Non-users 61,316 10,467 (17.1) 1.18 1.15, 1.21
Moderate alcohol users 84,255 12,901 (15.3) 0.96 0.93, 0.98 Heavy alcohol users 12,125 1,878 (15.5) 1.12 1.06, 1.19
Cancer at baseline
Missing 16,618
No 423,646 76,910 (18.2) 1.0
Yes 20,427 3,954 (19.4) 0.86 0.81, 0.91
Table 2 Multivariate odds ratios of non-response to a second assessment of body weight in the EPIC-PANACEA studya (Continued)
Chronic disease at baselined
Missing 45,998
Healthy 378,342 63,115 (16.7) 1.0
Disease 36,351 7,027 (19.3) 1.33 1.27, 1.39
Cancer before 2ndweight assessment
Missing 0 No 448,198 81,752 (18.2) 1.0 Yes 12,493 3,124 (25.0) 1.39 1.33, 1.45 BMI Missing 334 18.5 - 25 kg/m2 236,019 43,404 (18.4) 1.0 < 18.5 kg/m2 6,868 1,451 (21.1) 1.16 1.09, 1.23 25 - 29.9 kg/m2 157,093 29,072 (18.5) 1.08 1.06, 1.10 ≥ 30 kg/m2 60,377 10,850 (18.0) 1.26 1.23, 1.29 Recruitment strategy Missing 0 Postal survey 353,699 71,436 (20.2) 1.0 Approached by elephone 76,924 2,546 (3.3) 0.16 0.15, 0.16 Requested to visit study center 30,068 10,894 (36.2) 2.7 2.58, 2.78
Mean follow-up time
Missing 0
0 - 4.0 years 160,750 15,867 (9.9) 1.0
4.1 - 8.0 years 230,155 51,978 (22.6) 3.00 2.91, 3.06
8.1 - 12.0 years 69,786 17,031 (24.4) 3.26 3.16, 3.36
Abbreviations: OR - odds ratio; CI - confidence interval.
aParticipants who were not (yet) approached, died or (e)migrated during
follow-up were not excluded in the present analyses.
b
A multivariate logistic regression model was used with response status (0 = responder; 1 = non-responder) as the dependent variable and all baseline characteristics, recruitment strategy and mean follow-up time as independent variables. All variables are mutually adjusted.
c
Single, divorced/separated, widowed.
were ex-drinkers, having given up drinking because of ill-health. Participants with a chronic disease at baseline were more likely to refuse participation in the follow-up survey, however, participants with cancer were more likely to respond. This might be due to the fact that the EPIC study was designed specifically to investigate causes of cancer and, therefore, (ex)cancer patients who already decided to participate at baseline were still willing to contribute to this study at a later time. In contrast, participants who developed cancer during follow-up were less likely to respond to an invitation for the second assessment.
Comparing responders with persons for whom a sec-ond body weight assessment was missing (i.e. death, (e) migrated, not yet contacted, non-responder) yielded ra-ther similar results. This may imply that future studies that assess relations between baseline characteristics and weight changes during follow-up should consider the possibility of selective non-response. However selective non-response does not automatically imply selection bias and thus distorted effect estimates. If there is selec-tion bias, statistical tools may help in adjusting, such as the method of 'inverse probability' [21,22]. Several other studies that investigated the magnitude of bias due to non-response showed that bias in these relationships was negligible [3,14].
Strengths of the present study are the large samples of participants from several European centres, the use of various methods of collecting the second assessment, different time intervals between the first and the second assessment and the use of standardized and validated baseline questionnaires across centres. Some limitations should be considered when interpreting our results. First, the determinants of attrition are based on baseline data, while some lifestyle factors might fluctuate or change over time. Second, in a cohort of half a million people misclassification of exact dates of vital status or migration may occur. Consequently, in some centers the non-response group may include persons already deceased or (e)migrated but not yet registered as such. Third, the selection of the study population in each EPIC centre was largely influenced by practical consid-erations. Therefore, the sample was not intended to be representative of each region and investigating cross-cultural differences in non-response was not possible. Fi-nally, we studied the response to a second assessment of anthropometric measures. In many centers, at the same time other lifestyle or nutritional data were collected. The type of information as well as the amount may also affect response.
Conclusions
In conclusion, in this large cohort study response to a second assessment, between 2–11 years after baseline,
was reasonably high and varied between centers accord-ing to follow-up time and recruitment strategy. Non-response was more frequent in participants who were young, living alone, less educated, of poorer health, reported an unhealthy lifestyle and had either a low or high BMI. Cohort studies, especially those with long follow-up, may enhance cohort maintenance by paying extra attention to groups with above-mentioned charac-teristics who are most unlikely to respond and by an active recruitment strategy using telephone interviews.
Competing interests
The authors declare that they have no competing interests. Authors' contributions
PHMP: principal investigator of the EPIC-PANACEA project and guarantor of the article; AMM, LEA and PHMP: conceived the current study; AMM, LEA, PHMP: responsible for the design of the study, analyses of data, interpretation of results; AMM, LEA drafting of the manuscript, taking into account the comments and suggestions of the coauthors; contributors from the collaborating centers (DR, ACV, AA, UK, AS, PO, NS, SR, TM, SR, SH, HB, MMB, MUJ, KO, NJW, CG, AT, JH, TJK, EAS, VH, JM, BH, EL, TB, FCC, MCBR, LR, MJS. MD, AB, JMH, AN, AT, DP, BP, TN, AM, RT, DA, HBBM, ER, PHMP): provided the original data, information on the respective populations, and advice on study design, analysis, and interpretation of the results; and all coauthors: had the opportunity to comment on the analysis and interpretation of the findings and approved the final version of the manuscript. All authors read and approved the final manuscript. Acknowledgements
This work was supported by the European Union, in the framework of the Public Health Programme (project number: 2005328). The work was further financially supported by the European Commission: Public Health and Consumer Protection Directorate 1993–2004; Research Directorate-General 2005-.”; Ligue contre le Cancer, Societé 3 M, Mutuelle Générale de l’Education Nationale, Institut National de la Santé et de la Recherche Médicale (INSERM) (France); German Cancer Aid, German Cancer Research Center, Federal Ministry of Education and Research (Germany); Danish Cancer Society (Denmark); Health Research Fund (FIS) of the Spanish Ministry of Health, The participating regional governments and institutions and the ISCIII of the Spanish Ministry of Health (RETICC DR06/0020) (Spain); Cancer Research UK, Medical Research Council, Stroke Association, British Heart Foundation, Department of Health, Food Standards Agency, the Wellcome Trust (United Kingdom); Greek Ministry of Health and Social Solidarity, Hellenic Health Foundation and Stavros Niarchos Foundation (Greece); Italian Association for Research on Cancer, National Research Council (Italy); Dutch Ministry of Public Health, Welfare and Sports, Dutch Ministry of Health, Dutch Prevention Funds, LK Research Funds, Dutch ZON (Zorg Onderzoek Nederland), World Cancer Research Fund (WCRF) (the The Netherlands); Swedish Cancer Society, Swedish Scientific Council, Regional Government of Skane (Sweden); Norwegian Cancer Society (Norway).
We would like to acknowledge the DiOGenes (Diet, Obesity, and Genes) project supported by the European Community (contract no. FOOD-CT-2005-513946) for collecting the follow-up data in five EPIC cohorts (i.e. Florence (Italy), Potsdam (Germany), Copenhagen and Arhus (Denmark) and Bilthoven (the Netherlands).
Author details
1
Julius Centre for Health Sciences and Primary Care, University Medical Centre Utrecht, Utrecht University, PO Box 85500, 3508, GA Utrecht, The Netherlands.2National Institute for Public Health and the Environment (RIVM), Bilthoven, The Netherlands.3Department of Epidemiology and
Biostatistics, School of Public Health, Imperial College London, London, United Kingdom.4Unit of Nutrition, Environment and Cancer, Catalan
Institute of Oncology, IDIBELL, Barcelona, Spain.5Medical Research Council, Epidemiology Unit, Cambridge, United Kingdom.6German Institute of
Human Nutrition Potsdam-Rehbrücke, Heidelberg, Germany.7Hellenic Health Foundation, Athens, Greece AND Department of Hygiene, Epidemiology and
May et al. BMC Medical Research Methodology 2012, 12:148 Page 8 of 9
Medical Statistics, School of Medicine, University of Athens, Athens, Greece.
8International Agency for Research on Cancer (IARC-WHO), Lyon, France. 9Division of Clinical Epidemiology, German Cancer Research Center,
Heidelberg, Germany.10Department of Epidemiology, School of Public Health, Aarhus University, Aarhus, Denmark.11Department of Cardiology,
Aalborg Hospital, Aarhus University Hospital, Aalborg, Denmark.12Danish
Cancer Society, Institute of Cancer Epidemiology, Copenhagen, Denmark.
13
Cancer Research UK Epidemiology Unit, University of Oxford, Oxford, United Kingdom.14Department of Public Health and Clinical Medicine,
Nutritional Research, Umeå University, Umeå, Sweden.15Department of
Surgery, Malmø University Hospital, Lund University, Malmø, Sweden.
16
Department of Clinical Science, Malmø University Hospital, Lund University, Malmø, Sweden.17Institute of Community Medicine, University of Tromsø,
Tromsø, Norway.18Institut National de la Santé et de la Recherche Médicale
(INSERM), ERI 20, EA 4045, Villejuif, France.19Institut Gustave Roussy, Villejuif,
France.20Public Health and Participation Directorate, Health and Health Care Services Council, Asturias, Spain.21Andalusian School of Public Health,
Granada, and CIBER de Epidemiology and Public Health (CIBERESP), Granada, Spain.22Public Health Department of Gipuzkoa, San Sebastian, Spain.23Public
Health Institute of Navarra, Pamplona, Spain.24Epidemiology Department, Council of Health and Consumer Affairs, Murcia& CIBER Epidemiología y Salud Pública (CIBERESP), Murcia, Spain.25Molecular and Nutritional
Epidemiology Unit, ISPO-Cancer Research and Prevention Institute, Florence, Italy.26Nutritional Epidemiology Unit, IRCCS Foundation, National Cancer Institute, Milan, Italy.27Dipartimento di Medicina Clinica e Sperimentale,
Università di Napoli, Naples, Italy.28Cancer Registry, Azienda Ospedaliera
"Civile M.P.Arezzo", Ragusa, Italy.
Received: 14 December 2011 Accepted: 20 September 2012 Published: 24 September 2012
References
1. de Graaf R, Bijl RV, Smit F, Ravelli A, Vollebergh WA: Psychiatric and sociodemographic predictors of attrition in a longitudinal study: The Netherlands Mental Health Survey and Incidence Study (NEMESIS). Am J Epidemiol 2000, 152(11):1039–1047.
2. Garcia M, Fernandez E, Schiaffino A, Borrell C, Marti M, Borras JM: Attrition in a population-based cohort eight years after baseline interview: The Cornella Health Interview Survey Follow-up (CHIS.FU) Study. Ann Epidemiol 2005, 15(2):98–104.
3. Alonso A, Segui-Gomez M, de IJ, Sanchez-Villegas A, Beunza JJ, Martinez-Gonzalez MA: Predictors of follow-up and assessment of selection bias from dropouts using inverse probability weighting in a cohort of university graduates. Eur J Epidemiol 2006, 21(5):351–358.
4. Drivsholm T, Eplov LF, Davidsen M, Jorgensen T, Ibsen H, Hollnagel H, Borch-Johnsen K: Representativeness in population-based studies: a detailed description of non-response in a Danish cohort study. Scand J Publ Health 2006, 34(6):623–631.
5. Harald K, Salomaa V, Jousilahti P, Koskinen S, Vartiainen E: Non-participation and mortality in different socioeconomic groups: the FINRISK population surveys in 1972–92. J Epidemiol Commun Health 2007, 61(5):449–454. 6. Slymen DJ, Drew JA, Elder JP, Williams SJ: Determinants of
non-compliance and attrition in the elderly. Int J Epidemiol 1996, 25(2):411–419.
7. de Marco R, Verlato G, Zanolin E, Bugiani M, Drane JW: Nonresponse bias in EC Respiratory Health Survey in Italy. Eur Respir J 1994, 7(12):2139–2145. 8. Pirzada A, Yan LL, Garside DB, Schiffer L, Dyer AR, Daviglus ML: Response
rates to a questionnaire 26 years after baseline examination with minimal interim participant contact and baseline differences between respondents and nonrespondents. Am J Epidemiol 2004, 159(1):94–101. 9. Badawi MA, Eaton WW, Myllyluoma J, Weimer LG, Gallo J: Psychopathology
and attrition in the Baltimore ECA 15-year follow-up 1981–1996. Soc Psychiatry Psychiatr Epidemiol 1999, 34(2):91–98.
10. Stang A: Nonresponse research–an underdeveloped field in epidemiology. Eur J Epidemiol 2003, 18(10):929–931.
11. Thomas MC, Walker M, Lennon LT, Thomson AG, Lampe FC, Shaper AG, Whincup PH: Non-attendance at re-examination 20 years after screening in the British Regional Heart Study. J Publ Health Med 2002, 24(4):285–291. 12. Sonne-Holm S, Sorensen TI, Jensen G, Schnohr P: Influence of fatness,
intelligence, education and sociodemographic factors on response rate in a health survey. J Epidemiol Commun Health 1989, 43(4):369–374.
13. Goldberg M, Chastang JF, Leclerc A, Zins M, Bonenfant S, Bugel I, Kaniewski N, Schmaus A, Niedhammer I, Piciotti M, et al: Socioeconomic,
demographic, occupational, and health factors associated with participation in a long-term epidemiologic survey: a prospective study of the French GAZEL cohort and its target population. Am J Epidemiol 2001, 154(4):373–384.
14. Boshuizen HC, Viet AL, Picavet HS, Botterweck A, van Loon AJ: Non-response in a survey of cardiovascular risk factors in the Dutch population: determinants and resulting biases. Publ Health 2006, 120(4):297–308.
15. Bengtsson C, Ahlqwist M, Andersson K, Bjorkelund C, Lissner L, Soderstrom M: The Prospective Population Study of Women in Gothenburg, Sweden, 1968–69 to 1992–93. A 24-year follow-up study with special reference to participation, representativeness, and mortality. Scand J Prim Health Care 1997, 15(4):214–219.
16. Vestbo J, Rasmussen FV: Baseline characteristics are not sufficient indicators of non-response bias follow up studies. J Epidemiol Commun Health 1992, 46(6):617–619.
17. Riboli E, Hunt KJ, Slimani N, Ferrari P, Norat T, Fahey M, Charrondiere UR, Hemon B, Casagrande C, Vignat J, et al: European Prospective Investigation into Cancer and Nutrition (EPIC): study populations and data collection. Publ Health Nutr 2002, 5(6B):1113–1124.
18. Davey GK, Spencer EA, Appleby PN, Allen NE, Knox KH, Key TJ: EPIC-Oxford: lifestyle characteristics and nutrient intakes in a cohort of 33 883 meat-eaters and 31 546 non meat-eaters in the UK. Publ Health Nutr 2003, 6(3):259–269.
19. Wareham NJ, Jakes RW, Rennie KL, Schuit J, Mitchell J, Hennings S, Day NE: Validity and repeatability of a simple index derived from the short physical activity questionnaire used in the European Prospective Investigation into Cancer and Nutrition (EPIC) study. Publ Health Nutr 2003, 6(4):407–413.
20. The American Association for Public Opinion Research: Standard definitions: Final dispositions of case codes and outcome rates for surveys. 6thed.
Lenexa, KS. 2009.
21. Greenland S: In Modern Epidemiology. 2nd edition. Edited by Rothman KJ, Greenland S. Philadelphia: Lippincott Williams and Wilkins; 1998:343–357. 22. Hernan MA, Hernandez-Diaz S, Robins JM: A structural approach to
selection bias. Epidemiology 2004, 15(5):615–625.
doi:10.1186/1471-2288-12-148
Cite this article as: May et al.: Determinants of non- response to a second assessment of lifestyle factors and body weight in the EPIC-PANACEA study. BMC Medical Research Methodology 2012 12:148.
Submit your next manuscript to BioMed Central and take full advantage of:
• Convenient online submission • Thorough peer review
• No space constraints or color figure charges • Immediate publication on acceptance
• Inclusion in PubMed, CAS, Scopus and Google Scholar • Research which is freely available for redistribution
Submit your manuscript at www.biomedcentral.com/submit