HAL Id: hal-01372842
https://hal.archives-ouvertes.fr/hal-01372842
Submitted on 27 Sep 2016
HAL is a multi-disciplinary open access
archive for the deposit and dissemination of sci-entific research documents, whether they are pub-lished or not. The documents may come from teaching and research institutions in France or abroad, or from public or private research centers.
L’archive ouverte pluridisciplinaire HAL, est destinée au dépôt et à la diffusion de documents scientifiques de niveau recherche, publiés ou non, émanant des établissements d’enseignement et de recherche français ou étrangers, des laboratoires publics ou privés.
High resolution remote sensing and heterogeneous data
analysis for local scale characterization of environmental
risk: an application to Chagas disease in endemic areas
Emmanuel Roux, A. de F. Venancio, Jean-François Girres, Cristina Romana
To cite this version:
Emmanuel Roux, A. de F. Venancio, Jean-François Girres, Cristina Romana. High resolution remote sensing and heterogeneous data analysis for local scale characterization of environmental risk: an application to Chagas disease in endemic areas. XIV Simpósio Brasileiro de Sensoriamento Remoto, INPE, 2009, Natal, Brazil. pp.7577-7586. �hal-01372842�
High resolution remote sensing and heterogeneous data analysis for local scale characterization of environmental risk: an application to Chagas disease in endemic
areas Emmanuel Roux1
Annamaria de Fatíma Venâncio2 Jean-François Girres1
Christina Romãna1,3 1
IRD, US140 ESPACE, Cayenne, French Guyana emmanuel.roux@ird.fr
2
Instituto de Meio Ambiente do Estado da Bahia, Centro de Desenvolvimento Sustentavel da Universidade de Brasilia, Salvador, Brazil
3
IRD, US140 ESPACE, Université Paris Descartes, Paris, France
Abstract. This paper deals with the characterization of the landscape composition and structure, by means of high resolution remote sensing, in order to explain the presence and the spatial distribution of Chagas disease vectors in a locality of the Iraquara municipality (Bahia, Brazil) where the disease is endemic. At a local scale, many other parameters can influence Chagas vector presence and dispersion dynamics, particularly dwelling, peri-domiciliary space and human behavior characteristics. In this study, these factors have been characterized by means of field works and inhabitant inquiries. Factorial analysis of mixed groups is then proposed to jointly analyze these numerous and heterogeneous data. Results shows that i) P. geniculatus species is associated with domiciliary units (DUs) situated far from the village center, with open peri-domiciliary spaces, particular landscape characteristics ; ii) presence of nymph(s) and adult vector(s) are clearly not associated to badly-kept houses and poor building materials; iii) one DU can be responsible for the dispersion of T. sordida vector in the adjacent DUs and iv) vector(s), especially adult(s), seems to be associated with the presence of hen, of henhouse and of lighting outside. This work shows the pertinence of the methodology and is a first step towards the definition of indicators of vector presence, density and spatial distribution that would permit to support the actions of the national Chagas disease control program and to set up alert systems.
Keywords: remote sensing, landscape characterization, factorial analysis of mixed groups, chagas disease sensoriamento remoto, caracterização da paisagem, análise fatorial de grupos mistos, Doença de Chagas.
1. Introduction
Environment plays a key role in the (re-)emergence and endemicity of many infectious vector-borne diseases. In fact, presence, density and spatial distribution of vectors and animal hosts depend on biotic and abiotic conditions. In this context, the importance of landscape composition (number and types of patches) and configuration (spatial relationships among patches) to disease dynamics is nowadays being explored [Ostfeld, Glass e Keesing 2005]. High resolution remote sensing appears to be an appropriate tool to deal with the relationships between environment and health by means of landscape epidemiology approach. In fact, remote sensing has been widely used for health issues monitoring, disease (re-)emergence explanation and prediction, risk map elaboration. However, effective contributions of remote sensing to health problematics are mitigated [Herbreteau et al. 2007] : high spatial resolution is rarely used, multispectral imagery is almost absent, NDVI is used in the majority of the studies without research of specific and potentially more pertinent indexes, and spatial scales at which studies are performed are not always appropriate to health issues. Another limit of the existing studies is the fact that they rarely jointly analyze the different factors that have a possible impact on the (re)-emergence and on the endemic character of the disease. Some studies try to overcome these limits by using high resolution imagery and developping specific indexes to identify and 4
próximo artigo
3
characterize ponds in the framework of the Rift Valley Fever transmission study [Lacaux et al. 2007].
In this paper, we illustrate the possibility of using high resolution remote sensing data, associated with a quantitative analysis of landscape composition and structure, to evaluate the relative impacts of environment, dwelling, peri-domiciliary space and inhabitant behavioral characteristics, on the explanation of the presence and spatial distribution of Triatominae (Hemiptera), the Chagas disease vectors.
2. American Trypanosomiasis or Chagas disease
Chagas disease is a vector-borne disease. The pathogen, Trypanosoma cruzi, is transmitted by insects of the Triatominae subfamily. There are about 45 insect species in Brazil, which have different and not well known ecological niches (palm trees, rocks anfractuosities, animal burrows, etc). Some species use to colonize dwellings and/or peri-domiciliary spaces, but environmental conditions, inhabitants behaviors, dwelling and peri-domiciliary characteristics that potentially influence vector behavior are not well known too.
3. Materials and Methods 3.1. Area of study
This study concerns the Santa Rita locality, a 660-inhabitant rural locality of Iraquara municipality, located in the northeast region of Brazil in the central area of the state of Bahia. This locality was selected on account of its demographic, geographical, environmental and socio-economic characteristics.
The annual medium temperature is 21,7◦C and the climate is characterized by alternation of dry, subhumid and semi-arid periods, with a rainy season from november to april. Long periods of drought are common and have significant impacts on the local agriculture. Santa Rita presents a mean annual pluviometric index of 750mm.
The Santa Rita relief is slightly undulating with many dolines. Dolines are depressions of the ground surface due to collapses of a karstic subsoil. Twenty four dolines have been identified just near Santa Rita. Some of these dolines present walls of rock. Many caves are present too, due the same geological characteristics. Dolines and caves constitute the habitat of many animal species as birds, rodents, marsupials, monkeys, reptiles and cheiroptera. These geological entities are supposed to be the habitat of some Chagas disease vectors too as they provide resting sites (crevices in walls of rock) and food (numerous animals providing blood meals). The flora of the region is mainly composed of “caatinga” but a mosaic of different vegetation types characterizes the land cover : “caatinga”, “cerrado”, semi-deciduous seasonal forest. These floristic ecosystems occupy different geological and geomorphological units. A high degree of anthropization contributes to a high degree of landscape division too. In fact, agriculture is the traditional and principal mean of subsistence, with the cultivation of beans and corn. The intensive agriculture is developing but still stays limited in intensity and concerns only castorbean, sugarcane and coffee. Irrigation and pesticide are essentially used for tomatoes, coffee and pepper cultivation.
3.2. Field works and inquiries
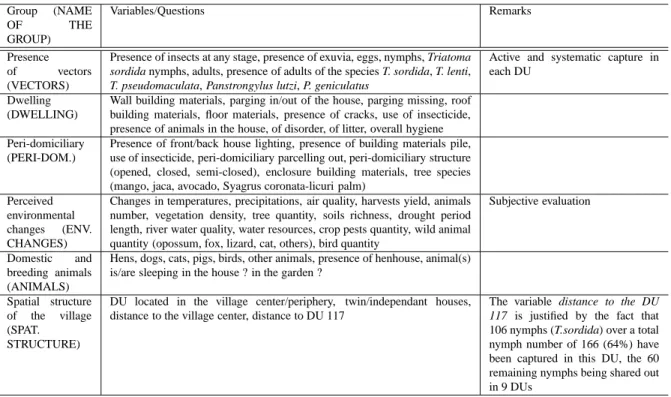
Numerous data have been obtained by means of observations, insect captures and inquiries of the head of each village family. This work has been done from October to December, 2007. The sampling unit is the domiciliary unit (DU) composed of a family, its dwelling and its private peri-domiciliary space. One hundred and thirty two DUs have been described. Table 1 lists variables and questions that have permitted to characterize DUs.
Table 1: Variables and questions for the characterization of the domiciliary units (DUs). Group (NAME OF THE GROUP) Variables/Questions Remarks Presence of vectors (VECTORS)
Presence of insects at any stage, presence of exuvia, eggs, nymphs, Triatoma
sordida nymphs, adults, presence of adults of the species T. sordida, T. lenti, T. pseudomaculata, Panstrongylus lutzi, P. geniculatus
Active and systematic capture in each DU
Dwelling (DWELLING)
Wall building materials, parging in/out of the house, parging missing, roof building materials, floor materials, presence of cracks, use of insecticide, presence of animals in the house, of disorder, of litter, overall hygiene Peri-domiciliary
(PERI-DOM.)
Presence of front/back house lighting, presence of building materials pile, use of insecticide, peri-domiciliary parcelling out, peri-domiciliary structure (opened, closed, semi-closed), enclosure building materials, tree species (mango, jaca, avocado, Syagrus coronata-licuri palm)
Perceived environmental changes (ENV. CHANGES)
Changes in temperatures, precipitations, air quality, harvests yield, animals number, vegetation density, tree quantity, soils richness, drought period length, river water quality, water resources, crop pests quantity, wild animal quantity (opossum, fox, lizard, cat, others), bird quantity
Subjective evaluation
Domestic and breeding animals (ANIMALS)
Hens, dogs, cats, pigs, birds, other animals, presence of henhouse, animal(s) is/are sleeping in the house ? in the garden ?
Spatial structure of the village (SPAT.
STRUCTURE)
DU located in the village center/periphery, twin/independant houses, distance to the village center, distance to DU 117
The variable distance to the DU
117 is justified by the fact that
106 nymphs (T.sordida) over a total nymph number of 166 (64%) have been captured in this DU, the 60 remaining nymphs being shared out in 9 DUs
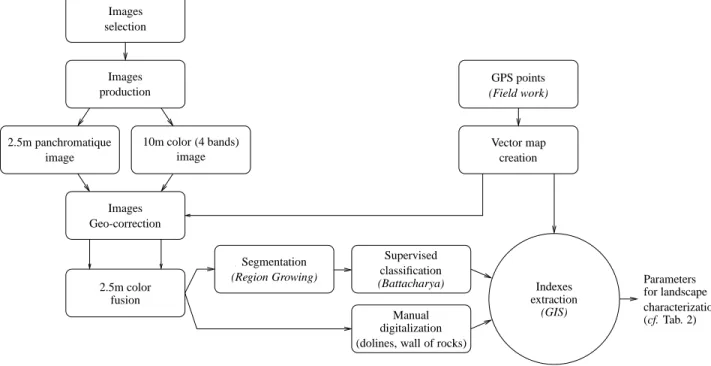
3.3. Remote sensing data
Two concomitant SPOT5 images, obtained on January 15, 2007, i.e. two weeks after the end of the field works and inquiries, have been exploited for the present study :
1. A 10 meters spatial resolution image in 4-band color mode : Red (R), Green (G), Near Infra-Red (NIR) and Middle Infra-Red (MIR);
2. A 2.5 meters spatial resolution image in panchromatic mode.
These images have been produced with radiometric correction and geometric correction, in UTM WGS84 map projection without ground control points (2A production level).
3.3.1. Images preprocessing and interpretation, land cover characterization
A 2.5m spatial resolution image in natural color has been obtained in order to perform photo interpretation of the scene. This permitted to manually delimit dolines and walls of rock (see Fig. 1(b)).
Given the landscape division and the will to characterize the proximate environment around each domiciliary unit, a region growing segmentation (area size = 30 pixels and similarity = 8) followed by a Bhattacharya supervised classification have been performed on the 2.5m spatial resolution fusioned image, with the free remote sensing image processing software Spring [Camara et al. 1996].
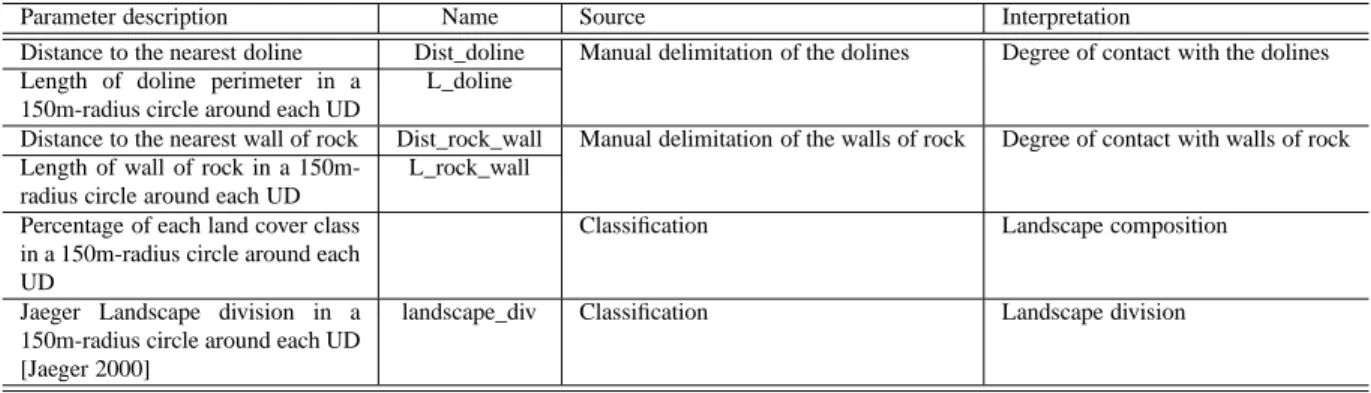
3.3.2. Landscape characterization
For each DU, several parameters for landscape characterization have been obtained by mean of GRASS, an open and free Geographic Information System (GIS)1. These parameters are
1GRASS Development Team, 2008. Geographic Resources Analysis Support System (GRASS) Software,
Version 6.3.0. http://grass.osgeo.org
presented in Tab. 2 and in Fig. 1(b). Parameters listed in Tab. 2 have been gather in a variable group named ENVIRONMENT.
Table 2: Parameters extracted from images interpretation and supervised classification of land cover (see Fig. 1).
Parameter description Name Source Interpretation
Distance to the nearest doline Dist_doline Manual delimitation of the dolines Degree of contact with the dolines Length of doline perimeter in a
150m-radius circle around each UD
L_doline
Distance to the nearest wall of rock Dist_rock_wall Manual delimitation of the walls of rock Degree of contact with walls of rock Length of wall of rock in a
150m-radius circle around each UD
L_rock_wall
Percentage of each land cover class in a 150m-radius circle around each UD
Classification Landscape composition
Jaeger Landscape division in a 150m-radius circle around each UD [Jaeger 2000]
landscape_div Classification Landscape division
All the steps needed for the landscape characterization by means of remote sensing are summarized in Fig. 2.
3.4. Data analysis
Due to the great quantity of data and the poor background knowledge on the relative discriminative power of the variables, the variable relationships and the DU resemblances and differences, multivariate factorial methods for data analysis seem to be particularly adequate. However, two methodological issues arise from the joint analysis of the available data :
• Both qualitative and quantitative variables are available ;
• Variables can be gather into coherent variable groups (see Tab. 1) that define particular “points of view“ on the problematic : Environment, dwelling, vector presence, peri-domiciliary space, perceived environmental changes, domestic and breeding animals, spatial structure of the village.
Multivariate factorial methods that permit the analysis of heterogenous and structured data are rare. In ecology, co-inertia analysis is proposed to link two or more tables [Dray, Chessel e Thioulouse 2003]. Here, we propose to applied another approach that generalizes Multiple Factorial Analysis (MFA) [Escofier e Pages 1994, Pagès 2002] and the Mixed Data Factorial Analysis (MDFA) [Pagès 2004], that both derive from Principal Component Analysis (PCA) and Multiple Correspondence Analysis (MCA). This method, proposed by Pages [Pagès 2002, Pagès 2004], is the Multiple Factorial Analysis for Mixed Groups. It is based on 1) the balancing of the variable inertia within each group and 2) the balancing of the groups. In practice, a PCA is realized on each group. Three situations arise, corresponding to three variable group characteristics (see [Pagès 2002, Pagès 2004]):
1. Quantitative groups (groups composed of only quantitative variables): A normed PCA is realized;
2. Qualitative groups : Qualitative variables are first expressed by their disjonctive coding, leading to indicator variables. Then for each kth indicator variable, a weight is defined as follows: wkkqual = N −
PN i yik
N ·J , N being the number of rows of the table, J the number of qualitative variables (”questions”) in the table and yik the membership value of the ith
Forest
Low density forest Tilled soil (TS) 1 TS 2 TS 3 TS 4 TS 5 Nude soil Wall of rock Doline (a) Dist_rock_wall Dist_doline L_doline L_rock_wall (b)
Figure 1: a) Results of the supervised land cover classification. White diamonds represent house locations b) For each house (squares), the following parameters are extracted from the manual digitalization of dolines and wall of rocks : distances to the nearest doline and wall of rocks (top), length of dolines perimeter in a 150-meters radius circle around the house (middle) and length of wall of rocks in a 150-meters radius circle around the house (bottom).
row for the kth indicator variable2. Then a weigted PCA is applied on the centered and
scaled indicator variables, with wkkqual as weights. This weighted PCA is equivalent to a MCA on the qualitative group;
3. Mixed groups (groups composed of both quantitative and qualitative variables): Qualitative variables are represented by their indicator variables (disjonctive coding). For each kth indicator variable, a weight is defined as follows: wmixedkk = 1 −
PN i yik
N . The weight associated with each quantitative variable is 1. Then a weigted PCA is applied on the centered and scaled variables (quantitative and indicator variables). These weights permits to balancing the inertia of qualitative and quantitative variables within each mixed group.
Then, a weighted PCA is applied to the whole table composed of all the groups, with, for each group, the inverse of the maximum eigen value of each separated PCA (on each group) as weight. This permits to balance the maximum inertia of each group (equal to 1) in the overall analysis. In other terms, each group is considered as equivalent, with no a priori knowledge on the relative importance of the groups. As this method is not implemented in any software yet, it as been implemented with the R development language [R-Development-Core-Team 2005] and its library FactomineR3.
2
yikis often equal to 1 or 0 (strict coding), but can be in the interval[0, 1] if a fuzzy coding is applied.
3Husson, F. and Lê, S. and Mazet, J. (2007) FactoMineR: Factor Analysis and Data Mining with R.
http://factominer.free.fr
Images selection Images production 2.5m panchromatique image 10m color (4 bands) image 2.5m color fusion Segmentation (Region Growing) Supervised classification (Battacharya) Manual digitalization (dolines, wall of rocks)
Indexes extraction (GIS) GPS points (Field work) Vector map creation Images Geo-correction Parameters for landscape characterization (cf. Tab. 2)
Figure 2: Images preprocessing and processing steps for landscape characterization
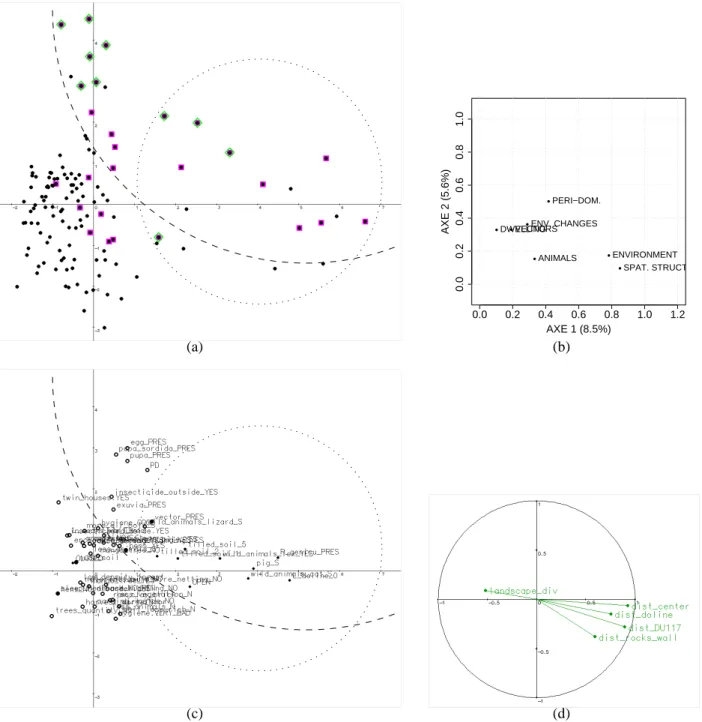
4. Results
Figure 3 shows DU projections on the first factorial plane. This plane represents 14% of the total data inertia (the first two factorial axes representing 8.45% and 5.55%, respectively),
i.e. a significant part in regards to the number of variables and modalitites (the table of
analysis comprises 184 columns). For each factorial axis, in order to facilitate interpretation of results, contributions of variables and modalities have been sorted in decreasing order and the cumulated sum of these sorted contributions have been computed. In fact, this permits to select only variables and modalities that contribute the most to an axis, up to a given cumulated contribution. Tables 3 and 4 list the variables and modalities that contribute the most to the first two factorial axes up to a cumulated contribution of 70%.
The first factorial axis discriminates (see Fig. 3(c) and Tab. 3) the 16 DUs situated far from the village center and far from dolines and walls of rock (these DUs are easily identifiable in Fig. 1(a)). These DUs are strongly associated with an open peri-domiciliary structure, tilled soils around the DUs, the presence of pigs, hens and of wild animals (foxes and cats), a less fragmentated landscape, and the presence of P. geniculatus Chagas vector. In fact, five adult vectors of the species P. geniculatus have been found and four of them have been found in DUs far from the village center (80%).
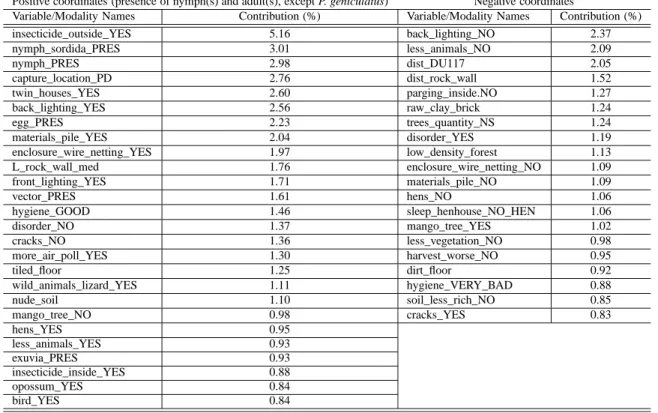
The second factorial axis is associated with the variables and modalities listed in Tab. 4. The presence of nymph(s) (especially of the species T. sordida) in the peri-domiciliary space is strongly associated with the positive values of this axis. The presence of vector(s), at any stage and of any species except P. geniculatus (P. geniculatus being linked to the first axis), is associated with the axis too. The other variables and modalities associated with this part of the factorial plane, and that tend to be link with the presence of at least one nymph and/or adult vector, describe well kept houses with the use of insecticide and of “good quality” building materials, with front and back lighting. Inhabitants of these houses mention the presence of wild animals like lizards and opposums. DUs characterized by the positive values of the second axis tend to be situated near the walls of rocks that potentially provide vector habitats and especially near the DUs 117, that, as mentionned in Tab. 1, has a particular status. In fact, a very important
(a) 0.0 0.2 0.4 0.6 0.8 1.0 1.2 0.0 0.2 0.4 0.6 0.8 1.0 AXE 1 (8.5%) AXE 2 (5.6%) VECTORS ENVIRONMENT ENV. CHANGES ANIMALS DWELLING PERI−DOM. SPAT. STRUCTURE (b) (c) (d)
Figure 3: a) Domiciliary Units (DUs) projected on the first factorial plane that represents 14% of the total data inertia (the first two factorial axis representing 8.45% and 5.55%, respectively). the dotted line circle surrounds DUs situated far from the village center. Squares correspond to DUs in which at least one vector (in any stage and of any species) has been found (The dotted line delimits the majority of these DUs). Diamonds represent DUs in which at least one nymph (of any species) has been found. b) Variable groups, c) Modalities and d) quantitative variables projected on the first factorial plane.
number of T. sordida nymphs (106 nymphs of the species T. sordida over a total of 166 nymphs) has been found in it, in the henhouse more precisely. This information indicates that T. sordida vectors tend to scatter from this DUs. In fact, nymphs of the same species have been found in four neighbouring DUs, at a distance lower than 70 meters.
As shown is Fig. 3 and in Tabs. 3 and 4, the majority of DUs with at least one vector of any
species and at any development stage are situated in the top right quarter of the first plane and are consequently characterized by the variables and modalities that significantly contribute to the first two axes and have coordinates of the same sign. These modalities (up to a cumulated contribution of 80% to the first two axes) are : presence of vector(s), presence of adult vector(s), use of front lighting, presence of hens and henhouse (for positive coordinates, i.e. presence of vector(s)) ; no hen and no henhouse (for negative coordinates, i.e. absence of vector).
Table 3: Variable and modality contributions to the first factorial axis
Positive coordinates (presence of P. geniculatus) Negative coordinates
Variable/Modality Names Contribution (%) Variable/Modality Names Contribution (%) dist_center 14.66 nude_soil 2.05 dist_DU117 13.69 landscape_div 1.88 peri_dom_OPEN 5.06 sleep_henhouse_NO_HEN 1.14 L_doline_NULL 4.57 hens_NO 1.14 dist_doline 3.98 peri_dom_CLOSED 1.14 pig_YES 2.94 tilled_soil_1 2.70 tilled_soil_2 2.65 dist_rocks_wall 2.46 wild_animals_fox_YES 2.20 wild_animals_cat_YES 2.19 P_genicu_PRES 1.80 tilled_soil_5 1.48 hens_YES 1.02 vector_PRES 0.97
Table 4: Variable and modality contributions to the second factorial axis
Positive coordinates (presence of nymph(s) and adult(s), except P. geniculatus) Negative coordinates
Variable/Modality Names Contribution (%) Variable/Modality Names Contribution (%) insecticide_outside_YES 5.16 back_lighting_NO 2.37 nymph_sordida_PRES 3.01 less_animals_NO 2.09 nymph_PRES 2.98 dist_DU117 2.05 capture_location_PD 2.76 dist_rock_wall 1.52 twin_houses_YES 2.60 parging_inside.NO 1.27 back_lighting_YES 2.56 raw_clay_brick 1.24 egg_PRES 2.23 trees_quantity_NS 1.24 materials_pile_YES 2.04 disorder_YES 1.19 enclosure_wire_netting_YES 1.97 low_density_forest 1.13 L_rock_wall_med 1.76 enclosure_wire_netting_NO 1.09 front_lighting_YES 1.71 materials_pile_NO 1.09 vector_PRES 1.61 hens_NO 1.06 hygiene_GOOD 1.46 sleep_henhouse_NO_HEN 1.06 disorder_NO 1.37 mango_tree_YES 1.02 cracks_NO 1.36 less_vegetation_NO 0.98 more_air_poll_YES 1.30 harvest_worse_NO 0.95 tiled_floor 1.25 dirt_floor 0.92 wild_animals_lizard_YES 1.11 hygiene_VERY_BAD 0.88 nude_soil 1.10 soil_less_rich_NO 0.85 mango_tree_NO 0.98 cracks_YES 0.83 hens_YES 0.95 less_animals_YES 0.93 exuvia_PRES 0.93 insecticide_inside_YES 0.88 opossum_YES 0.84 bird_YES 0.84
Groups of variables can also be represented on the factorial planes (see Fig. 3(b)). On the αth factorial axis, the coordinate of a group is equal to the sum of the contributions of the variables that define the group, weighted by the αtheigen value of the global PCA. Figure 3(b) confirms that the spatial structure of the village contributes a lot to the first axis and that the
immediate environment around DUs, characterized by means of remote sensing, is significantly correlated with the situation of the DUs in relation to village center (more the house is far from the village center, more tilled soils there are, less nude soil there is and less fragmented is the landscape).
In summary :
• P. geniculatus have been especially found in DUs far from the village center, associated to an open peri-domiciliary space, particular landscape characteristics and the presence of pig(s) (the presence of pig can be simply explained by the important distance to the village center that permits pig breeding);
• Presence of nymph(s) and adult vector(s) are clearly not associated to badly-kept houses and poor building materials;
• DU 117 can be responsible for the dispersion of T. sordida in the adjacent DUs;
• Presence of vector(s), especially of adult(s), seems to be associated with the presence of hen, of henhouse and of lighting outside.
5. Discussion and conclusion
These results are preliminary and have to be confirm and quantified by additional analysis, especially by considering DUs far from the village center as supplementary individuals. The link between the presence of tilled soils, a less fragmented landscape and the presence of P.
geniculatus is not explained yet and has to be investigated.
The fact that the presence of nymph(s) and adult vector(s) are not associated to badly-kept houses and poor building materials suggests that the presence of Chagas disease vectors is not associated to low socio-economic groups and poverty. This result is in opposition to a wide-spread idea in the population. However, it objectivizes the observations made by many health professionals.
A limit of this work is that it corresponds to only one date in time. Without time series data and given the local scale of the study, no climatic parameter has been considered, as such parameters would not have been spatially discriminant. We can justify such a single-date study by the fact that insect captures have been performed actively and exhaustively within each DUs.
Despite these limitations, results tend to reinforce the idea that there exists at least two synanthropic cycles of the Chagas disease vectors, associated with different land cover organization levels (the one associated with DUs far from the village center and P. geniculatus and the one associated with the village center and the other vector species). These two cycles could be assimilated to two distinct eco-epidemiological systems with different indicators of species circulation. Consequently, this work is a first step towards the definition of indicators of vector presence, density and spatial distribution that would permit to set up alert systems and to support the actions of the national Chagas disease control program.
The richness of the obtained results shows the interest of associating i) high remote sensing data and spatial analysis for the characterization of landscape composition and structure, and iii) heterogenous data analysis, by means of exploratory factorial methods, for the data interpretation and the integration of pluri-disciplinary points of view. This methodology seems to be particularly adapted to the study of eco-epidemiological systems.
Acknowledgements
SEAS-Guyane project provided the SPOT5 image.
Field works have been realised by A. F. Venâncio during her PhD and have benefited from different methodological supports elaborated during the CNPq-IRD program “Ecologie du paysage, dynamique des agroécosystèmes et complexes pathogènes : la définition du risque éco-épidémiologique dans le cas de la trypanosomose américaine, EDCTA” (2002-2004).
Brazilian institutions (IBAMA, CECAV, Ministério da Saúde, Comitê de Ética em Pesquisa and Secretaria de Meio Ambiente e Recursos Hídricos do Estado da Bahia - SEMARH, Superintendência de Biodiversidade, Florestas e Unidades de Conservação - SFC) gave their autorisations to make field work in the APA.
6. References
References
CAMARA, G. et al. Spring: Integrating remote sensing and gis by object-oriented data modelling. Computers & Graphics, v. 20, n. 3, p. 395–403, 1996.
DRAY, S.; CHESSEL, D.; THIOULOUSE, J. Co-inertia analysis and linking of ecological data tables. Ecology, v. 84, n. 11, p. 3078–3089, 2003.
ESCOFIER, B.; PAGES, J. Multiple factor analysis (afmult package). Computational Statistics & Data Analysis, v. 18, n. 1, p. 121–140, 1994. Disponível em: <{http://www.sciencedirect.com/
science/article/B6V8V-45GN701-8/2/9b5a5ae3ffeebda5c61e3e9610102f7d}>.
HERBRETEAU, V. et al. Thirty years of use and improvement of remote sensing, applied to epidemiology: From early promises to lasting frustration. Health & Place, v. 13, n. 2, p. 400–403,
2007. Disponível em: <{http://www.sciencedirect.com/science/article/
B6VH5-4K3D38H-2/2/2fb79cbcde7ae6b23fab32a7d475114d}>.
JAEGER, J. A. G. Landscape division, splitting index, and effective mesh size: new measures of landscape fragmentation. Landscape Ecology, v. 15, n. 2, p. 115–130, 2000.
LACAUX, J. et al. Classification of ponds from high-spatial resolution remote sensing: Application to rift valley fever epidemics in senegal. Remote Sensing of Environment, v. 106, n. 1, p.
66–74, 1 2007. Disponível em: <http://www.sciencedirect.com/science/article/B6V6V-4M1TT2J-1/1/02f78188b78ad7808814fb8f568c469f>.
OSTFELD, R. S.; GLASS, G. E.; KEESING, F. Spatial epidemiology: an emerging (or re-emerging) discipline. Trends in Ecology & Evolution, v. 20, n. 6, p. 328–336, 6 2005. Disponível em: <http://www.sciencedirect.com/science/article/B6VJ1-4FTXXK1-2/2/4387635de3fe9ca91e3b9b44eb9af4ba>.
PAGèS, J. Analyse factorielle multiple appliquée aux variables qualitatives et aux données mixtes. Revue de statistique appliquée, v. 50, n. 4, p. 5–37, 2002.
PAGèS, J. Analyse factorielle de données mixtes. Revue de Statistique Appliquée, v. 52, p. 93–111, 2004.
R-DEVELOPMENT-CORE-TEAM. R: A language and environment for statistical computing. Vienna, Austria, 2005. ISBN 3-900051-07-0. Disponível em: <{http://www.R-project.org}>.