HAL Id: hal-01744748
https://hal-amu.archives-ouvertes.fr/hal-01744748
Submitted on 27 Mar 2018
HAL is a multi-disciplinary open access
archive for the deposit and dissemination of
sci-entific research documents, whether they are
pub-lished or not. The documents may come from
teaching and research institutions in France or
abroad, or from public or private research centers.
L’archive ouverte pluridisciplinaire HAL, est
destinée au dépôt et à la diffusion de documents
scientifiques de niveau recherche, publiés ou non,
émanant des établissements d’enseignement et de
recherche français ou étrangers, des laboratoires
publics ou privés.
changes in ecosystem service supply
Ana Paula García-Nieto, Ilse Geijzendorffer, Francesc Baró, Philip Roche,
Alberte Bondeau, Wolfgang Cramer
To cite this version:
Ana Paula García-Nieto, Ilse Geijzendorffer, Francesc Baró, Philip Roche, Alberte Bondeau, et al..
Impacts of urbanization around Mediterranean cities: changes in ecosystem service supply. Ecological
Indicators, Elsevier, 2018, 91, pp.589-606. �hal-01744748�
1
Impacts of urbanization around Mediterranean cities: changes in ecosystem service supply
1
Authors: Ana Paula García-Nieto1,2, Ilse R. Geijzendorffer1,3, Francesc Baró4, 5, Philip K. Roche6, Alberte
2
Bondeau1, Wolfgang Cramer1
3
1 Institut Méditerranéen de Biodiversité et d’Ecologie marine et continentale (IMBE), Aix Marseille Université,
4
CNRS, IRD, Avignon Université, Technopôle Arbois-Méditerranée, Bât. Villemin – BP 80, F-13545
Aix-en-5
Provence cedex 04, France
6
2 FRACTAL collective, San Remigio 2, 28022 Madrid, Spain.
7
3 Tour du Valat, Research Institute for the conservation of Mediterranean Wetlands, Le Sambuc, 13200 Arles,
8
France
9
4 Institute of Environmental Science and Technology (ICTA), Universitat Autònoma de Barcelona (UAB),
10
Edifici Z (ICTA-ICP), Carrer de les Columnes s/n, Campus de la UAB, 08193 Cerdanyola del Vallès, Spain
11
5 Hospital del Mar Medical Research Institute (IMIM), Carrer Doctor Aiguader 88, 08003 Barcelona, Spain
12
6 IRSTEA, UR RECOVER, 3275 Route de Cézanne, CS 40061, 1382 Aix-en-Provence cedex 05, France
13
Abstract
14
Urbanization is an important driver of changes in land cover in the Mediterranean Basin and it is likely to impact
15
the supply and demand of ecosystem services (ES). The most significant land cover changes occur in the
peri-16
urban zone, but little is known about how these changes affect the ES supply. For eight European and four North
17
African cities, we have quantified changes in peri-urban land cover, for periods of sixteen years (1990-2006) in
18
the Northern African, and twenty-two years (1990-2012) in the European cities, respectively. Using an
expert-19
based method, we derived quantitative estimates of the dynamics in the supply of twenty-seven ES. The nature
20
of land cover changes slightly differed between European and North African Mediterranean cities, but overall it
21
increased in urban areas and decreased in agricultural land. The capacity of the peri-urban areas of
22
Mediterranean cities to supply ES generally reduced over the last 20-30 years. For nine ES the potential supply
23
actually increased for all four North African cities and three out of the eight European cities. Across all cities, the
24
ES timber, wood fuel and religious and spiritual experience increased.
25
Given the expected increase of urban population in the Mediterranean Basin and the current knowledge of ES
26
deficits in urban areas, the overall decrease in ES supply capacity of peri-urban areas is a risk for human
well-27
being in the Mediterranean and poses a serious challenge for the Sustainable Development Goals in the
28
Mediterranean basin.
2
Keywords30
Land cover; population; urban; rural; spatial analysis; trend; nature’s contributions to people.
31
Paper content (8568 total words): Abstract (239) + Main body (total words 5668= Introduction (1003) + M&M
32
(1754) + Results (1180) + Discussion (1679) + Conclusions (52)) + Acknowledgements (89) + References
33
(2045) + Figures (342) and Tables (185).
34
The manuscript contains 9 Figures, 3 Tables, 65 References and 7 online appendices.
3
1. Introduction
36
Approximately two thirds of the world’s population (i.e., 6,4 billion people for the median projection) and 84%
37
in Europe will be living in urban areas by 2050. In 2014 already more than half of the global population was
38
urban, while in Europe this was 70% (Kabisch and Haase, 2011; United Nations, 2015a, 2014). The increase in
39
total population entails a corresponding increase in demand for natural resources (MA, 2005), particularly for
40
energy and water. The demand for water is expected to increase with 55% between 2000 and 2050 (United
41
Nations World Water Assessment Programme, 2014). The effect of urban population growth on peri-urban
42
landscapes is expected to be particularly prominent since urban land cover increases even faster than could be
43
expected from demographic pressure, resulting in substantial land use conversions (Angel et al., 2011; Seto et
44
al., 2013, 2012, 2011).
45
Urban populations in countries around the Mediterranean Sea increased from 152 million to 315 million
46
between 1970 and 2010 (an average rate of 1.9 % per year) (UNEP/MAP, 2012). By 2030, the Mediterranean
47
Basin will be the global biodiversity hotspot with the highest percentage of urban land (5%) (Elmqvist et al.,
48
2013). Urbanization rates have been accelerated by environmental change; for example, intense drought
49
conditions contributed to a rural exodus in Morocco between 1980 and 1990, and in Algeria and Tunisia in 1999
50
(FAO, 2001; Hervieu and Thibault, 2009). Tourism and housing development have led to the development of
51
infrastructure close to coastal areas and near culturally important cities (EEA, 2011; Houimli, 2008).
52
Mediterranean cities are considered attractive places to settle for retirees from northern Europe
(Membrado-53
Tena, 2015), and for return migrants to the Maghreb countries (Cassarino, 2008).
54
The growth of urban areas often takes place at the expense of agricultural land and this can potentially lead to
55
environmental degradation and socio-economic challenges (Orgiazzi et al., 2016). Although probably the most
56
studied, the direct conversion of agricultural land into urban land is only one of the many impacts of urbanization
57
on the structure and function of ecosystems and their services (McDonnell and Hahs, 2008; Modica et al., 2012).
58
Examples of other impacts of urbanization include changes in demand patterns (Bennett et al., 2015;
García-59
Nieto et al., 2013; Schulp et al., 2014), or the infrastructure construction for water distribution facilities, energy
60
plants and internet connection (Kasanko et al., 2006; Seto et al., 2012), agricultural land abandonment (Hasse
61
and Lathrop, 2003; Hervieu and Thibault, 2009) or the protection of traditional landscapes with the aim to
62
maintain the aesthetic quality (Baró et al., 2016). Urbanization may also affect the diversity of the landscape,
63
with agricultural land being managed by hobby farmers rather than for commercial production (Jarosz, 2008;
64
Zasada, 2011).
65
As these examples show, the influence of urban areas on ecosystems extends well beyond the urban boundaries
66
(Lead et al., 2005), but it is unclear how the changes in the peri-urban landscapes affect human well-being. A
67
growing number of studies of human well-being and quality of life in urban areas focus on the benefits provided
68
by natural elements within cities, so called urban ecosystem services (Bolund and Hunhammar, 1999; Kremer et
69
al., 2016). Many of these studies have found that the natural elements currently present in cities often do not
70
seem to provide ecosystem services (ES) in sufficient quantities in comparison to the demand for these services
71
(Folke et al., 1997; Jansson, 2013). Baró et al. (2015) have recently shown mismatches between ES in supply
72
and demand for five European cities. These mismatches may depend on many factors, e.g. differences in spatial
73
distribution of goods and needs or access restrictions to resources for particular groups, such as women
4
(Geijzendorffer et al., 2015). Some of these factors can be addressed through governance or land use
75
management (Jansson, 2013). Potentially, land cover changes around cities affect ES supply, and these changes
76
may therefore potentially reduce or enhance deficits for ES within cities.
77
The objective of this study is to assess how growing urban areas in the Mediterranean Basin modify the
peri-78
urban landscapes and, consequently, ES supply. With the current urban population being expected to increase to
79
385 million people by 2025 (UNEP/MAP, 2012) and the objective of improved human well-being of the
80
Sustainable Development Goals (United Nations, 2015b), an increase of ES is required for this growing urban
81
population. Therefore, there is a particular need to assess the recent dynamics in ES supply, both within cities
82
and in their peri-urban areas. The European Mediterranean areas are estimated to be particularly vulnerable with
83
respect to ES supply, mostly due to climate and land use change (Schröter et al., 2005). Although similar studies
84
for the north-African Mediterranean countries are missing (Nieto-Romero et al., 2014), it is highly likely that
85
these countries are subject to similar, if not higher, anthropogenic pressures, experience more rapid population
86
increases and are undergoing significant landscape changes. The importance of this knowledge gap goes beyond
87
its implications for regional assessments, by additionally increasing the uncertainty of supra-regional
88
assessments of sustainable futures.
89
The need to evaluate land use and land cover changes and their impacts for future conditions is increasingly
90
being recognized (EEA, 2011; Fichera et al., 2016). To inform land management improvements, land use - land
91
cover assessments should take into account spatial and temporal patterns along urban-rural gradients (Kroll et al.,
92
2012). Previous land use - land cover assessments in the Mediterranean have focused on areas where spatial data
93
was available and, as a consequence, the north-African region has received little attention (Haase et al, 2014;
94
Luederitz et al., 2015). Also, most studies to date focus on single city case studies and are limited to the dense
95
urban fabric. A multi-city analysis therefore fills an important knowledge gap by allowing for a comparison of
96
the impacts of urbanization in peri-urban land and its consequences for ES supply in the Mediterranean Basin.
97
For this study we selected both European and north-African Mediterranean cities: eight Mediterranean European
98
cities (Lisbon, Madrid, Barcelona, Marseille, Florence, Rome, Athens, Thessaloniki) and four Northern African
99
cities (Nabeul, Sfax, Tunis, Rabat).
5
2. Material and methods
101
For this study, we analyzed: 1) whether land cover changes around cities differed significantly from trends at
102
national level; 2) whether different specific conversions of land cover are common for groups of cities occurred
103
over time and finally 3) whether the spatio-temporal supply patterns of ES over the period 1990 – 2012 were
104
shared among these Mediterranean cities, depending on data availability.
105
The assessment was carried out in six steps. First, we selected twelve major Mediterranean cities as case studies.
106
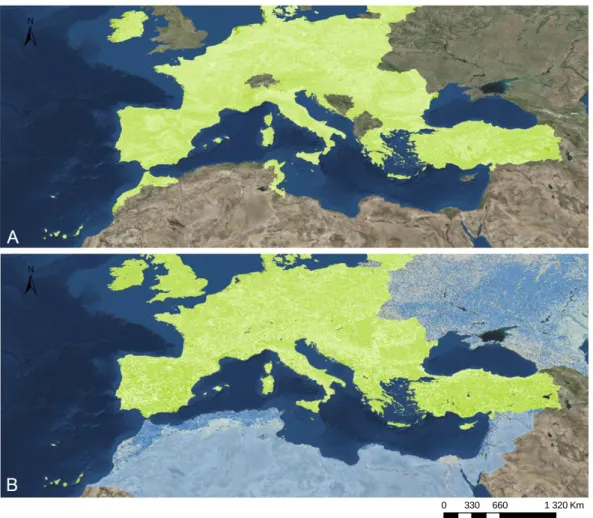
We used a systematic approach to define the peri-urban area for each city. Based on time series of available land
107
cover maps (Fig. 1), we assessed land cover changes in each peri-urban area and we compared them with
108
national dynamics per country. In addition, we identified the main patterns in land cover changes across all
peri-109
urban areas. Finally, we identified changes in land cover with expert based estimates of ES supply (Stoll et al.,
110
2015) and searched for specific or general dynamics in ES supply.
111
Data were available for the period 1990-2006 for Northern African cities, and for 1990-2012 for European cities
112
(Table 1). These periods allowed for the analysis of important dynamics and they correspond to the used
expert-113
based ES estimates (see below).
114
-Insert Fig. 1 around here -
115
2.1.
Selection of Mediterranean cities116
In the selection of cities we aimed to achieve a geographical distribution in the Mediterranean biogeographical
117
region (Olson et al., 2001) (Fig. 2), with a special attention to include both cities on northern and southern
118
Mediterranean shores. An additional search criterion was that land cover data should be available on at least two
119
moments in time. These criteria allowed for the selection of twelve cities in total, four in Northern Africa
120
(Nabeul, Sfax, Tunis, Rabat) and eight in Southern Europe (Lisbon, Madrid, Barcelona, Marseille, Florence,
121
Rome, Athens, Thessaloniki).
122
Spatial land cover data is available for the entire Mediterranean basin, but the categories, spatial resolution and
123
time series differ (Fig. 1). CORINE Land Cover (CLC) (Feranec et al., 2016) is a spatial database with a
124
resolution of 100 m and it is available for all European countries for the years 1990, 2000, 2006 and 2012 (Table
125
1). For the North African countries, CLC is available only for 1990. We used GlobCorine Land Cover (GLC)
126
(Bontemps et al., 2009) to include another point in time (2006) for these countries. The GLC land cover map was
127
developed by the European Environmental Agency and European Space Agency attempting to ensure
128
compatibility with CLC (Appendix 1).
129
- Insert Fig. 2 around here -
130
2.2.
Defining the peri-urban areas131
There are many different approaches to define the urban and peri-urban areas of a city (Orgiazzi et al., 2016).
132
For our study we searched for a simple, yet objective delineation of the urban areas that could be adapted to
133
include peri-urban areas. We defined the peri-urban area as the rural area located in proximity around the urban
134
area. In addition, the delineation method should be able to deal with the differences in data resolutions between
135
the European countries and the north-African Mediterranean countries. The approach published by (Kasanko et
136
al., 2006) assumes a fixed relationship to estimate the boundary of the urban area, separating it into the urban
6
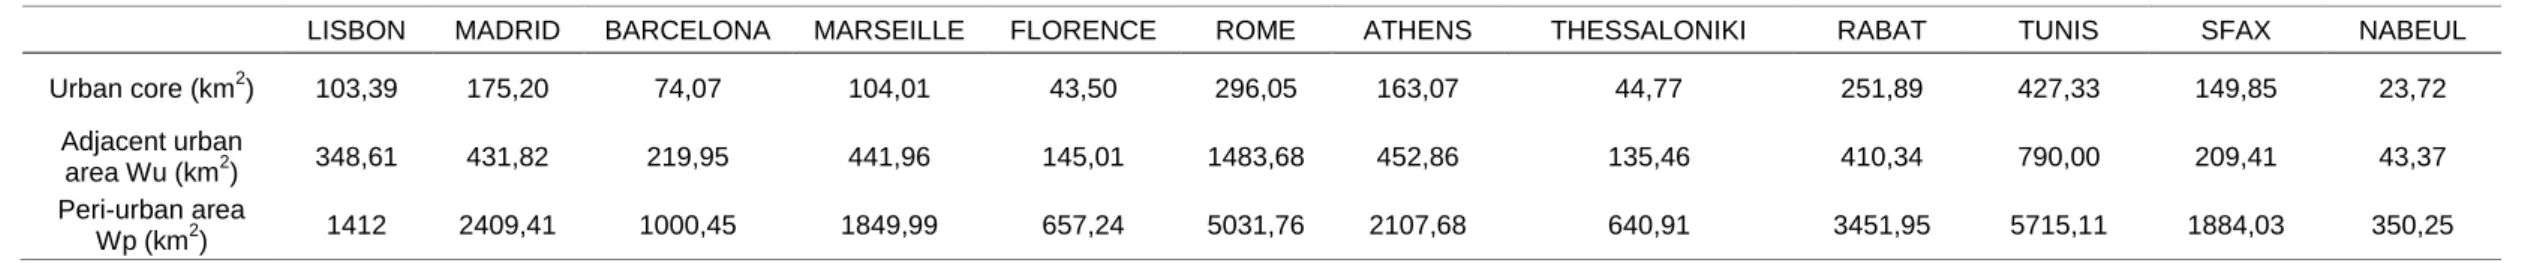
core area (A) and the adjacent urban area (Wu) ( ). For our study, we used this method to
138
additionally define the peri-urban areas (Wp). To parameterize the equation of Kasanko et al. (2006) for the
139
boundary of the peri-urban area (Wp), we used the peri-urban estimate published by Kroll et al. (2012), obtaining
140
a general equation for peri-urban areas: (see Fig. 3). By using these criteria, the width of the
141
adjacent urban area and the peri-urban area are assumed to depend only on the area of the urban core in each
142
city. Table 2 shows the resulting urban core areas and the corresponding Wu and Wp areas for 2006.
143
The urban core area (A) was computed for the Mediterranean cities using the urban land cover determined by
144
CLC and GLC using 2006 as reference time period. In the case of CLC, from the 44 land cover classes
145
(Appendix 2), we selected the polygons belonging to continuous and discontinuous urban fabric (categories 111
146
and 112) whose centroid was inside the administrative boundary of the city. From the fourteen land cover classes
147
of GLC (Appendix 1), class 10 (urban and associated areas) was used to determine the urban core area. In a
148
second step, we repeated this process including those polygons whose centroid was within a radius of 1 km from
149
the selected urban polygons, to calculate the final size and location of urban core area (A).
150
- Insert Fig. 3 around here -
151
2.3.
Identification of land cover changes152
Focusing the analysis on the peri-urban area (Wp), we identified land cover changes from 1990 to 2012 for the
153
European cities and from 1990 to 2006 for Northern African cities. Spatial land cover data was extracted for the
154
different time periods in each city and its belonging country, considering the Mediterranean biogeographical
155
region boundaries (Olson et al., 2001). The land cover data (area by land cover category) for each year in each
156
Wp area was normalized using the size of each peri-urban area, to be comparable across the different case
157
studies. The same normalization was made for each country based on the proportion of that country classified as
158
Mediterranean. In the remainder of this text we will refer to this area as the “national area”. The spatial
159
information was analyzed using ArcGIS 10.2.2 (ESRI, 2013).
160
To allow for the comparison between land cover categories from CLC (1990) and GLC (2006) in North Africa,
161
we developed weighing factors using Andalusia and Sicily as most closely representative sampling sites for the
162
Northern African Mediterranean setting. The spatial information of CLC and GLC in 2006 was intersected and
163
extracted to measure the contributions of each CLC category in each GLC class. To transform the spatial GLC
164
information of North African cities into information on each of the 44 CLC classes, we defined Xx as the area of
165
a specific GLC category and computed weighing factors (Wx) based on how the GLC categories in Andalusia
166
and Sicily were composed of the different CLC categories. We applied these weighing factors in all calculations
167
on North African areas to transform all GLC data into CLC data to allow for multiplication with the Stoll
168
capacity matrix. This means that the surface of each CLC category (Yx) is equal to a multiplication of the surface
169
(km2) for each GLC category (Xx) by weighing factors (Wx) (Equation 1).
170
Equation 1:
171
For the statistical analysis, the CLC categories were summarized in 7 different CLC groups (Table 3). To obtain
172
the urbanization trends in Mediterranean cities, we estimated the total standardized surface by CLC group
173
coming from Wp and compared it with the total standardized land cover from the respective Mediterranean parts
174
of countries (Portugal, Spain, France, Italy and Greece; Tunisia and Morocco) over the different periods.
7
Assessments for Europe and North Africa follow the same methods, but were applied separately because the
176
uncertainties and applied methods for the input data are different.
177
178
2.4.
Conversion of land cover changes into ecosystem services supply dynamics179
Following an approach developed by Burkhard et al. (2009, 2012), we related land cover data to expert-based
180
values of the capacity for ES supply. In a recent study, Stoll et al. (2015) developed an ES supply capacity
181
matrix based on CLC types combined with expert-based estimates of the supply capacity for thirty-one ES for
182
European countries. Capacity estimates for ES supply range from 0 (no relevant capacity of the land cover type
183
to provide this particular ecosystem service) to 5 (very high capacity).
184
To assess how land cover changes around the case study cities influence ecosystem service supply over time, we
185
translated our land cover changes into ES dynamics using the ES supply matrix published by Stoll et al. (2015).
186
Estimates for each ES (ESx) at different time periods in every peri-urban area were calculated by multiplying the
187
area of each CLC class (Xx) by the corresponding ES value from ES matrix (ESstollxn) (Equation 2). The
188
resulting ES assessment included twenty-seven ES supplied by peri-urban landscapes.
189
Equation 2:190
191
2.5.
Statistical analysis192
The chosen statistics in this study responded to type of variables, sampling distribution and scientific objectives:
193
1) analysis of land cover changes around cities and comparison with trends at national level; 2) identification of
194
common specific conversions of land cover among cities over time; and 3) assessment of spatio-temporal supply
195
patterns of ecosystem services over the period 1990 – 2012 in Mediterranean peri-urban areas.
196
For each objective, a group of statistical analysis was conducted. To assess whether land cover change patterns
197
around cities differ from trends at the national level, the standardized total surface of land cover groups was
198
statistically compared over time. For this purpose, we selected the non-parametric Wilcoxon test and the
199
parametric Two-sample t-test. According to sampling distribution of CLC and paired groups, non-parametric
200
Wilcoxon test was suitable for the case of permanent crops, complex cultivation patterns and shrub and/or
201
herbaceous. Based on the assumptions of normal sampling distribution and paired groups, the parametric
Two-202
sample t-test was conducted for urban, non-irrigated and irrigated arable land, and forest land cover groups.
203
Multivariate analyses were conducted to identify land cover changes over time and to detect spatio-temporal
204
trends in ES supply around Mediterranean cities. Variables included land cover data for European cities (for the
205
years 1990, 2000, 2006 and 2012, see Appendix 3) and data for North African cities (for 1990 and 2006, see
206
Appendix 4). The data for the European cities was assessed using Within-class Correspondence Analysis (WCA)
207
(Benzécri, 1983; Chessel et al., 2003) through the “within.coa function” in the R package ade4 (RStudio, 2012).
208
Data for the European and North-African cities was analyzed separately due to the differences in the input data
209
(as discussed in section 2.3). Changes on ES supply in peri-urban areas over time were estimated conducting a
210
Within-class Principal Component Analysis (WCP) (Benzécri, 1983; Chessel et al., 2003), evaluating separately
211
ES estimates for European and North African peri-urban areas (see Appendix 5 and 6).
8
WCA and WCP are similar to standard Correspondence Analysis with a single constraining factor to remove
213
(Chessel et al., 2003). As strong differences between cities may mask patterns over time, we used this analysis to
214
compare spatio-temporal variations of land cover distributions and ES supply removing alternatively the effect
215
of the city and the year variables as constraining factors.
216
217
3. Results
218
3.1.
Land cover change under urbanization219
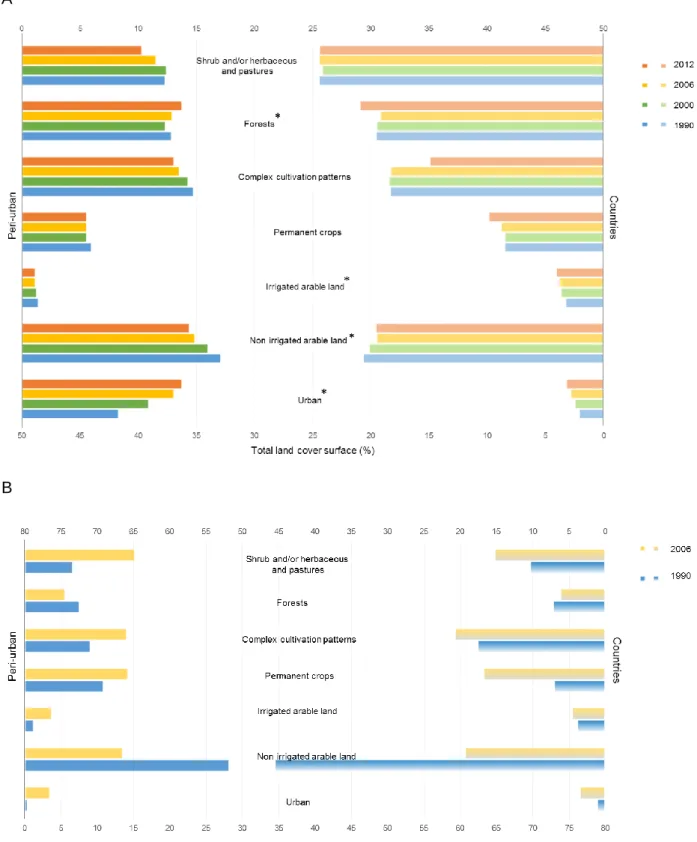
Common patterns emerge for all selected Mediterranean cities when we compared land cover patterns over time
220
between the selected Mediterranean cities and the trends in the respective countries (Fig. 4A and 4B). Overall,
221
changes were more pronounced in the peri-urban areas than at national level. As expected, all peri-urban areas
222
demonstrated a significant increase of urban fabric. Around the European cities this took place mostly at the
223
expense of complex cultivation patterns, non-irrigated and irrigated arable land, and shrub and/or herbaceous and
224
pastures from 1990 to 2012. The parametric two-sample t-test revealed significant differences over the time
225
between peri-urban areas from selected cities and countries in Europe in the case of urban, non-irrigated and
226
irrigated arable land, and forest (p-value = 0.05) (Fig. 4A).
227
In the North African peri-urban areas, the increase of urban area from 1990 to 2006 occurred in parallel with an
228
increase in irrigated arable land, permanent crops, complex cultivation patterns and shrublands and/or
229
herbaceous and pastures, at the expense of non-irrigated arable land and forest, both around in peri-urban areas
230
as well as at the national level (Fig. 4B).
231
- Insert Fig. 4 around here -
232
3.2.
Mediterranean peri-urban areas, spatio-temporal dynamics in land cover233
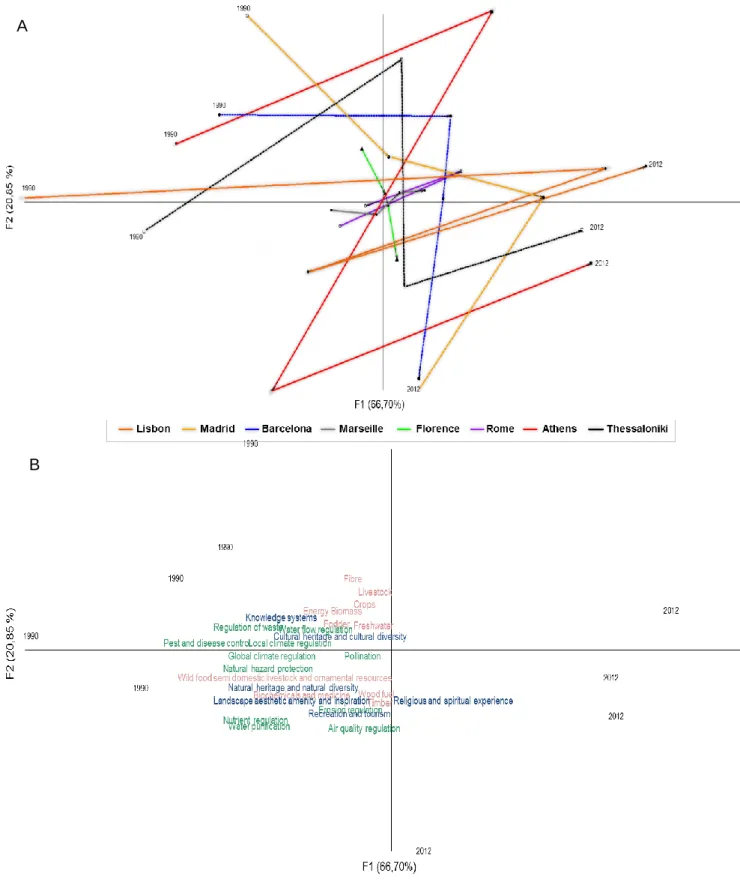
Within-class Correspondence Analyses (WCA) were performed separately to assess how land cover changes
234
differed over time in peri-urban areas of Mediterranean European cities (from 1990 to 2012) and in peri-urban
235
areas of Northern African cities (from 1990 to 2006) (Appendix 7). Results from European cities (where city as a
236
variable was removed) showed that 4.56% of the variation was due to time patterns in land use; whereas when
237
WCA was based on the time period or year (enhancing the differences between cities) 97.87% of the variation
238
was due to the difference between cities and peri-urban land uses. This means that the differences of surrounding
239
land use between cities are a dominant pattern that masks common trends if it is not removed beforehand.
240
In the case of European cities (Fig. 5A), different dynamics of land cover change over time occurred in the
peri-241
urban areas. A clear pattern of change from non-irrigated arable land in 1990 (negative scores of F1) to urban in
242
2012 (positive scores of F1) was identified in Madrid and Thessaloniki. Barcelona, Lisbon and Athens showed
243
transitions of complex cultivation patterns, shrublands and pastures (negative scores of F2) to forest (in positive
244
scores of F2) in 1990, and to urban in 2012 (in positive scores of F1). Peri-urban areas of Marseille and Florence
245
were characterized by a transition from irrigated arable land (negative scores of F1) towards urban. Land cover
246
change patterns in the peri-urban area of Rome are less pronounced, but mostly correspond to permanent crops,
247
shrublands and pastures in 1990 transforming into urban land in 2012. In conclusion, for European cities the
248
temporal gradient was dominated by an increase of urban areas and marginal changes in agricultural land uses.
9
Results from WCA in North African cities (where city as a variable was removed) showed that 62.86% of the
250
variation was due to temporal patterns in land use; whereas when removing year variable 82.18% of variation is
251
due to differences between cities and land uses.
252
North African peri-urban areas (Fig. 5B) in 1990 were characterized by a clear pattern from non-irrigated arable
253
land and forest patterns (in negative scores of F1) to an increase in 2006 of urban land, shrubs and herbaceous
254
associated vegetation and pastures (in positive scores of F2). Peri-urban areas of Sfax showed transitions of
255
permanent crops (in positive scores of F1) to urban land, shrubs and herbaceous associated vegetation and
256
pastures (in positive scores of F2) also, with an increase of irrigated arable land.
257
- Insert Fig. 5 around here -
258
3.3.
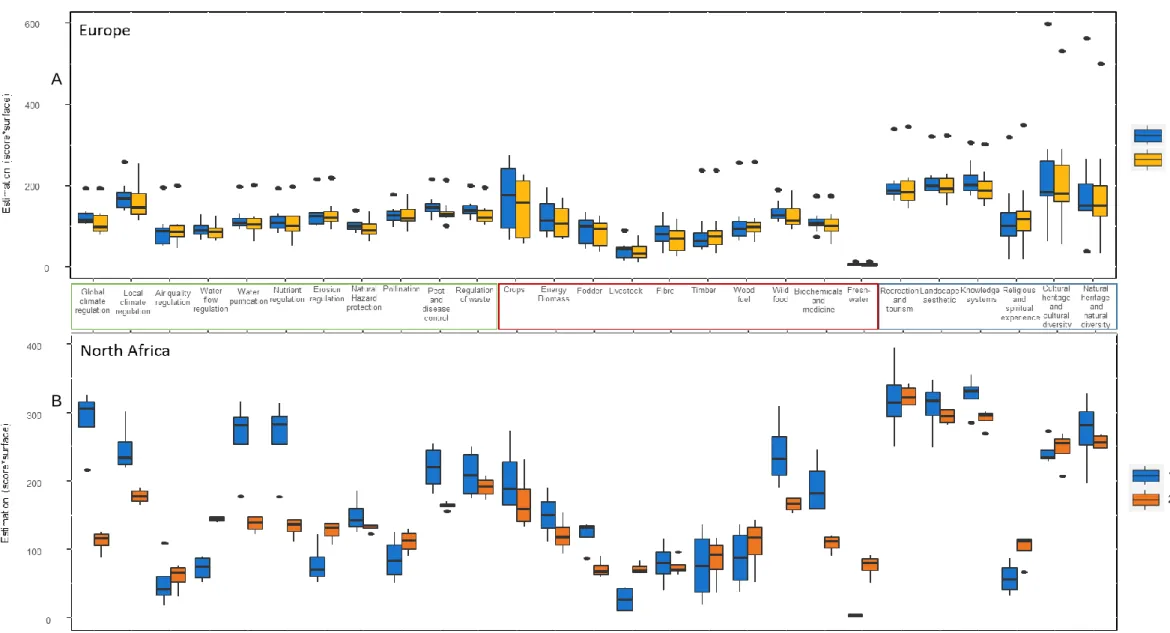
Ecosystem services supply: spatio-temporal patterns259
The supply of ESs (Appendix 5 and 6) was estimated through multivariate within-class Principal Component
260
Analysis (WCP), considering European and North African cities over the indicated periods respectively.
261
Trends in ES supply differed between EU cities (Fig. 6). The first component was characterized by a gradient in
262
ES supply, from the highest (in negative scores of F1) to lowest ES values (in positive scores of F1) for all
263
services. This indicates a general trend of reducing ES supply capacity from 1990 to 2012 in peri-urban areas.
264
The second axis is related to the contrast between two groups of services that are important for two different
265
beneficiary groups. First, there is a group of ES relevant for farmers i.e. provisioning (fiber, livestock, crops,
266
energy biomass, fodder, freshwater), regulating (water flow regulation, pest and disease control, local climate
267
regulation), and cultural (knowledge systems and cultural heritage and cultural diversity) (in positive scores of
268
F2). Second, there is a group of ES relevant for forest users i.e. provisioning (wild food, biochemicals and
269
medicine, wood fuel, timber), regulating (erosion regulation, nutrient regulation, air quality regulation, global
270
climate regulation) and cultural ES (recreation and tourism, natural heritage and natural diversity) (in negative
271
scores of F2). All peri-urban areas from European cities followed this pattern, with the exception of Rome where
272
ES supply capacity remained stable over time.
273
- Insert Fig. 6 around here -
274
The ES supply trends for North African cities changed from 1990 to 2006. Figure 7 shows the increase in the
275
supply of provisioning (fodder, energy biomass, biochemicals and medicine, wild food), and regulating ES in
276
1990 (natural hazard protection, local climate regulation, water purification, nutrient purification) (in negative
277
scores of F1). Whereas in 2006 the pattern changed to ES supply, i.e. provisioning (livestock, freshwater) and
278
regulating (pollination, erosion regulation and water flow regulation) (positive scores of F1). The second axis
279
indicates an opposition between the supply of cultural (cultural heritage and cultural diversity) and provisioning
280
ES (i.e. wood fuel and timber) in Nabeul, Rabat and Tunis (negative scores F2). In the peri-urban areas of Sfax
281
the opposition of ES occurs between cultural ES and regulating (pollination, water flow regulation) and
282
provisioning (livestock, freshwater) (positive scores F2).
283
- Insert Fig. 7 around here -
284
All Mediterranean peri-urban areas show increases in the supply of air quality regulation, timber, wood fuel and
285
religious and spiritual experience (Fig. 8). The European peri-urban areas show small or negative trends for the
10
other ES. North-African peri-urban areas show much larger changes than those found in the European peri-urban
287
areas, but this is maybe caused by the differences between CLC and GLC data. In general, the North-African
288
peri-urban area showed stronger increases of ES supply capacities than the European peri-urban areas. In
289
addition to the previously mentioned ES, the supply capacity of pollination, livestock, religious and cultural
290
heritage increased in North-African peri-urban areas.
291
Peri-urban areas do not show the same patterns for ES supply over time (Fig. 9). In some peri-urban areas the
292
supply of regulating and cultural ES was more important than for the provisioning ES (Lisbon, Barcelona,
293
Marseille, Florence, Athens and Sfax) or the inverse in the case of Thessaloniki. In other cases, the supply of
294
regulating ES was more important than provisioning and cultural ES (Madrid and Rome). Cultural ES increased
295
around Nabeul, Rabat and Tunis.
296
- Insert Fig. 8 around here -
297
4. Discussion
298
4.1.
Changes in land cover299
Land cover changes in European Mediterranean peri-urban areas showed an expansion of urban and forested
300
areas at the expense of agriculture land similar to described by d’Amour et al. (2016) and Depietri et al. (2016).
301
Especially irrigated (Marseille and Florence) and non-irrigated arable land (Madrid and Thessaloniki) were
302
reduced. Around Barcelona, Lisbon and Athens, complex cultivation patterns, shrublands and pastures were
303
more abandoned. In Rome’s peri-urban areas where the urban area increased less, general land cover change
304
patterns are also less pronounced.
305
Peri-urban areas of all North African cities, showed the same general pattern of increases in urban land, but
306
instead this coincided with increases of agricultural land, herbaceous associated vegetation and pastures while
307
irrigated agriculture and forest areas were reduced for Rabat, Nabeul and Tunis. In the peri-urban area of Sfax
308
the area of irrigated arable land increased, while complex cultivation systems reduced in area. This expansion of
309
both urban areas as well as agricultural areas in North Africa had been observed earlier (Bouraoui, 2001).
310
Previous European focused studies demonstrated an expansion of woodlands in abandoned and marginal
311
agricultural land (EEA, 2002; Zanchi, et al., 2007). Indeed, our results showed an increase in forest and
312
shrublands for Europe at both peri-urban and national level. For the North African cities and countries, however,
313
it is particularly shrublands which increased while the forest area showed a relatively slight decline.
314
- Insert Fig. 9 around here -
315
4.2.
Implications of ES trends in peri-urban areas316
The Mediterranean basin has some serious challenges to advance on global Sustainable Development Goals
317
(UNEP/MAP, 2016), to which the ES supplied by peri-urban areas could positively contribute. In general, the ES
318
supply capacity of peri-urban Mediterranean areas decreased over time, in particular for the supply of
319
provisioning and regulating ES. If we consider the ES that are of most immediate concern for ensuring human
320
well-being, i.e. supply of food, water and protection from hazards, then European and north-African peri-urban
321
regions showed decreasing supply trends for the supply of food and protection from hazards. Supply of
322
freshwater in Europe remains constant, but north-African peri-urban areas showed an increased supply of
11
freshwater. This is linked to a growing surface of continental water bodies, since several dams and reservoirs
324
have been built to address issues related to water scarcity and strong interannual variability of precipitation
325
(Tramblay et al., 2016). However, as the ES of water purification decreased (Fig 8), we may have to be cautious
326
as to the use of this water for all purposes.
327
Total area for crop production decreased over time in peri-urban areas, but this does not necessarily mean that
328
the total food production also decreased. Changes in farm management may have increased the productivity of
329
remaining agricultural land. Also, since these Mediterranean cities already rely heavily on food imports (Lead et
330
al., 2005; Soulard et al., 2017), a reduction in locally produced food is likely not to lead immediately to a food
331
deficit. However, an increased dependence on global food market prices does render countries more vulnerable
332
to potential food crises.
333
Urbanization often implies the expansion of impermeable surfaces leading to an increase of surface water runoff,
334
and consequently an increased risk of flooding (Gómez-Baggethun et al., 2013). Our results show that the
335
regulation of natural hazards has been decreasing over the years in Mediterranean peri-urban areas which pose a
336
particular threat to people living around urban and peri-urban areas.
337
Depending on whether the supply of ES needs to be local in order to provide benefits, the peri-urban area can
338
supply ES in the urban area. Recent studies on ES mismatches between supply and demand in urban areas have
339
predominantly indicated deficits in local climate regulation (carbon sequestration, urban cooling), air quality
340
regulation, and recreation and nature tourism (Baró et al., 2016, 2015). Of these deficits, peri-urban land could
341
provide air quality regulation to reducing the deficit in the future. Although urban areas represent relatively small
342
areas at a global scale, their increase could negatively impact local climate (Foley et al., 2005; Verburg et al.,
343
2011). Our results indicate that Mediterranean peri-urban capacity to supply climate regulation has been
344
decreasing. The steady trend or the increase of potential supply of some cultural ES by peri-urban areas
345
(religious and spiritual experience) was not considered in previous assessment on ES around the Mediterranean,
346
(Nieto-Romero et al., 2014; Runting et al., 2017) and this study offers therefore, a first reflection on its trends.
347
There are ES supplied by the peri-urban areas which may not actually reach inhabitants of urban areas, for
348
instance trees only provide shade locally. We can assume however, that for other ES for which distances are less
349
relevant (e.g. global climate regulation) or for which people are likely to travel short distances (e.g. recreation
350
and nature tourism), ES supply by peri-urban areas can be considered relevant for urban areas. For instance, the
351
increased potential of cultural ES in peri-urban areas that we found (due to predominantly an increase in the
non-352
irrigated agricultural and forest areas) is increasingly relevant for people seeking to spend their leisure time
353
outside of urban areas. As the urban population grows, it could be possible that the demand for cultural services,
354
notably in the nearby surroundings of cities, will increase. To determine whether or not the identified increase in
355
supply will be able to meet this presumed increase in demand would need to a more detailed study.
356
Our use of the capacity matrix developed by Stoll et al. (2015) has several limitations, namely, 1) the capacity
357
matrix was based on expert estimates only reflected the potential ES supply which can be different from the
358
actual supply; 2) land cover information does not incorporate the type of management on arable lands and forest,
359
prohibiting estimations of effects due to changes in land use intensity; 3) the matrix essentially represents a
12
European perspective on land use and potential ES supply, so a capacity matrix adapted to the Mediterranean
361
biome should be required to obtain more accurate estimates.
362
Despite those limitations, we consider that our approach allows assessing land cover and ES changing patterns
363
across Mediterranean peri-urban areas based on openly available data, identifying potential influence on ES
364
supply. The multi-city approach used for this study allowed addressing the complexity of landscapes and
365
management around the Mediterranean basin reflected by the different evolution of supplied ES over time.
366
European peri-urban areas evolved from a bundle of ES provided mainly by agro-ecosystems to forest and
367
natural vegetation ecosystems. Meanwhile, North African peri-urban areas supplied a bundle of ES from
agro-368
ecosystems and natural vegetation ecosystems that change tending to rangelands over the years.
369
A first step to improve the estimates presented in this paper would be to take into account land management and
370
its diversity, which is likely to entail a larger diversity in ES supply trends that can be obtained by focusing on
371
land cover information only. In a second future step, the identified trends in ES supply should be confronted with
372
the trends in demand for ES, to evaluate in a quantified manner how forecasted population increases in cities
373
around the Mediterranean will affect ES deficits.
374
5. Conclusion
375
Mediterranean peri-urban areas can play an important role contributing to the supply of some ES to near urban
376
areas (air quality regulation, timber, wood fuel and religious and spiritual experience). However, general trends
377
indicated a decrease of ES supply due to land cover changes in Mediterranean peri-urban areas, induced by
378
nearby urbanization.
379
Acknowledgements
380
This work has received support from European Union FP7 projects OPERAs (Contract No. 308393, to APGN
381
and WC), EU BON (Contract No. 308454, to IG and WC) and ECOPOTENTIAL project (Contract No. 641762,
382
to IG). The authors acknowledge Labex OT-Med (ANR-11-LABX-0061) funded by the French Government
383
Investissements d’Avenir program of the French National Research Agency (ANR) through the A*MIDEX
384
project (ANR-11-IDEX-0001-02). Special thanks for valuable advice go to Berta Martín-López, Violeta
Hevia-385
Martín, Claude Napoleone, Marina Cantabrana and Benjamin Mary. We also thank three anonymous reviewers
386
for their constructive comments.
13
References388
Angel, S., Parent, J., Civco, D.L., Blei, A., Potere, D., 2011. The dimensions of global urban
389
expansion: Estimates and projections for all countries, 2000–2050. Prog. Plan. 75, 53–107.
390
doi:10.1016/j.progress.2011.04.001
391
Baró, F., Haase, D., Gómez-Baggethun, E., Frantzeskaki, N., 2015. Mismatches between ecosystem
392
services supply and demand in urban areas: A quantitative assessment in five European cities.
393
Ecol. Indic. 55, 146–158. doi:10.1016/j.ecolind.2015.03.013
394
Baró, F., Palomo, I., Zulian, G., Vizcaino, P., Haase, D., Gómez-Baggethun, E., 2016. Mapping
395
ecosystem service capacity, flow and demand for landscape and urban planning: a case study
396
in the Barcelona metropolitan region. Land Use Policy 57, 405–417.
397
Bennett, E.M., Cramer, W., Begossi, A., Cundill, G., Díaz, S., Egoh, B.N., Geijzendorffer, I.R., Krug,
398
C.B., Lavorel, S., Lazos, E., Lebel, L., Martín-López, B., Meyfroidt, P., Mooney, H.A., Nel,
399
J.L., Pascual, U., Payet, K., Pérez Harguindeguy, N., Peterson, G.D., Prieur-Richard, A.-H.,
400
Reyers, B., Roebeling, P., Seppelt, R., Solan, M., Tschakert, P., Tscharntke, T., Turner II, B.,
401
Verburg, P.H., Viglizzo, E.F., White, P.C., Woodward, G., 2015. Linking biodiversity,
402
ecosystem services, and human well-being: three challenges for designing research for
403
sustainability. Curr. Opin. Environ. Sustain. 76–85.
404
Benzécri, J., 1983. Analyse de l’inertie intraclasse par l’analyse d’un tableau de correspondance. Cah.
405
Anal. Données 8, 351–358.Bernués, A., Rodríguez-Ortega, T., Ripoll-Bosch, R., Alfnes, F.,
406
2014. Socio-Cultural and Economic Valuation of Ecosystem Services Provided by
407
Mediterranean Mountain Agroecosystems. PLOS ONE 9, e102479.
408
doi:10.1371/journal.pone.0102479
409
Bolund, P., Hunhammar, S., 1999. Ecosystem services in urban areas. Ecol. Econ. 293 – 301.
410
Bontemps, S., Defournya, P., Van Bogaert, E., Weber, J., Arino, O., 2009. GlobCorine–A joint
EEA-411
ESA project for operational land dynamics monitoring at pan-European scale. Presented at the
412
The 33rd International Symposium on Remote Sensing of Environment, Tucson/Arizona
413
USA.
414
Bouraoui, M., 2001. L’agriculture, nouvel instrument de la construction urbaine? Étude de deux
415
modèles agri-urbains d’aménagement du territoire: le plateau de Saclay, à Paris, et la plaine de
416
Sijoumi, à Tunis. Thèse de doctorat en sciences de l’environnement sous la direction de Pierre
417
Donadieu, École nationale du génie rural, des eaux et des forêts (ENGREF), soutenue le 13
418
décembre devant un jury composé de Pierre Donadieu, André Fleury, Yves Luginbühl
419
(rapporteur), Claude Millier (président), Kamel Omrane, Alain Roger (rapporteur) et Monique
420
Toublanc, mention très honorable avec les félicitations du jury. Rural. Sci. Soc. Mondes
421
Ruraux Contemp.
422
Burkhard, B., Kroll, F., Müller, F., Windhorst, W., 2009. Landscapes’ capacities to provide ecosystem
423
services–a concept for land-cover based assessments. Landsc. Online 15, 22.
424
14
Bu
rkhard, B., Kroll, F., Nedkov, S., Müller, F., 2012. Mapping ecosystem service supply, demand and
425
budgets. Ecol. Indic. 21, 17–29.
426
Cassarino, J.-P., 2008. Return migrants to the Maghreb Countries: Reintegration and development
427
challenges. MIREM Proj. Robert Schuman Cent. Adv. Stud. EUI Florence.
428
Chessel, D., Dufour, A., Thioulouse, J., 2003. Méthodes K-tableaux. Biométrie Biol. Evol. - Univ.
429
d’Amour, C.B., Reitsma, F., Baiocchi, G., Barthel, S., Güneralp, B., Erb, K.-H., Haberl, H., Creutzig,
430
F., Seto, K.C., 2016. Future urban land expansion and implications for global croplands. Proc.
431
Natl. Acad. Sci. 201606036. doi:10.1073/pnas.1606036114
432
Depietri, Y., Kallis, G., Baró, F., Cattaneo, C., 2016. The urban political ecology of ecosystem
433
services: The case of Barcelona. Ecol. Econ. 125, 83–100.
434
EEA, 2002. Biogeographical regions in Europe. The Mediterranean biogeographical region – long
435
influence from cultivation, high pressure from tourists, species rich, warm and drying.
436
EEA, 2011. Landscape fragmentation in Europe — European Environment Agency (Publication).
437
Elmqvist, T., Redman, C.L., Barthel, S., Costanza, R., 2013. History of Urbanization and the Missing
438
Ecology, in: Elmqvist, T., Fragkias, M., Goodness, J., Güneralp, B., Marcotullio, P.J.,
439
McDonald, R.I., Parnell, S., Schewenius, M., Sendstad, M., Seto, K.C., Wilkinson, C. (Eds.),
440
Urbanization, Biodiversity and Ecosystem Services: Challenges and Opportunities. Springer
441
Netherlands, pp. 13–30.
442
FAO, 2016. The State of Food and Agriculture (SOFA): Climate change, agriculture and food
443
security.
444
FAO, 2001. The State of Food and Agriculture, 2001. Rome.
445
Feranec, J., Soukup, T., Feranec, G., Jaffrain, G., 2016. European landscape dynamics: CORINE land
446
cover data. CRC Press.
447
Fichera, C.R., Modica, G., Pollino, M., 2016. GIS and Remote Sensing to Study Urban-Rural
448
Transformation During a Fifty-Year Period, in: SpringerLink. Springer Berlin Heidelberg, pp.
449
237–252.
450
Foley, J.A., DeFries, R., Asner, G.P., Barford, C., Bonan, G., Carpenter, S.R., Chapin, F.S., Coe,
451
M.T., Daily, G.C., Gibbs, H.K., Helkowski, J.H., Holloway, T., Howard, E.A., Kucharik, C.J.,
452
Monfreda, C., Patz, J.A., Prentice, I.C., Ramankutty, N., Snyder, P.K., 2005. Global
453
Consequences of Land Use. Science 309, 570–574. doi:10.1126/science.1111772
454
Folke, C., Jansson, Å., Larsson, J., Costanza, R., 1997. Ecosystem Appropriation by Cities. Ambio 3,
455
167–172.
456
García-Nieto, A.P., García-Llorente, M., Iniesta-Arandia, I., Martín-López, B., 2013. Mapping forest
457
ecosystem services: From providing units to beneficiaries. Ecosyst. Serv. 4, 126–138.
458
doi:10.1016/j.ecoser.2013.03.003
459
Geijzendorffer, I.R., Martín-López, B., Roche, P.K., 2015. Improving the identification of mismatches
460
in ecosystem services assessments. Ecol. Indic. 52, 320–331.
461
15
Gómez-Baggethun, E., Gren, Å., Barton, D.N., Langemeyer, J., McPhearson, T., O’Farrell, P.,
462
Andersson, E., Hamstead, Z., Kremer, P., 2013. Urban Ecosystem Services, in: Elmqvist, T.,
463
Fragkias, M., Goodness, J., Güneralp, B., Marcotullio, P.J., McDonald, R.I., Parnell, S.,
464
Schewenius, M., Sendstad, M., Seto, K.C., Wilkinson, C. (Eds.), Urbanization, Biodiversity
465
and Ecosystem Services: Challenges and Opportunities. Springer Netherlands, pp. 175–251.
466
Hasse, J.E., Lathrop, R.G., 2003. Land resource impact indicators of urban sprawl. Appl. Geogr. 23,
467
159–175.
468
Haase, D., Larondelle, N., Andersson, E., Artmann, M., Borgström, S., Breuste, J., Gomez-Baggethun,
469
E., Gren, Å., Hamstead, Z., Hansen, R., 2014. A quantitative review of urban ecosystem
470
service assessments: concepts, models, and implementation. Ambio 43, 413–433.
471
Hervieu, B., Thibault, H., 2009. Rethinking rural development in the Mediterranean. Paris
472
CIHEAMPresses Sci. Po.
473
Houimli, E., 2008. The factors of resistance and fragility of the littoral agriculture in front of the
474
urbanization: the case of the region of North Sousse in Tunisia.
475
Jansson, Å., 2013. Reaching for a sustainable, resilient urban future using the lens of ecosystem
476
services. Ecol. Econ. 86, 285–291. doi:10.1016/j.ecolecon.2012.06.013
477
Jarosz, L., 2008. The city in the country: Growing alternative food networks in Metropolitan areas. J.
478
Rural Stud. 24, 231–244.
479
Kabisch, N., Haase, D., 2011. Diversifying European agglomerations: evidence of urban population
480
trends for the 21st century. Popul. Space Place 17, 236–253. doi:10.1002/psp.600
481
Kasanko, M., Barredo, J.I., Lavalle, C., McCormick, N., Demicheli, L., Sagris, V., Brezger, A., 2006.
482
Are European cities becoming dispersed?: A comparative analysis of 15 European urban
483
areas. Landsc. Urban Plan. 77, 111–130. doi:10.1016/j.landurbplan.2005.02.003
484
Kremer, P., Hamstead, Z., Haase, D., McPhearson, T., Frantzeskaki, N., Andersson, E., Kabisch, N.,
485
Larondelle, N., Rall, E., Voigt, A., Baró, F., Bertram, C., Gómez-Baggethun, E., Hansen, R.,
486
Kaczorowska, A., Kain, J.-H., Kronenberg, J., Langemeyer, J., Pauleit, S., Rehdanz, K.,
487
Schewenius, M., van Ham, C., Wurster, D., Elmqvist, T., 2016. Key insights for the future of
488
urban ecosystem services research. Ecol. Soc. 21. doi:10.5751/ES-08445-210229
489
Kroll, F., Müller, F., Haase, D., Fohrer, N., 2012. Rural–urban gradient analysis of ecosystem services
490
supply and demand dynamics. Land Use Policy 29, 521–535.
491
doi:10.1016/j.landusepol.2011.07.008
492
Lead, C., Nelson, G.C., Bennett, E., 2005. Drivers of change in ecosystem condition and services.
493
Ecosyst Hum Well-Being 2, 173.
494
Luederitz, C., Brink, E., Gralla, F., Hermelingmeier, V., Meyer, M., Niven, L., Panzer, L., Partelow,
495
S., Rau, A.-L., Sasaki, R., 2015. A review of urban ecosystem services: six key challenges for
496
future research. Ecosystem Serv. 14, 98–112.
497
16
MA, 2005. (MA) Millennium Ecosystem Assessment, 2005. Ecosystems and Human Well-being:
498
Synthesis. Isl. Press, Washington, DC.
499
Martín-López, B., Iniesta-Arandia, I., García-Llorente, M., Palomo, I., Casado-Arzuaga, I., Amo,
500
D.G.D., Gómez-Baggethun, E., Oteros-Rozas, E., Palacios-Agundez, I., Willaarts, B.,
501
González, J.A., Santos-Martín, F., Onaindia, M., López-Santiago, C., Montes, C., 2012.
502
Uncovering Ecosystem Service Bundles through Social Preferences. PLOS ONE 7, e38970.
503
doi:10.1371/journal.pone.0038970
504
McDonnell, M.J., Hahs, A.K., 2008. The use of gradient analysis studies in advancing our
505
understanding of the ecology of urbanizing landscapes: current status and future directions.
506
Landsc. Ecol. 23, 1143–1155. doi:10.1007/s10980-008-9253-4
507
Membrado-Tena, J.C., 2015. Costa Blanca: Urban Evolution of a Mediterranean Region through GIS
508
Data. Boll. DellAssociazione Ital. Cartogr. Num 154 P 61-79.
509
Modica, G., Vizzari, M., Pollino, M., Fichera, C.R., Zoccali, P., Di Fazio, S., 2012. Spatio-temporal
510
analysis of the urban–rural gradient structure: an application in a Mediterranean mountainous
511
landscape. Earth Syst Dynam 3, 263–279.
512
Nieto-Romero, M., Oteros-Rozas, E., González, J.A., Martín-López, B., 2014. Exploring the
513
knowledge landscape of ecosystem services assessments in Mediterranean agroecosystems:
514
insights for future research. Environ. Sci. Policy 37, 121–133.
515
Olson, D.M., Dinerstein, E., Wikramanayake, E.D., Burgess, N.D., Powell, G.V., Underwood, E.C.,
516
D’amico, J.A., Itoua, I., Strand, H.E., Morrison, J.C., 2001. Terrestrial Ecoregions of the
517
World: A New Map of Life on Earth A new global map of terrestrial ecoregions provides an
518
innovative tool for conserving biodiversity. BioScience 51, 933–938.
519
Orgiazzi, A., Bardgett, R.D., Barrios, E., Behan-Pelletier, V., Briones, M.J., Chotte, J.-L., De Deyn,
520
G.B., Eggleton, P., Fierer, N., Fraser, T., 2016. Global soil biodiversity atlas. Eur. Comm.
521
Publ. Off. Eur. Union 176.
522
RStudio, 2012. RStudio: Integrated development environment for R (Version 0.96.122) [Computer
523
software]. Boston, MA. RStudio Support.
524
Runting, R.K., Bryan, B.A., Dee, L.E., Maseyk, F.J.F., Mandle, L., Hamel, P., Wilson, K.A., Yetka,
525
K., Possingham, H.P., Rhodes, J.R., 2017. Incorporating climate change into ecosystem
526
service assessments and decisions: a review. Glob. Change Biol. 23, 28–41.
527
doi:10.1111/gcb.13457
528
Schröter, D., Cramer, W., Leemans, R., Prentice, I.C., Araújo, M.B., Arnell, N.W., Bondeau, A.,
529
Bugmann, H., Carter, T.R., Gracia, C.A., Vega-Leinert, A.C. de la, Erhard, M., Ewert, F.,
530
Glendining, M., House, J.I., Kankaanpää, S., Klein, R.J.T., Lavorel, S., Lindner, M., Metzger,
531
M.J., Meyer, J., Mitchell, T.D., Reginster, I., Rounsevell, M., Sabaté, S., Sitch, S., Smith, B.,
532
Smith, J., Smith, P., Sykes, M.T., Thonicke, K., Thuiller, W., Tuck, G., Zaehle, S., Zierl, B.,
533
17
2005. Ecosystem Service Supply and Vulnerability to Global Change in Europe. Science 310,
534
1333–1337. doi:10.1126/science.1115233
535
Schulp, C.J.E., Burkhard, B., Maes, J., Vliet, J.V., Verburg, P.H., 2014. Uncertainties in Ecosystem
536
Service Maps: A Comparison on the European Scale. PLOS ONE 9, e109643.
537
doi:10.1371/journal.pone.0109643
538
Seto, K.C., Fragkias, M., Güneralp, B., Reilly, M.K., 2011. A Meta-Analysis of Global Urban Land
539
Expansion. PLOS ONE 6, e23777. doi:10.1371/journal.pone.0023777
540
Seto, K.C., Güneralp, B., Hutyra, L.R., 2012. Global forecasts of urban expansion to 2030 and direct
541
impacts on biodiversity and carbon pools. Proc. Natl. Acad. Sci. U. S. A. 109, 16083–16088.
542
doi:10.1073/pnas.1211658109
543
Seto, K.C., Parnell, S., Elmqvist, T., 2013. A Global Outlook on Urbanization, in: Elmqvist, T.,
544
Fragkias, M., Goodness, J., Güneralp, B., Marcotullio, P.J., McDonald, R.I., Parnell, S.,
545
Schewenius, M., Sendstad, M., Seto, K.C., Wilkinson, C. (Eds.), Urbanization, Biodiversity
546
and Ecosystem Services: Challenges and Opportunities. Springer Netherlands, pp. 1–12.
547
Soulard, C.-T., Valette, E., Perrin, C., Abrantes, P.C., Anthopoulou, T., Benjaballah, O., Bouchemal,
548
S., Dugué, P., El Amrani, M., Lardon, S., 2017. Peri-urban agro-ecosystems in the
549
Mediterranean: diversity, dynamics, and drivers. Reg. Environ. Change 1–12.
550
Stoll, S., Frenzel, M., Burkhard, B., Adamescu, M., Augustaitis, A., Baeßler, C., Bonet, F.J., Carranza,
551
M.L., Cazacu, C., Cosor, G.L., Díaz-Delgado, R., Grandin, U., Haase, P., Hämäläinen, H.,
552
Loke, R., Müller, J., Stanisci, A., Staszewski, T., Müller, F., 2015. Assessment of ecosystem
553
integrity and service gradients across Europe using the LTER Europe network. Ecol. Model.
554
295, 75–87. doi:10.1016/j.ecolmodel.2014.06.019
555
Tramblay, Y., Jarlan, L., Hanich, L., Somot, S., 2016. Future water availability in North African dams
556
simulated by high-resolution regional climate models. Presented at the EGU General
557
Assembly Conference Abstracts, p. 8141.
558
UNEP/MAP, 2012. State of the Mediterranean Marine and Coastal Environment.
559
UNEP/MAP, 2016. Mediterranean strategy for sustainable development 2016-2025: Investing in
560
environmental sustainability to achieve social and economic development.
561
United Nations, 2014. World Urbanization Prospects: The 2014 Revision, Highlights. Department of
562
Economic and Social Affairs, Population Division.
563
United Nations World Water Assessment Programme, 2014. The United Nations World Water
564
Development Report 2014: Water and Energy. Paris, UNESCO.
565
United Nations, 2015a. World Population Prospects: The 2015 Revision, Key Findings and Advance
566
Tables. Working Paper No. ESA/P/WP.241. Department of Economic and Social Affairs,
567
Population Division.
568
United Nations, 2015b. Transforming our world: the 2030 Agenda for Sustainable Development
569
Document A/RES/70/1, Resolution Adopted by the General Assembly on 25 September 2015
570
18
Verburg, P.H., Neumann, K., Nol, L., 2011. Challenges in using land use and land cover data for
571
global change studies. Glob. Change Biol. 17, 974–989.
doi:10.1111/j.1365-572
2486.2010.02307.x
573
Zanchi G., Thiel D., Green T., Lindner M., 2007. Afforestation in Europe final version 26/01/07.
574
European Forest Institute
575
Zasada, I., 2011. Multifunctional peri-urban agriculture—A review of societal demands and the
576
provision of goods and services by farming. Land Use Policy 28, 639–648.
577
19
Land cover database Year Spatial resolution Cities LC categories
Corine Land Cover
1990
100 m
Lisbon (Portugal), Madrid (Spain), Barcelona (Spain), Marseille (France), Florence (Italy), Rome (Italy),
Athens (Greece), Thessaloniki (Greece) 44
2000 2006 2012
1990 250 m Rabat (Morocco), Tunis (Tunisia), Sfax (Tunisia),
Nabeul (Tunisia)
GlobCorine 2006 300 m 14
Table 1. Land cover data.
Table 2. Urban and surrounding areas (km
2)
CLC groups CLC categories
Urban 111, 112, 121, 122, 123, 124, 131, 132, 133, 141, 142
Non-irrigated arable land 211
Irrigated arable land 212, 213
Permanent crops 221, 222, 223
Complex cultivation patterns 241, 242, 243, 244
Forest 311, 312, 313
Shrubs and/or herbaceous vegetation association and pastures 231, 321, 322, 323, 324
Table 3. CLC categories summarized into CLC groups.
LISBON MADRID BARCELONA MARSEILLE FLORENCE ROME ATHENS THESSALONIKI RABAT TUNIS SFAX NABEUL
Urban core (km2) 103,39 175,20 74,07 104,01 43,50 296,05 163,07 44,77 251,89 427,33 149,85 23,72
Adjacent urban
area Wu (km2) 348,61 431,82 219,95 441,96 145,01 1483,68 452,86 135,46 410,34 790,00 209,41 43,37
Peri-urban area