HAL Id: hal-02966099
https://hal.archives-ouvertes.fr/hal-02966099
Submitted on 13 Oct 2020HAL is a multi-disciplinary open access archive for the deposit and dissemination of sci-entific research documents, whether they are pub-lished or not. The documents may come from teaching and research institutions in France or abroad, or from public or private research centers.
L’archive ouverte pluridisciplinaire HAL, est destinée au dépôt et à la diffusion de documents scientifiques de niveau recherche, publiés ou non, émanant des établissements d’enseignement et de recherche français ou étrangers, des laboratoires publics ou privés.
Multiscale modelling of the magnetic Barkhausen noise
energy cycles
P. Fagan, Benjamin Ducharne, L. Daniel, A. Skarlatos
To cite this version:
P. Fagan, Benjamin Ducharne, L. Daniel, A. Skarlatos. Multiscale modelling of the magnetic Barkhausen noise energy cycles. Journal of Magnetism and Magnetic Materials, Elsevier, 2021, 517, pp.167395. �10.1016/j.jmmm.2020.167395�. �hal-02966099�
1
Multiscale modelling of the magnetic Barkhausen noise energy
cycles.
P. Fagan1,2, B. Ducharne2,3, L. Daniel4,5, A. Skarlatos1
1 CEA – DISC, CEA-LIST, CEA Saclay DIGITEO LABS, Bât. 565, 91191 Gif-sur-yvette cedex 2 Laboratoire de Génie Electrique et Ferroélectricité – INSA de Lyon, Villeurbanne, France. 3 ELyTMaX UMI 3757, CNRS – Université de Lyon – Tohoku University, International Joint Unit,
Tohoku University, Sendai, Japan.
4 Université Paris-Saclay, Centrale Supélec, CNRS, Group of Electrical Engineering-Paris (GeePs), 91192, Gif-sur-Yvette, France.
2
Abstract
The magnetic Barkhausen noise (MBN) control is popular for materials characterization and as a magnetic Non-Destructive Testing & Evaluation (NDT & E) method. MBN comes from the erratic and unpredictable magnetic domains motion during the magnetization process. Its correlation to the micro-structural properties is evident. MBN is usually studied through time independent indicators, like the MBNenergy, which is obtained by integrating the square of the
MBN voltage signal with respect to the time axis. By plotting the MBN energy as a function of
the tangent excitation field H, a hysteresis cycle can be observed. After renormalization, the comparison with the classic induction vs excitation B(H) hysteresis loop provides interesting observations. Similar shapes can be observed if the domain wall contribution is preponderant in the magnetization process. On the contrary, strong differences appear if the magnetization rotation mechanism is stronger. There is no available standard for the exploitation of MBN control devices. Usual procedures rely on rejection thresholds based on empirical relations. In this domain, simulation tools able to refine these thresholds and improve the understanding of the physical behavior are highly desired. In this study, a simulation method combining a multiscale model for the anhysteretic behavior and the Jiles-Atherton theory is proposed to simulate precisely the MBNenergy hysteresis cycles. The use of the multiscale model allows
separating the contributions of domain wall motion and magnetization rotation mechanisms. The satisfying simulation results validate the approach and constitute a major step toward a comprehensive simulation tool dedicated to MBN.
Keywords
3
1 - Introduction
Magnetic tests have been performed for many years to evaluate the integrity of steel components in areas including transportation, energy production and civil construction [1][2]. The magnetic signatures of a tested specimen reflect its nature, its composition and its history.
Although magnetism is normally thought of as a bulk phenomenon, its origins lie in quantum mechanics phenomena at atomic level. However, the macroscopic magnetic behavior as observed at the human scale is deeply influenced by multi-physics interactions happening through different space scales. The real-time control of the magnetic behavior provides an indirect way to control the structural properties of a tested specimen. For example, the presence of residual stresses, micro cracks, precipitations can be evaluated through magnetic measurements. Magnetic evaluation methods are miscellaneous including the Magnetic Incremental Permeability (MIP) [3]-[5], the Magnetic Barkhausen Noise (MBN) [6]-[9], the Harmonic Analysis (HA) [10], the Magnetic Flux Leakages (MFL) [11]-[13] ... They all rely on the magnetization process but specific sensors and/or signal treatments make them sensitive to some properties and not to others. Complementary observations can be obtained by coupling these methods. The Micro-magnetic Multi-parameter Microstructure and stress Analysis 3MA device combines by instance 3 of these magnetic signatures to get upgraded structural analysis [14]. Most of the magnetic control devices, including 3MA, rely on rejection thresholds set through fastidious characterization campaigns on well-known standard specimens. According to Dobmann [15], “3MA is a matured technology and a wide field of applications is given. However, besides the success story we also can find critical remarks from industrial users. These are mainly to the calibration efforts and problems of recalibration if a sensor has to be changed because of damage by wear. Therefore actual emphasis of R&D is to generalize calibration procedures”. In this domain, the expectation for simulation tools able
4
to anticipate the magnetic signature, improve the understanding and avoid fastidious and uncertain experimental pre-characterizations is strong.
Among all magnetic methods, MBN control is probably the most popular. The first MBN studies over control purposes have been published in the middle of the twentieth century [16]. MBN acquisition is relatively easy and its analysis brings important data about the micro-structure. The MBN comes from the rough magnetization or demagnetization processes of a ferromagnetic material submitted to one or more external excitations (magnetic [17], thermal [18][19] or even mechanical [20]). At the demagnetized state, the magnetic domain distribution is strongly unstable and even an insignificant external stimulus can modify this distribution [21]. During the magnetization/demagnetization processes, some domains nucleate, grow, while others reduce and disappear. All these domain size variations are associated to domain wall motions and local magnetic flux variations possible to record with dedicated sensors. In bulk specimens, the MBN signal is a stochastic phenomenon and the MBN raw signal observed from one magnetization cycle to another will always be significantly different. Actually, the domain distribution is so instable and unpredictable that identical Barkhausen answers never happen.
MBN is never exploited through its raw signal. Time independent indicators like the MBNenergy
introduced in the next part of this article are always preferred [22]. In this study we propose a simulation method combining a multiscale model for the anhysteretic behavior and the Jiles-Atherton theory. By fictitiously forcing the magneto-crystalline anisotropy energy, a separation of the magnetization mechanisms (domain wall motion, magnetization rotation) is possible. Accurate simulation results of the MBNenergy(H) hysteresis loops are obtained after
5
The first part of this article is dedicated to the MBNenergy(H) cycles and to their physical
meaning. The simulation method is introduced right after. Comparisons between simulated and experimental results follow, and conclusions are provided in the last part of the article.
2 - Magnetic Barkhausen noise energy
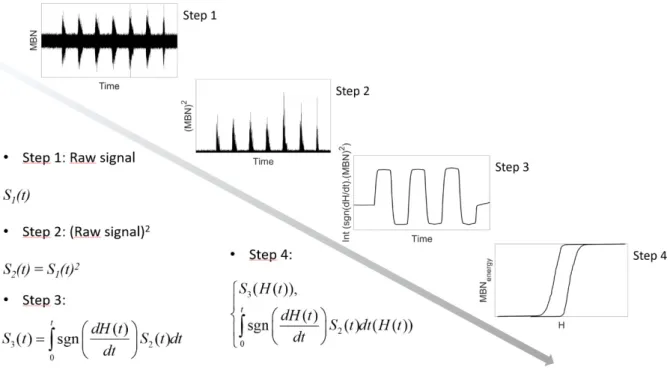
Since the beginning of the magnetic Barkhausen noise (MBN) controls, researchers and users have always tried to replace the erratic raw signal with refined and stable parameters. The RMS value or the signal envelop have most of the time been chosen [23]-[25]. More recently, in [26]-[28] another parameter has been described. This parameter called Magnetic Barkhausen Noise energy (MBNenergy) can be obtained through Eq. 1:
(
)
2 0 . . T energy Barkhausen dH MBN sgn V dt dt =
(1)VBarkhausen is the MBN raw signal. By plotting the MBNenergy as a function of H, a hysteresis cycle MBNenergy(H) is obtained. Although the so-called MBNenergy is not, strictly speaking, an energy,
it is connected to domain wall kinetic energy as discussed hereafter. During the magnetization process, the abrupt displacement of a domain wall gives rise to a flux variation over time, which in turn induces a voltage in the dedicated sensor coil. Considering the Faraday's law of induction, the induced voltage V is proportional to the magnetization rate of change dM/dt (Eq. 2):
∝
(2)This average magnetization rate of change can be interpreted as the sum of local magnetization rate of change dm/dt:
1
.
dM
dm
d
6
This time differential dm/dt can be decomposed as:
dm
dm dx
dt
=
dx dt
(5)In most of the material, inside magnetic domains, the term dm/dx is zero since there is no spatial variation of the magnetization. The term is nonzero only in magnetic walls. If we assume that in domain walls the spatial variation of magnetization is constant (with its value depending on the wall width), the time differential of the local magnetization is proportional to dx/dt interpreted as the domain wall velocity. As a result, the sensor voltage V is proportional to the domain wall velocity.
∝
. Ω
(6)In a practical situation, where a multitude of domain walls are displaced quasi simultaneously and over different locations within the material, the resulting signal is made out of microsecond pulses, which are the superimposition (whether constructive or destructive) of these induced pulses. By integrating the square of the signal (Eq. 1), the resulting area of the
MBNenergy(H) cycle is an image of the kinetic energy spent during the magnetization process.
7
Fig. 1 – MBNenergy(H) construction process
MBNenergy amplitude depends on the Barkhausen sensor parameters and on the acquisition
properties. Unlike the classic B(H) loops, it is impossible to compare the MBNenergy(H) cycles
without a rescaling step. On the other hand, renormalizing MBNenergy using B amplitude as
illustrated in Fig. 2 below leads to interesting observations. The renormalizations are set once the Y-axis levels of the inflexion points coincide. For ferromagnetic materials characterized by high magneto-crystalline anisotropy, B(H) and MBNenergy(H) look similar. For these materials,
the domain wall motion contribution is dominant in the magnetization process. Iron Silicon (FeSi) - GO electrical steel is one of them (Fig. 2, top, left and right-hand plots). In contrast, stronger differences can be noticed when it comes to materials of low magneto-crystalline anisotropy, where both domain wall motion and magnetization rotation contribute to the magnetization process even at relatively low magnetic field levels. Iron Cobalt (FeCo) electrical steels belong to this category (Fig. 2, bottom, left and right-hand plots). The B(H) and the MBNenergy(H) curves depicted in Fig. 2 have all been measured using the experimental setup described in the 4th section of this manuscript.
8
Fig. 2 – Comparison B(H) / MBNenergy(H) hysteresis loops for FeSi and FeCo specimens.
FP10 and RN Iron Cobalt laminations are composed of 49% Fe, 49% Co and 2% V. The RN grade is fully crystallized and its yield strength is 400 MPa, the FP10 yield strength reaches 1000 MPa. FeCo materials exhibit a weak magneto-crystalline anisotropy energy level, promoting the appearance of a strong rotation contribution under small magnetic field excitation. In Fig. 2 bottom, left and right-hand plots, large differences can be observed beyond the inflexion point of the FeCo FP10 and FeCo RN. This is particularly noticeable comparing the dB/dH and the
dMBNenergy/dH saturation slopes.
3 - Simulation method
9
Most of the MBN models available in the scientific literature focus on reproducing the raw signal as observed experimentally [29]-[31]. In this study, we propose an alternative approach based on the MBNenergy and on the observations described previously.
MBN control devices usually work below the quasi-static frequency threshold. The magnetization is consequently supposed to be homogeneous within the sample. Under such conditions, the classical hysteresis behavior (evolution of the magnetization M as a function of the magnetic excitation H and in a collinear situation) has been successfully simulated using the Jiles-Atherton (J-A) theory [32]-[34].
The J-A theory relies on physical insights into the magnetization process and limited number of parameters. The J-A model in its first version is limited to scalar situations, it is frequency independent and it suffers from the accommodation issue which can be described as the incapability of the model to simulate closed minor loops [35]-[37]. In the J-A theory, the magnetization M of a ferromagnetic material can be decomposed into the reversible (Mrev)
and the irreversible (Mirr) contributions [32]-[34].
rev irr
M =M +M (7)
Mrev, Mirr and Manh the anhysteretic magnetization are linked through a proportionality
coefficient c (eq. 8 below). c can be obtained experimentally by calculating the ratio between the Rayleigh zone differential susceptibilities of the first and anhysteretic magnetization curves:
(
)
rev an irr
M
=
c M
−
M
(8)He is defined as the effective field (eq. 9 below). It is an equivalent magnetic field excitation
experienced locally by the ferromagnetic material. He combines the external magnetic
10
moderated by a mean field parameter α. According to the J-A theory α is associated to the inter domain coupling:
e
H
= +
H
α
M
(9) Magnetic state and magnetic excitation are connected through an anhysteretic relation, such as a Langevin-type equation: coth e anh s e H a M M a H = − (10)The anhysteretic magnetization Manh can be interpreted as the magnetic state of an ideal
ferromagnetic material where the magnetic domains would move in a lattice defect and obstacle free matter. A hyperbolic sigmoid function can be used as well to describe this relation: tanh e anh s H M M a = (11)
Ms is the saturation magnetization and a an anhysteretic magnetization trajectory parameter
which can be obtained using eq. 12 below [32]-[34]:
0 b k a m
θ
µ
= (12)kB is the Boltzmann constant, θ the temperature, μ0 the vacuum permeability and m the local
domain magnetization (ideally equal to Ms).
The anhysteretic and irreversible magnetization are connected through eq. 13, where k is the domain wall pinning parameter:
irr anh irr
e
dM M M
dH k
δ
−
= (13)
δ is a directional parameter which ensures that energy is always lost through dissipation [33].
1 / 0 1 / 0 if dH dt if dH dt
δ
δ
= + ≥ = − < (14)11
Combining the equations above leads to the expression of the differential permeability:
(1 ) 1 (1 ) irr anh e e irr anh e e dM dM c c dH dH dM dM dM dH c c dH dH
α
α
− + = − − − (15)This differential permeability calculus constitutes the final stage of the J-A time resolution algorithm. Its H integration leads to the induction field as illustrated below:
0 ( ) . ( ) dM ( ). B t H t t dt dH dH
µ
= + −
(16)As illustrated in the results section, the J-A model provides accurate simulation results for the FeSi and the FeCo – RN specimens. However, the FeCo – FP10 exhibits sharp slope variations, large coercive field absolute values and extreme permeability in the linear area, impossible to simulate precisely with the J-A model in its original form. An option can be to use the extension proposed by Sablik et al. (J.A.S) [38]-[40]. This extension has been developed to include the description of magneto-mechanical effects into the standard J-A model. It consists in adding a stress-dependent supplementary perturbation field in the definition of the effective field
. The effective field then becomes:
= + + (17)
This additional stress-induced field term is a fictitious magnetic field defined as [38]:
= cos² ∅ − ! sin² ∅$ (18)
% $ is the magnetostriction strain of the material, more precisely the component measured parallel to the applied magnetic field. &' is the applied stress, assumed to be uniaxial, ( is the angle between the applied stress axis and the magnetic field H. ! is the Poisson ratio of the material. For the sake of simplicity, it is very often assumed that ∅ = 0, meaning that the uniaxial stress is parallel to the magnetic field. Under this condition Eq. 18 reduces to:
12
= (19)
This model then only considers uniaxial configurations (uniaxial stress parallel to the magnetic field). It can be used as a practical tool to adjust the J-A model predictions. The simplest magnetostriction model consists in considering the magnetostriction term % as a quadratic function of the magnetization , and independent of stress. % $ is then defined as:
% $ = * ² (20)
In the case of the FeCo alloys considered in this study, the saturation magnetization + is approximately 1.91 106 A.m-1, and the magnetostriction constants are %
,'' = 101 10-6 and %,,, = 27 10-6 [41]. It is classical (assuming uniform stress within the material [42]) to define the saturation magnetostriction %-. as:
%-. =/%,''+/%,'' (21)
This approximately corresponds here to %-. = 57 10-6, which allows a rough identification of the coefficient * (* = %-. / +): * = 1.55 10-17 m²A-2.
Using the J.A.S. extension of the J-A model, it is found that a good accordance between simulated and experimental results can be found with a value &' = - 7.4 MPa. It is recalled that there is no applied stress during the magnetic measurements performed in this study, so that this stress value &' can only be interpreted as a fictitious stress allowing a better description of the material behavior. However, and despite the very simplified assumptions of the adopted model, it can be interpreted as an order of magnitude of the internal stresses remaining in the material after processing. Indeed, the difference between the two grades of FeCo alloys (RN and FP10) is the degree of recrystallization during the fabrication process. The recrystallization is interrupted much earlier in the case of the FP10 grade, so that it can be expected that the level of internal stress should be higher. Given the restrictions of the J.A.S
13
extension (stress-independent magnetostriction, one-parameter magnetostriction model, uniaxial magneto-elastic configuration), there is no quantitative value in this analysis, but an observation that the results are consistent with the expected trends.
3.2 – The multiscale model
The general idea of the multiscale model [43] is to deduce the macroscopic response of a ferromagnetic material from a simplified description of its microstructure evolution. An energetic approach at the magnetic domain scale, and dedicated scale transition rules are used for that purpose. The strength of the multiscale model is its predictive nature: the knowledge of the specimen composition and corresponding physical properties combined with crystallographic texture is enough to anticipate the magnetic behavior. The explanation below gives a general overview of the model, more details can be found elsewhere [41]-[44].
3.2.1 Micromagnetic/grain scale
Ferromagnetic materials are treated as an aggregate of single crystals, or grains. Each grain is described as a collection of magnetic domains which are divided into domain families. A domain family is characterized by its magnetic orientation α. The distribution of the magnetic domain families in a grain is obtained through the introduction of a specific internal variable: the volume fraction 12. A potential energy (eq. 22) is calculated for each domain family and defined as the sum of three contributions: the magneto-crystalline (eq. 23), magnetostatic (eq. 24) and magneto-elastic (eq. 25) energies:
32 = 324+ 325+ 326 (22)
324 = 7
, *,* + * * + * *,$ + 7 *,* * (23)
325= −8'92. :2 (24)
14
*,, * , * are the direction cosines of the magnetization at the domain scale (:2 = + ?2= [*, * * ]). 7, and 7 are the magnetocrystalline energy constants. 92, :2, ;2 and =2 are the magnetic field, the magnetization, the stress tensor and the magnetostriction strain tensor, respectively, at the magnetic domain scale. As a usual simplification, stress and magnetic field can be considered uniform within a single crystal so that 92= 9B and ;2= ;B.
It is then convenient to introduce the internal variable 12 corresponding to the volume fraction of the domain family . At the single crystal (grain) scale, the energetic equilibrium is obtained through the use of an explicit evolution law for the volume fraction 12 (eq. 26).
1
2=
∑ exp -GJexp -GH IH IJ$J$ (26)L+ is an additional material parameter and was shown to be correlated to the initial macroscopic anhysteretic suscpetibility
χ
0of the material [42]:
L+ = MHN (27)
At the grain scale, the elastic behavior is supposed to be homogeneous, the single crystal magnetostriction strain is therefore calculated from averaging the local magnetostriction over all domains.
=B =〈=2〉= ∑α 1α=2 (28)
The single crystal magnetization is calculated following the same idea :
:R= 〈: 〉 = ∑ 1S S : (29)
3.2.2 Polycrystalline scale
In this study, all the ferromagnetic specimens are polycrystalline materials, i.e. made out of a large number of grains. As a result of this polycrystalline nature, the magnetic field and the stress are not uniform within the material. The definition of the local magnetic field and stress
15
from the macroscopic loading is an arduous task, highly dependent on the material microstructure. This task can be performed using homogenization techniques [42]. A standard simplifying assumption – although not quantitatively accurate – is to consider uniform stress and magnetic field within the material [45].
9B = 9 and ;B = ;.
Where 9 and ; are the macroscopic applied magnetic field and stress. The crystallographic texture of the material can be naturally accounted for by considering the material as an aggregate of individual grains with orientations defined by a specific orientation distribution function (ODF). This ODF can for instance be obtained from Electron Back Scattering Diffraction (EBSD) as in [44].
Knowing the local loading (9B, ;B) applied to each grain and combining this information with their crystallographic orientation, the local free energy can be written (eq. 22), and the volume fraction of each domain family in each grain calculated (eq. 26). The magnetization in each grain is then easily obtained (eq. 29), and the sample magnetization is the result of a simple volume average over the sample (eq. 30).
: = 〈:g〉 (30)
3.2.3 Separation of the domain wall motion and rotation contribution in the multiscale
model
The multiscale model has already been used with success for the prediction of the anhysteretic magnetic and magneto-elastic behavior of a variety of ferromagnetic materials [42]-[45]. Its strong physical connections to the experimental reality offer opportunities which can be exploited to simulate specific magnetic behavior aspects. In this study, where we want to simulate MBNenergy, the domain wall motion contribution has to be isolated from the rotation
16
K1 with a very high value. This results in a very high magneto-crystalline energy (Eq. 17) which
virtually forbids any rotation behavior in the material. The magnetization process is then just the result of domain wall motion. Fig. 3 below shows the simulated anhysteretic curves of a typical FeSi GO (Fig. 3 - a) and of a typical FeCo (Fig. 3 – b). Rolling and transverse directions are presented. The simulation parameters and crystallographic texture data come from [44] for FeSi GO and [41] for FeCo. The crystallographic textures were measured using the EBSD technique. Corresponding pole figures can be found in [41, 44] and are not reproduced here. A representative number of crystallographic orientations were then picked up. Each orientation was used to apply the procedure described in section 3.2.1, and the averaging operation presented in section 3.2.2 was then applied to obtain the polycrystal macroscopic behavior. It was shown in [41] and [44] that 60, 400 and 650 orientations can satisfactorily describe the crystallographic texture of FeSi GO, FeCo RN and FeCo FP10, respectively. It is classical that the number of requested orientations is smaller when the crystallographic texture is stronger. It is also worth noticing that the statistical description used for the anhysteretic behavior does not take the grain size into consideration, assuming that the grain size mostly affects hysteresis phenomenon, but not significantly the anhysteretic behavior. In Fig. 3, the plain lines describe the magnetic behavior of the material, the red dots and the black squares the behavior calculated when domain rotation is prohibited using very high values for K1.
17
Fig. 3 – a Simulated anhysteretic behavior for the rolling and the transverse directions of a FeSi GO lamination. Straight line all contributions included, red dots and black squares domain wall motions only.
Fig. 3 – b Simulated anhysteretic behavior for the rolling and the transverse directions of a FeCo RN lamination. Straight line all contributions included, red dots and black squares domain wall motions only.
18
Fig. 3 – c Simulated anhysteretic behavior for the rolling and the transverse directions of a FeCo FP10 lamination. Straight line all contributions included, red dots and black squares domain wall motions only.
Up to more than 1 kA/m of excitation field, the “no rotation” simulation of the FeSi Go material shows no difference with the standard simulation. This is due to the high magneto-crystalline anisotropy in this material, which requires high magnetic field level to allow the magnetization to rotate out of the easy axes. It is also evident that, due to a strong crystallographic texture, the responses along rolling and transverse directions are very different. In contrast, the FeCo alloys show a much weaker crystallographic texture and smaller magneto-crystalline anisotropy constants. This results in a quasi-isotropic in-plane behavior - very slight difference between rolling and transverse directions. The low magneto-crystalline anisotropy values also result in a stronger contribution of magnetization rotation in the magnetization process. The standard and "no rotation" simulations are then significantly different. It is also worth noticing that the difference between rolling and transverse responses is stronger for the "no rotation" simulation. This is explained by the fact that easy magnetization rotation favors the
19
uniformization of the behavior in the different directions, contributing to a better macroscopic isotropy.
3 – Combination Jiles-Atherton model / multiscale model for the simulation of the
MBNenergy(H) hysteresis cycle
As presented previously, the J-A model operates under a limited number of 5 parameters. Among these 5 parameters, 3 of them can be classified as the hysteresis parameters: α (the
J-A inter domain coupling parameter), k (the average energy to break the pinning sites parameter) and c (the reversible/irreversible magnetization moderator parameter). They show no influence on the anhysteretic behavior and depend exclusively on the domains walls kinetic. Therefore, for the simulation of the MBNenergy(H) hysteresis cycles, these 3 parameters
can be set through optimization and comparisons with classic B(H) experimental results. Once optimized values are obtained, they are conserved for the MBNenergy simulation. Concerning
the anhysteretic behavior, the “no rotation” multiscale model simulation results will be used. Two options can be envisaged [46][47]:
_ to define an analytical sigmoid-type expression using a curve fitting software. _ to use a direct linear interpolation of the multiscale simulated data.
Both solutions lead to the same accuracy but simulation times are reduced with the analytical expression.
4 - Experimental set-up
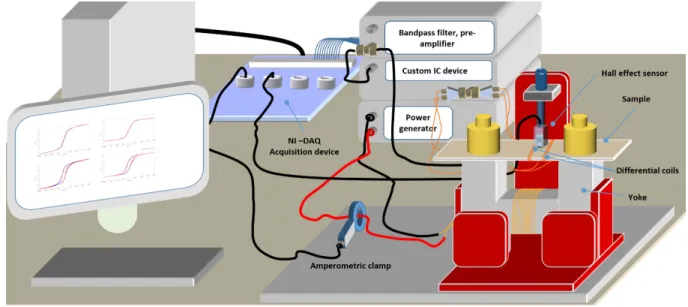
A dedicated experimental setup has been developed for the simultaneous MBN and induction characterization of a ferromagnetic lamination. Fig. 4 below depicts the 3D overview of this experimental setup.
20
Fig. 4 – Overall 3D view of the experimental setup.
A magnetic excitation field H was produced by a 125 turns coil. This coil was wound around a large section, high permeability, U magnetic circuit used to drive the magnetic flux up to the tested specimen. A high-voltage, high current, KEPCO BOP 36-28MG amplifier in an electrical current regulation configuration supplied the excitation coil (up to ± 36 V and ± 28 A). The KEPCO amplifier can be controlled either from its control panel or from an external source (in our case, the National Instrument DAQ USB-6346 acquisition device). This setup allows
synchronizing the excitation signal with the sampling window and tuning the excitation waveform. The tested specimen was itself wound with two 100-turns coils, in opposite directions, as described by Moses et al. in [48] (see Fig. 6 below). Unlike [48], the voltage drop over a single coil is monitored as well. This differential and the common-mode measurements are performed simultaneously to be able to plot the MBN and the magnetic flux variation. Differential measurement of the MBN signal reduces the parasitic noises and interferences impacting both coils quasi simultaneously.
21
Fig. 5 – Focus on the Barkhausen noise sensor coils.
The tangent surface excitation field H was measured with a noise shielded radiometric linear Hall Effect probe (SS94A from Honeywell) positioned between the sensor coils and in contact with the tested sample. The National instrument DAQ USB-6346 ensured the signals acquisition. The raw signals were acquired and duplicated to feed an analogic treatment stage, namely band-pass filtering (Khron-Hite 3362 filter). The critical frequencies were set to 3 and 10 kHz, and the input and output pre-amplification gains to 40dB and 30dB, respectively. For comparison purpose, numerical and analogic methods were performed simultaneously to get the MBN energy. The analogical treatment includes:
• A band-pass filtering stage using a MAX274ACN analogic filter IC.
• An AD633 analog multiplier.
• A low noise operational amplifier LT1001 in an integrator setup and an external switch push button allowing a reset of the integration process at the beginning of each new measurement.
A numerical integration of the common-mode measurement is used to plot the induction field variations. A numerical correction is performed to get rid of the undesired drift due to the integration step.
5 - Comparisons simulations/experimental results
Comparisons simulations/measurements are proposed for the validation of the approach. The classical B(H) hysteresis cycles are displayed on the top left-hand plots of Fig. 6 – a, b. B(H)
22
simulations have to be done first as the J-A hysteresis parameters (α, k and c) are set through these simulations. They are kept afterwards for the simulation of the MBNenergy(H) cycles. The
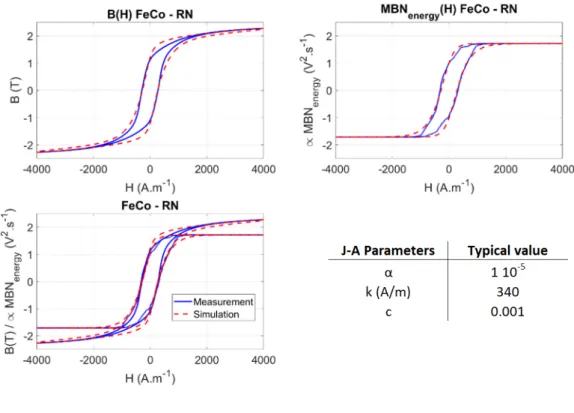
α, k and c adjusted combination is set through an optimization method based on an error function (for details, see [28][37][49]). Fig. 6 – a, b and c depict FeCo RN, FeCo FP10 and FeSi response along rolling direction, respectively. Measurements are shown in plain lines and simulation results in dashed lines. The simulation parameters are provided on the bottom right-hand part of each figure. Comparisons simulations/measurements for the MBNenergy(H)
cycles are shown on the top right-hand plots but only for the FeCo samples since FeSi B(H) and
MBNenergy(H) are very close. Finally, on the bottom left-hand plots are superimposed B(H) and MBNenergy(H) comparisons.
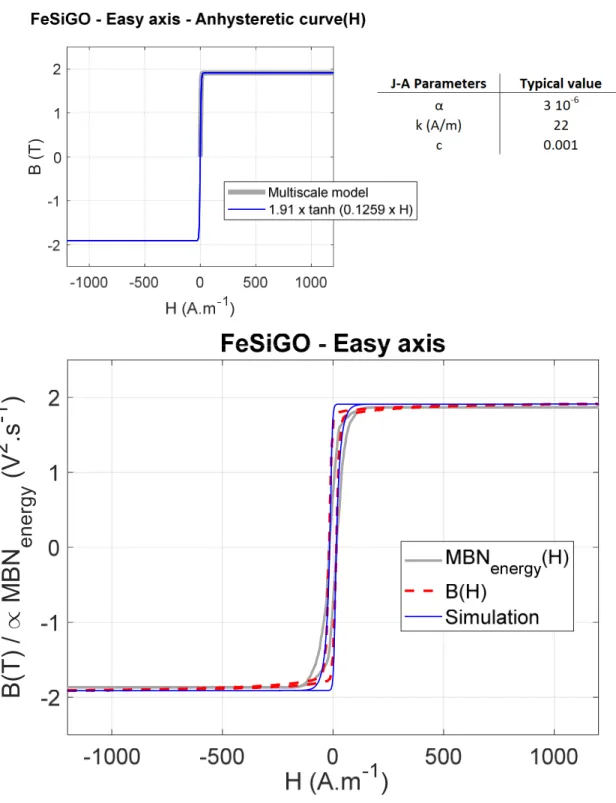
For the sake of illustration, the top left-hand plot of Fig. 6 – c, shows the analytical sigmoid-type expression used for the anhysteretic contribution and its comparison with the output of the multiscale model in the case of the FeSi GO.
Fig. 6 – a Comparisons simulations/experimental results, B(H) and MBNenergy(H) for the FeCo - RN including the simulation
23
Fig. 6 – b Comparisons simulations/experimental results, B(H) and MBNenergy(H) for the FeCo – FP 10 including the
simulation parameters. -4000 -2000 0 2000 4000 H (A.m-1) -2 -1 0 1 2 B ( T ) B(H) FeCo - FP10 -2000 -2000 0 2000 4000 H (A.m-1) -2 -1 0 1 2 M B N e n e rg y ( V 2 .s -1 ) MBN energy(H) FeCo - FP10 -4000 -2000 0 2000 4000 H (A.m-1) -2 -1 0 1 2 B (T ) / M B Ne n e rg y ( V 2 .s -1 ) FeCo - FP 10 Measurement Simulation
24
Fig. 6 – c Comparisons simulations/experimental results, B(H) and MBNenergy(H) for the FeSiGO – Easy axis including the
simulation parameters.
In the multiscale model, by intentionally forcing the influence of the magneto-crystalline anisotropy energy, magnetization rotation can be pushed back to extreme magnetic excitation values. This procedure results in an anhysteretic contribution totally free of magnetization
B
(T
)
/
M
B
N
e
n
e
rg
y
(
V
2
.s
-1
)
B ( T )25
rotation and where the only contribution to magnetization is from domain wall motion. As illustrated in Fig.6 – a,b,c, by the original combination of the J-A and multiscale model, the simulation of the B(H) and MBNenergy(H) hysteresis was achieved for all the specimen tested
even when both domain wall motion and magnetization rotation were significant contributors to the magnetization behavior. Succeeding in the simulation of the MBNenergy(H) hysteresis
cycles constitutes an important step forward to the understanding and simulation of MBN processes.
6 - Conclusions
Three different materials were characterized by means of macroscopic hysteresis loops and Magnetic Barkhausen Noise (MBN) measurements. The plots of MBNenergy as a function of the
magnetic field were renormalized to the B(H) curves, taking the saturation-knee inflexion point as reference. It was shown that MBNenergy cycles exhibit strong similarities with standard B(H) hysteresis cycles. However, while the B(H) loops result from two distinct magnetization
mechanisms - namely domain wall motion and magnetization rotation - the MBNenergy is only
the manifestation of domain wall motion, and insensitive to magnetization rotation. Using a combination of a multiscale model and the classical Jiles-Atherton or Jiles-Atherton-Sablik approaches, it was possible to simulate the response of a magnetic material both including and removing the magnetization rotation contribution. The first assumption is used to simulate standard B(H) loops and the second for MBNenergy cycles.
The simulation results are very conclusive and constitute an important first step toward the simulation of the MBN signals as observed experimentally and used in the NDT&E magnetic control devices. The modelling approach presented here allows a satisfying description of
26
MBNenergy cycles, notably including the effect of crystallographic texture. The perspectives of
this work include:
_ the pre-determination of the MBNenergy rescaling coefficient. Up to now, this coefficient is
set through a comparison process, but a precise knowledge of the tested specimens and of the experimental parameters (sensor coil information …) should be enough to pre-calculate this coefficient.
_ the definition of an inverse procedure: by starting with the B(H) measurement, the MBNenergy
can be extracted and the time variation of the MBN raw signal envelope reconstructed. _ the study of magneto-elastic effects on both the B(H) and MBNenergy (H) magnetic signatures.
27
References
[1] D.C. Jiles, “Review of magnetic methods for nondestructive evaluation”, NDT int., vol. 21, iss. 5, pp. 311-319, 1988.
[2] Z.D. Wang, Y. Gu, Y.S. Wang, “A review of three magnetic NDT technologies”, J. Magn. Magn. Mater., vol. 324, iss. 4, pp. 382-388, 2012.
[3] A. Yashan, G. Dobmann, "Measurements and semi-analytical modeling of incremental permeability using eddy current coil in the presence of magnetic hysteresis" in Int. Workshop on Electromagn. Nondestruct. Eval., Amsterdam, The Netherlands: IOS Press, pp. 150-160, 2002.
[4] T. Matsumoto, B. Ducharne, T. Uchimoto, “Numerical model of the Eddy Current Magnetic Signature (EC-MS) non-destructive micro-magnetic technique”, AIP Advance, n° 035045, 2019. [5] B. Gupta, T. Uchimoto, B. Ducharne, G. Sebald, T. Miyazaki, T. Takagi, “Magnetic incremental permeability non-destructive evaluation of 12 Cr-Mo-W-V Steel creep test samples with varied ageing levels and thermal treatments”, NDT & E Int., Vol. 104, pp. 42-50, 2019.
[6] A. Vincent, L. Pasco, M. Morin, X. Kleber, M. Delmondedieu, “Magnetic Barkhausen noise from strain-induced martensite during low cycle fatigue of 304L austenitic stainless steel”, Acta Mat., vol. 53, Iss. 17, pp. 4579-4591, 2005.
[7] O. Stupakov, “Stabilization of Barkhausen noise readings by controlling a surface field waveform”, Meas. Sci. Techn., vol. 25, 015604, 2014.
[8] J. Capo-Sanchez, J.A. Perez-Benitez, L.R. Padovese, “Analysis of the stress dependent magnetic easy axis in ASTM 36 steel by the magnetic Barkhausen noise”, NDT&E Int., vol. 40, pp. 168–172, 2007. [9] J.A. Pérez-Benited, J. Capo-Sanchez, and L.R. Padovese, “Long-range field effects on magnetic Barkhausen noise”, Phys. Rev. B, vol. 76, 024406, 2007.
[10] G. Dobmann, H. Pitsch, P. Höller, V. Hauk, G. Dobmann, C. O. Ruud, R. E. Green, "Magnetic tangential field-strength inspection a further NDT tool for 3MA" in Nondestructive Characterization of Materials, Berlin, Germany: Springer-Verlag, vol. 3, pp. 636-643, 1989.
[11] A. Joshi, L. Udpa, S. Udpa, A. Tamburrino, "Adaptive wavelets for characterizing magnetic flux leakage signals from pipeline inspection", IEEE Trans. Magn., vol. 42, no. 10, pp. 3168-3170, 2006. [12] Y. Li, G. Y. Tian, S. Ward, “Numerical simulation on magnetic flux leakage evaluation at high speed”, NDT&E Int., vol. 39, iss. 5, pp. 367-373, 2006.
[13] K. Mandal, D.L. Atherton, “A study of magnetic flux-leakage signals”, J. Phys. D: Appl. Phys., vol. 31, n°22, 1998.
[14] G. Dobmann, I. Altpeter, B. Wolter, R. Kern, "Industrial applications of 3MA—Micromagnetic multiparameter microsctructure and stress analysis" in Electromagnetic Nondestructive Evaluation (XI), Amsterdam, The Netherlands: IOS Press, 2008.
[15] G. Dobmann, "Physical basics and industrial applications of 3MA-micromagnetic multiparameter microstructure and stress analysis", Proc. ENDE Conf., pp. 1-12, 2007.
28
[16] J.T.T. Goldsmith, M.E. Ray, “Device for testing magnetic materials”, US Patent 2,448,794, A, 1948.
[17] A. Dhar, D.L. Atherton, “Influence of magnetizing parameters on the magnetic Barkhausen noise”, IEEE Trans. Magn., 1992.
[18] P. Wang, X. Ji, X. Yan, L. Zhu, H. Wang, G. Tian, E. Yao, “Investigation of temperature effect of stress detection based on Barkhausen noise”, Sens. Actuator A-Phys., vol. 194, pp. 232-239, 2013.
[19] J. Baro, S. Dixon, R.S. Edwards, Y. Fan, D. S. Keeble, L. Manosa, A. Planes, E. Vives, “Simultaneous detection of acoustic emission and Barkhausen noise during the martensitic transition of a Ni-Mn-Ga magnetic shape-memory alloy, Phys. Rev. B, vol. 88, 174108, 2013.
[20] M. Lindgren, T. Lepistö, “Application of a novel type Barkhausen noise sensor to continuous fatigue monitoring”, NDT&E Int., vol. 33, iss. 6, pp. 423-428, 2000.
[21] G. Bertotti, “Hysteresis in magnetism”, academic press, New-York, 1998.
[22] T.W. Krause, L. Clapham, D.L. Atherton, “Characterization of the magnetic easy axis in pipeline steel using magnetic Barkhausen noise”, J. Appl. Phys., vol. 75, pp. 7983-7988, 1994.
[23] X. Kleber, A. Vincent, “On the role of residual internal stresses and dislocations on Barkhausen noise in plastically deformed steel”, NDT&E Int., vol. 37, pp. 439-445, 2004.
[24] X. Kleber, S. Pirfo Barroso, “Investigation of shot-peened austenitic stainless steel 304L by means of magnetic Barkhausen noise”, Mater. Sci. Eng. A, vol. 527, iss. 21-22, pp. 6046-6052, 2010.
[25] K. Gurruchaga, A. Martinez-de-guerenu, M. Soto, F. Arizti, “Magnetic Barkhausen noise for characterization of revovery and recrystallization”, IEEE Trans. Magn., vol. 46, iss. 2, pp. 513-516, 2010. [26] B. Ducharne, B. Gupta, Y. Hebrard, J. B. Coudert, “Phenomenological model of Barkhausen noise under mechanical and magnetic excitations”, IEEE Trans. Magn., vol. 99, pp. 1-6, 2018.
[27] B. Ducharne, MQ. Le, G. Sebald, PJ. Cottinet, D. Guyomar, Y. Hebrard, “Characterization and modeling of magnetic domain wall dynamics using reconstituted hysteresis loops from Barkhausen noise”, J. Magn. Magn. Mater., vol. 432, pp. 231-238, 2017.
[28] B. Gupta, B. Ducharne, T. Uchimoto, G. Sebald, T. Miyazaki, T. Takagi, “Non-destructive testing on creep degraded 12% Cr-Mo-W-V ferritic test samples using Barkhausen noise”,. J. Magn. Magn. Mater.,
vol. 498, pp. 166102, 2020.
[29] J.A. Pérez-Benitez, J. Capo-Sanchez, L.R. Padovese, “Simulation of the Barkhausen noise using random field Ising model with long-range interaction”, Comp. Mat. Sci., vol. 44, iss. 3, pp. 850-857, 2009.
[30] N.P. Gaunkar, O. Kypris, I.C. Nlebedim, D.C. Jiles, “Analysis of Barkhausen noise emissions and magnetic hysteresis in multi-phase magnetic materials”, IEEE. Trans. Magn., vol. 50, iss. 11, n° 7301004, 2014.
[31] B. Alessandro, C. Beatrice, G. Bertotti, A. Montorsi, “Domain-wall dynamics and Barkhausen effect metallic ferromagnetic materials. I. Theory”, J. Appl. Phys., vol. 68, 2901, 1990.
29
[32] D.C Jiles, D.L Atherton, “Ferromagnetic hysteresis”, IEEE Trans. Magn., vol. 19, pp. 2183-2185, 1983.
[33] D.C. Jiles, D.L. Atherton, “Theory of ferromagnetic hysteresis”. J. Appl. Phys. 55, pp. 2115, 1984. [34] D.C Jiles, D.L Atherton, “Theory of ferromagnetic hysteresis”, J. Magn. Magn. Mater., vol. 61, pp. 48-60, 1986.
[36] J.V. Leite, A. Benabou, N. Sadowski, “Accurate minor loops calculation with a modified Jiles-Atherton model”, Compel, vol. 28, iss. 3, 2009.
[35] S.E. Zirka, Y.I. Moroz, R.G. Harisson, K. Chwastek, “On physical aspects of the Jiles-Atherton hysteresis model”, J. Appl. Phys., vol. 112, 043916, 2012.
[37] B. Gupta, B. Ducharne, G. Sebald, T. Uchimoto, T. Moyazaki, T. Takagi, “Physical interpretation of the microsctructure for aged 12 Cr-Mo-V-W steel creep test samples based on simulation of magnetic incremental permeability, J. Magn. Magn. Mater., vol. 486, 165250, 2019.
[38] M.J. Sablik, D.C. Jiles, “Coupled magnetoelastic theory of magnetic and magnetostrictive hysteresis”, IEEE Trans. Magn., vol. 29, iss. 4, pp. 2113, 1993.
[39] J. Li, M. Xu, “Modified Jiles-Atherton-Sablik model for asymmetry in magnetomechanical effect under tensile and compressive stress”, J. Appl. Phys., vol. 110, n° 6, pp. 063918 – 1 - 4, Sep. 2011. [40] M.J. Sablik, “A model for asymmetry in magnetic property behavior under tensile and compressive stress in steel”, IEEE Trans. Magn., vol. 33, iss. 5, pp. 3958, 1997.
[41] M. Rekik, “Mesure et modélisation du comportement magnéto-mécanique dissipatif des matériaux ferromagnétiques à haute limite élastique sous chargement multiaxial: application aux génératrices à grandes vitesses pour l'aéronautique”, PhD, LMT ENS Cachan, 2014 (in French).
[42] L. Daniel, O. Hubert, N. Buiron, R. Billardon, “Reversible magneto-elastic behavior: a multiscale approach”, J. Mech. Phys. Solids, vol. 56, pp. 1018-1042, 2008.
[43] L. Daniel, M. Rekik, O. Hubert, “A multiscale model for magneto-elastic behaviour including hysteresis effects”, Arch. Appl. Mech., vol. 84, iss. 9, pp. 1307-1323, 2014.
[44] O. Hubert, L. Daniel, “Multiscale modeling of the magneto-mechanical behavior of grain-oriented silicon steels”, J. Magn. Magn. Mater., vol. 320, pp. 1412-1422, 2008.
[45] L. Daniel, O. Hubert, M. Rekik, “A simplified 3-D constitutive law for magnetomechanical behavior”, IEEE Trans. Magn., vol. 51, iss. 3, 7300704, 2015.
[46] L. Bernard, B.J. Mailhé, S.L. Ávila, L. Daniel, N.J. Batistela, N. Sadowski, “Magnetic hysteresis under compressive stress: a multiscale-Jiles-Atherton approach“, IEEE Trans. Magn., 56(2):7506304, 2020. [47] B. Sai Ram, A.P.S. Baghel, S.V. Kulkarni, L. Daniel, I.C. Nlebedim, “Inclusion of dynamic losses in a scalar magneto-elastic hysteresis model derived using multi-scale and Jiles-Atherton approaches“, IEEE Trans. Magn., 56(3):7510105, 2020.
[48] A. J. Moses, H. V. Patel, P. I. Williams, “AC Barkhausen noise in electrical steels: influence of sensing technique on interpretation of measurements”, J. Electr. Eng., vol. 57, n°8, pp. 3-8, 2006.
30
[49] S. Zhang, B. Ducharne, T. Uchimoto, A. Kita, Y.A. Tene Deffo, “Simulation tool for the Eddy current magnetic signature (EC-MS) non-destructive method”, J. Magn. Magn. Mater., vol. 513, 167221, 2020. DOI: 10.1016/j.jmmm.2020.167221