Publisher’s version / Version de l'éditeur:
Vous avez des questions? Nous pouvons vous aider. Pour communiquer directement avec un auteur, consultez la première page de la revue dans laquelle son article a été publié afin de trouver ses coordonnées. Si vous n’arrivez pas à les repérer, communiquez avec nous à PublicationsArchive-ArchivesPublications@nrc-cnrc.gc.ca.
Questions? Contact the NRC Publications Archive team at
PublicationsArchive-ArchivesPublications@nrc-cnrc.gc.ca. If you wish to email the authors directly, please see the first page of the publication for their contact information.
https://publications-cnrc.canada.ca/fra/droits
L’accès à ce site Web et l’utilisation de son contenu sont assujettis aux conditions présentées dans le site LISEZ CES CONDITIONS ATTENTIVEMENT AVANT D’UTILISER CE SITE WEB.
ACS Omega, 4, 16, pp. 16774-16780, 2019-09-30
READ THESE TERMS AND CONDITIONS CAREFULLY BEFORE USING THIS WEBSITE. https://nrc-publications.canada.ca/eng/copyright
NRC Publications Archive Record / Notice des Archives des publications du CNRC : https://nrc-publications.canada.ca/eng/view/object/?id=cbdee7c7-db84-480b-aafd-36a7137dae61 https://publications-cnrc.canada.ca/fra/voir/objet/?id=cbdee7c7-db84-480b-aafd-36a7137dae61
NRC Publications Archive
Archives des publications du CNRC
This publication could be one of several versions: author’s original, accepted manuscript or the publisher’s version. / La version de cette publication peut être l’une des suivantes : la version prépublication de l’auteur, la version acceptée du manuscrit ou la version de l’éditeur.
For the publisher’s version, please access the DOI link below./ Pour consulter la version de l’éditeur, utilisez le lien DOI ci-dessous.
https://doi.org/10.1021/acsomega.9b01512
Access and use of this website and the material on it are subject to the Terms and Conditions set forth at
To pass or not to pass: predicting the blood–brain barrier permeability
with the 3D-RISM-KH molecular solvation theory
To Pass or Not To Pass: Predicting the Blood−Brain Barrier
Permeability with the 3D-RISM-KH Molecular Solvation Theory
Dipankar Roy,
†Vijaya Kumar Hinge,
†and Andriy Kovalenko
*
,†,‡†
Department of Mechanical Engineering, University of Alberta, 10-203 Donadeo Innovation Centre for Engineering, 9211-116 Street NW, Edmonton, Alberta T6G 1H9, Canada
‡
Nanotechnology Research Centre, 11421 Saskatchewan Drive, Edmonton, Alberta T6G 2M9, Canada
*
S Supporting InformationABSTRACT: Predicting the ability of chemical species to cross the blood−brain barrier (BBB) is an active field of research for development and mechanistic understanding in the pharmaceutical industry. Here, we report the BBB permeability of a large data set of compounds by incorporating molecular solvation energy descriptors computed by the 3D-RISM-KH molecular solvation theory. We have been able to show, for the first time, that the computed excess chemical potential in different solvents can be
successfully used to predict permeability of compounds in a binary manner (yes/no) via a minimum-descriptor-based model. Our findings successfully combine the molecular solvation theory with the machine learning approach to address one of the most daunting challenges in predictive structure−activity relationship modeling. The workflow presented in this work is simple enough to be used by nonexperts with ease.
■
INTRODUCTIONThe tight junction blood−brain barrier (BBB) is a complex structure regulating the flow of chemicals into the brain.1,2The
function of BBB is to separate systemic blood flow from the central nervous system. This in turn controls diffusion and transport of chemicals between the two. The modes of entrance of a chemical into the central nervous system are either via diffusion across the BBB or via a transport system containing (non-)specific transporter enzymes/proteins. De-velopment of (new) drug candidates that target different parts of the human central nervous system depends extensively on the capability of the target molecule to pass the enigmatic BBB. The most common quantitative index of such a capability of a molecule is reported by the log BB,3 a logarithmic ratio of concentrations of drug in the brain and in blood. The experiments to measure log BB are cumbersome, time-consuming, and low yield. This promoted development of a plethora of methods involving artificial membranes for in vitro prediction/measurements. The most common of these methods is the PAMPA assay, which uses an artificial membrane to measure, help mimic, and get a crude estimate of passive permeability.4,5The simplicity of this method is that it produces reliable predictions based on the lipid membrane, whereas the chief drawback comes from the absence of any active transporter. Such complexities in generating log BB data from experiments have promoted in silico methods in predicting BBB permeability of compounds using multitudes of molecular descriptors.6−10
The application of various computer-aided statistical methods in predicting BBB permeability is abundant in the literature.11−15
These reports differ in the number and types of compounds incorporated in the predictions and the number of descriptors used in the predictive modeling. This often leads to overfitting and resulting models that fail to predict log BB
values for molecules beyond the class for which the model is trained. Hence, the size of the database used in training plays a prominent role in all these modeling methods. We have recently reported a minimum-descriptor-based model contain-ing solvation energy parameters for predictcontain-ing log BB with reasonable accuracy and broad applicability.16The very limited availability of reliable log BB data handicaps the development of log BB prediction methods. There are efforts to supplement the “black-box”-like predictive models in ADMET properties based on a data set of ∼200 compounds.17,18These reports suggest a continuing need of predictive models for the blood− brain permeability prediction with broader applicability.
The binary prediction method, on the other hand, unlike the log BB experiments depends on qualitative results. Such databases contain very simple results pertaining to the success of a molecule in crossing the BBB (Active = yes) or failure to do so (Active = no). Such databases for blood−brain permeability were reported by various authors and are easy to assemble. The key feature of these databases is that they classify compounds into three classes, namely, active(yes), inactive(no), and borderline(yes/no). Despite sounding simple, this particular type of data set is not so, as it depends on the choice of scale or more commonly the threshold of classification. For example, Cruciani et al.19 denoted compounds as (i) BBB+ (permeable) if log BB ≥ −0.3 and (ii) BBB− (non-permeable) if log BB < −0.3; Li et al.20on the
other hand used ≥ −0.1 or < −0.1 as a reference point for dividing their data set; finally, Adenot and Lahana21classified their data set based on the CNS activity. Several studies reported predictive models for the so-called BBB± prediction
Received: May 23, 2019 Accepted: August 5, 2019 Published: September 30, 2019
Article http://pubs.acs.org/journal/acsodf
Cite This:ACS Omega2019, 4, 16774−16780
Derivative Works (CC-BY-NC-ND) Attribution License, which permits copying and redistribution of the article, and creation of adaptations, all for non-commercial purposes.
with variable accuracy. These models contain more than 60 molecular descriptors, at least. The first attempt to reduce the number of descriptors was reported by Zhao et al.22by using
19 molecular descriptors and several fragmentation schemes yielding an overall accuracy of 90%. The most useful descriptors for predicting BBB permeability, as proposed by these reports, were polar surface area, number of hydrogen bond donor and acceptor atoms, molecular weight, log P, log
D, number of rotatable bonds, and molar volume. The only
descriptors related to solvation used in these models were log P and accessible surface area. The process of a permeation of a drug from plasma into the brain involves several solvation− desolvation processes. We have thus decided to incorporate solvation parameters as a descriptor in predicting BBB± via the 3D-RISM-KH molecular solvation theory. The other aim of this work is to build on to a minimum-descriptor-based model for predicting BBB± with high accuracy. The present work differs from our previous work in two major points. First, the present work aims in correct classification of blood−brain permeability and is not of interest in calculating/predicting blood−brain permeability coefficients as described in the previous work. Second, the predictive scheme used here strives to remove the universal correction scheme from the modeling scheme, as the need of corrected solvation energy is replaced with the excess chemical potential and partial molar volume of solutes in a specific solvent as direct descriptors for prediction. The three-dimensional reference interaction site model with the Kovalenko−Hirata closure (3D-RISM-KH) molecular solvation theory is based on first-principles statistical mechanics. The essence of this theory is based on the 3D distribution functions of solvent interaction sites around the solute molecule of arbitrary shape.23−26A detailed description
of the theory is presented elsewhere.27−29
The 3D-RISM-KH theory describes a molecule using a six-dimensional vector composed of three positional {r} and three orientational {Θ} degrees of freedom in the molecular Ornstein−Zernike equation, developing to the pair correlation functions (PCF) of r and Θ of liquids. The 3D distribution functions of solvent interaction sites around a solute molecule of arbitrary shape are obtained from the 3D-RISM integral equation. The 3D-RISM integral equation has an exact differential of the solvation free energy for the KH closure, which provides an analytical expression of Kirkwood’s thermodynamic integration even-tually providing the chemical potential (both excess and total) associated with the solvation process. The solvation free energy of the solute macromolecule is obtained by summation of these 3D-solvation free energy density partial contributions over all solvent sites in the whole space. Other thermodynamic quantities can be derived from the solvation free energy by differentiation, thus providing an option to decompose the contributions from the entropy and enthalpy terms. Two significant advantages of the 3D-RISM-KH theory are (i) the capability of providing distribution of solvent molecules around a solute of arbitrary shapes with reasonable accuracy and (ii) calculation of partial molar volume of a solute. The latter property calculation is a leap forward from the traditional way of calculating them as a sum of small molecular fragments of regular geometry only. The major drawback of this theory is overestimation of the solvation energy, and an efficient “universal correction” scheme was developed and used for calculating correct solvation energy.16,30,31
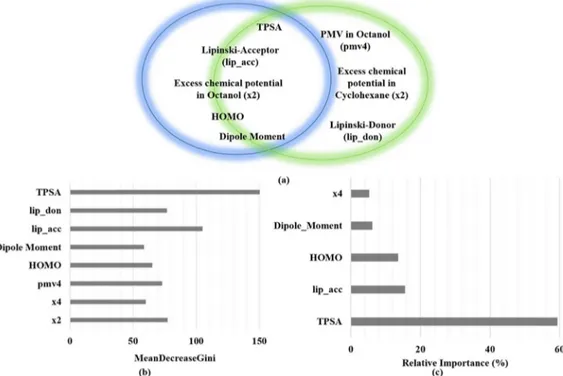
Figure 1.Summary of statistical analysis: (a) Important variables selected via random forest (green circle, eight descriptors) and gradient boost machine (blue circle, five descriptors) algorithms; (b) variable importance as calculated by the random forest algorithm; (c) relative importance of variables predicted by the gradient boost machine method. The overlapping zone of the two circles contains descriptors common to both of the machine learning approaches. MeanDecreaseGini is the mean of a variable’s total decrease in node impurity weighted by the proportion of samples reaching that specific node in each individual decision tree in a random-forest-based classification. The larger is this value, the larger is the contribution of the corresponding descriptor.
ACS Omega Article
DOI:10.1021/acsomega.9b01512
ACS Omega2019, 4, 16774−16780
■
RESULTS AND DISCUSSIONThe objectives of this manuscript are (i) to use the 3D-RISM-KH molecular solvation theory calculated uncorrected solvation parameter, the excess chemical potential in solvent, as descriptors in successful prediction on the BBB± database as a proof of concept and (ii) to develop a minimal-descriptor-based model for such prediction. To this purpose, we have calculated molecular descriptors out of which 27 descriptors were selected via statistical importance analysis. Other 10 descriptors generated via the 3D-RISM-KH calculations are excess chemical potential and partial molar volumes in five different solvents. These 37 descriptors (variables in the QSAR equation) were subjected to further analysis in predicting permeability for BBB±. The summary of these descriptors is provided in theSupporting Information. Further analysis of the importance of these 27 variables in predicting permeability through the gradient boosting machine (GBM) and random forest (RF) method filtered out five and eight most important descriptors, respectively. These descriptors, as shown inFigure 1, are topological polar surface area (TPSA), highest occupied molecular orbital (HOMO), dipole moment, Lipinski H-bond acceptor count, Lipinski H-bond donor count, excess chemical potential in the n-octanol solvent, partial molar volume of a solute in the n-octanol solvent, and excess chemical potential in the cyclohexane solvent.
For all statistical analysis methods for predicting the importance of variables, we have found that the TPSA32 was the most important descriptor followed by Lipinski’s hydrogen bond donor/acceptor descriptors.33 The important electronic descriptors are HOMO computed at the AM1 level, as well as dipole moment. It is interesting to note that none of the classification methods picked excess chemical potential in water as an important descriptor. The most important solvation-energy-based descriptors are excess chemical poten-tials in n-octanol and cyclohexane media, the former being the major contributor. This observation can be rationalized, as the nonpolar environment provided by a membrane is better represented by n-octanol and/or cyclohexane solvents, whereas the effect of water is taken care of by the other 2D-descriptors pertaining to the polarity of the molecule.
In order to find out the optimal number of descriptors for correct classification of the test set of compounds, we have tested a range in minimum % relative importance of variables (6−12%) in the gradient boost methods on a preliminary set of 37 descriptors. This led us to different choices, further validated by the random forest method, with different numbers of descriptors, for example, (i) model A with 37 descriptors, (ii) model B with 11 descriptors combed using the random forest method, (iii) model C with 11 descriptors obtained from the GBM method, (iv) model D with eight descriptors obtained via random forest analysis on models B and C, and (v) model E with five descriptors obtained via GBM analysis on models B and C. A detailed list of all the descriptors generated for predictive modeling is presented in the
Supporting Information. All these models were first calibrated on the training set before accessing their accuracy in classifying compounds in the test set correctly.
The performances of different models vary significantly based on the method of classification adopted. For all the models, the SVM (Support Vector Machine) predicted results are the best providing an accuracy range of 94−99.0% based on the number of variables chosen. The excellent prediction on
the test set by SVM with Model A can be attributed to fitting with a large number of descriptors. However, the performance of this method remains excellent for other models, too. The GBM and weighted k-nearest neighbor (weighted kNN) techniques work with comparable and consistent accuracy ranging 87−90% for different models. The generalized linear model (GLM) method performed modestly among the four methods providing the best accuracy of ∼84% but with the minimum descriptor model. The accuracy of predictions of different models in classifying the test set compounds as BB-permeable (yes/1) or BB-imBB-permeable (no/0) is summarized inTable 1.
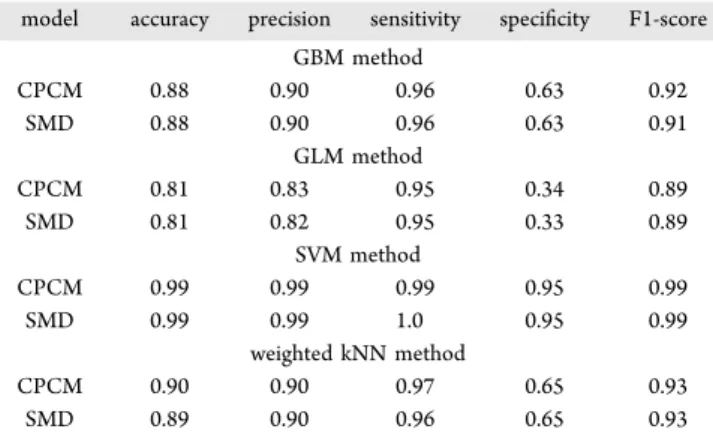
It is necessary to compare the performance of the current generation continuum solvation models, that is, CPCM and SMD, in predicting the permeability. As mentioned in the Database Preparation and Computational Methods section, we have employed the semiempirical AM1 method to calculate solvation energy for the gas-phase optimized structures in the continuum solvation models. The primary importance analysis of the solvation energy parameters calculated via the CPCM and SMD models in predicting permeability showed insignificant dependence of calculated solvation energies in different solvents. However, we performed a modeling exercise with solvation energy descriptors from CPCM and SMD Table 1. Performance Indicesa
of Different Classification Schemes Based on Five Prediction Models with 3D-RISM-KH Calculated Excess Chemical Potentials for the Test Set of Compounds
model accuracy precision sensitivity specificity F1-score GBM method model A 0.89 0.90 0.96 0.65 0.93 model B 0.90 0.91 0.96 0.69 0.93 model C 0.88 0.90 0.94 0.66 0.92 model D 0.90 0.91 0.97 0.67 0.93 model E 0.88 0.89 0.96 0.62 0.92 GLM method model A 0.70 0.82 0.79 0.41 0.81 model B 0.80 0.80 0.93 0.36 0.88 model C 0.84 0.85 0.96 0.42 0.90 model D 0.80 0.82 0.94 0.33 0.88 model E 0.84 0.84 0.99 0.34 0.91 SVM method model A 0.99 0.99 0.99 0.95 0.99 model B 0.97 0.97 0.99 0.90 0.98 model C 0.95 0.96 0.98 0.86 0.97 model D 0.94 0.95 0.98 0.82 0.96 model E 0.92 0.93 0.98 0.75 0.95 weighted kNN method model A 0.90 0.93 0.93 0.77 0.93 model B 0.89 0.90 0.96 0.63 0.98 model C 0.88 0.90 0.95 0.63 0.92 model D 0.88 0.89 0.96 0.62 0.92 model E 0.88 0.89 0.96 0.61 0.92
aFor a measure of percentage of accuracy indices, individual values are
multiplied by 100. The performance indices are calculated as follows: Accuracy = (TP + TN)/(TP + TN + FP + FN). Precision = TP/(TP + FP). Sensitivity = TP/(TP + FN). Specificity = TN/(TN + FP). F1-score = 2 × (precision × sensitivity)/(precision + sensitivity). TP = true positive, TN = true negative, FP = false positive, FN = false negative.
solvation models with other descriptors from model A. The performance of this model is excellent as that of the RISM-KH predictions in model A obtained via the SVM method. The performance parameters of this model are summarized in
Table 2.
Further, to answer the question that we do need the 3D-RISM-KH based parameters for a successful classification model for BB permeability, we re-evaluated the permeability by removing 3D-RISM-KH based descriptors and keeping only the major 2D-molecular descriptor obtained from the previous statistical analysis. These variables are (i) HOMO, (ii) dipole moment, (iii) accessible surface area, (iv) Lipinski H-bond donor count, (v) Lipinski H-bond acceptor count, (vi) log S, (vii) ring count, and (viii) TPSA. This resultant model has a very decent performance, too, although with reduced perform-ance indices, as provided inTable 3. The information provided
by log S and x4 descriptors can be related to the log
P(octanol−water) of the solutes, and it is tempting to build
models with empirical log P as one of the descriptors. We have built models with log P as one of the descriptors within the minimal descriptor approach although without much success (see theSupporting Informationfor the detailed description). We have analyzed over 1800 molecules with reported BBB± properties using different statistical methods to assess the importance of over 100 different molecular descriptors in correctly classifying the permeability. We have found that the
2D-descriptors like TPSA and H-bond donor/acceptors are the most significant ones in the prediction schemes. The excess chemical potentials of the solutes computed in n-octanol and cyclohexane solvents were found to have an important contribution in the classification scheme. This is the first report providing a proof of concept that 3D-RISM-KH solvation theory based predictors can be used successfully to predict the blood−brain barrier permeability of drug (like) molecules in a binary fashion. The accuracy of the predictive models has shown a logical dependence on the number of descriptors used in model building. Thus, one can build a predictive model with perfect classification performance, but requiring a large number of molecular descriptors. One important aspect of this study is in assembling a minimal-descriptor-based model with high accuracy, sensitivity, and specificity. Among different models tested here, the minimum descriptor model, with only five descriptors, bares testimony to this. Few classification studies on blood−brain-barrier permeability, with a limited number of data, used only the 2D-molecular descriptor without incorporating solvation effects. Such models should be used with caution as they are certain to have limitations based on the class/type of chemical functionality used for calibration. In our hand, the model without any solvation terms also provided very reasonable accuracy although the specificity of this model is severely reduced in comparison to other predictive models (Figure 2). The performances of different statistical methods in correct classification vary significantly for different models. The performance of the SVM method in correct classification is found to be the best for all the models. The weighted kNN model also performs well, albeit with reduced specificity. The GBM method is one of the fastest computing methods, at par with the weighted kNN method in performance. The GLM method performed significantly worse than the previous three methods. Predictions based on this method have lowest specificity and precision for our entire data set (Figure 2).
It is important to point that it is easy to perform the entire modeling exercise with the help of simple computer scripts and open source software packages. The methodology developed here has wide practical applicability. The training set (or, for example, the entire data set) can be used for benchmark purposes for classifying new compounds. It is reported in previous studies that the most difficult part in this type of prediction is to correctly classify compounds with a negative permeability class (impermeable, no/0). The SVM-based classification method worked well in this regard, too. The correct prediction of the BBB− compounds is ∼75% with model D and model E. These models used the concept of minimal descriptors in predictive blood−brain barrier perme-ability. We have tested models with hydration excess chemical potential as an additional descriptor but without any improvement in the prediction. The excess chemical potential in n-octanol is the most important one among all excess chemical potentials. Our findings have an extensive application in predicting/classification of BB permeability using Gaussian fluctuation excess chemical potentials obtained from the 3D-RISM-KH theory as descriptors, without the need of an elaborate correction scheme to obtain corrected solvation energy. The models proposed in the works compare well with those reported in previous reports of a minimal-descriptor-based prediction model.21,34In fact, our models have reduced the number of misclassifications over those previously reported despite having a larger number of data points. Our finding that Table 2. Performance Indicesa
of Different Classification Schemes Based on Model A with CPCM and SMD Calculated Solvation Energies for the Test Set of Compounds
model accuracy precision sensitivity specificity F1-score GBM method CPCM 0.88 0.90 0.96 0.63 0.92 SMD 0.88 0.90 0.96 0.63 0.91 GLM method CPCM 0.81 0.83 0.95 0.34 0.89 SMD 0.81 0.82 0.95 0.33 0.89 SVM method CPCM 0.99 0.99 0.99 0.95 0.99 SMD 0.99 0.99 1.0 0.95 0.99 weighted kNN method CPCM 0.90 0.90 0.97 0.65 0.93 SMD 0.89 0.90 0.96 0.65 0.93 a
For a measure of percentage of accuracy indices, individual values are multiplied by 100. See the footnote inTable 1for the definitions of performance indices used.
Table 3. Performance Indicesa
of Different Classification Schemes Based on a Model with Only Eight 2D-Molecular Descriptors
statistical method accuracy precision sensitivity specificity F1-score
GBM 0.87 0.89 0.96 0.60 0.92
GLM 0.81 0.83 0.95 0.33 0.88
SVM 0.96 0.96 0.99 0.87 0.97
weighted kNN 0.87 0.89 0.95 0.59 0.92
aFor a measure of percentage of accuracy indices, individual values are
multiplied by 100. See the footnote inTable 1for the definitions of performance indices used.
ACS Omega Article
DOI:10.1021/acsomega.9b01512
ACS Omega2019, 4, 16774−16780
the SVM-based machine learning approach works the best for blood−brain barrier permeability classification supports the finding by Doniger et al.,34albeit with a smaller data set used for calibration. Finally, the best descriptor for classification schemes is a mixture of 2D-, electronic, and solvation parameters. It is interesting to point that TPSA was reported as the most important descriptor for blood−brain permeability studies for almost all the previous reports, as we report here. The hydrogen bond donor and acceptor are important, too, as they empirically relate to the interactions with the polar medium, like plasma. The excess chemical potentials in n-octanol and cyclohexane solvents are the best possible descriptors to represent solvation energetics associated with a drug actually transferring into a hydrophobic region. A combination of these descriptors provides a balanced model toward correct classification of the blood−brain permeability in the present study.
■
DATABASE PREPARATION AND COMPUTATIONAL METHODSThe database of BBB± compounds was collected from the published works by Adenot and Lahana,21 Li et al.,20 and Doniger et al. and contains 1864 molecules.34 The SMILES code for all the molecules are provided in the Supporting Information. The database is divided into a training set (75% of molecules) and a test set (25% of molecules) by randomly assigning the molecules.
Geometries of all molecules were optimized at the semiempirical AM1 level using the Gaussian16 software package.35,36 The protonation state of the molecules was
retained for a pH of 7.2, and all calculations were done using ionic forms, wherever applicable. Gas-phase optimized geo-metries were further subjected to solvation energy calculations in chloroform, cyclohexane, n-hexadecane, n-octanol, and water continuum using the conductor-like polarizable con-tinuum model (CPCM) and SMD concon-tinuum model at the AM1 level, as implemented in the Gaussian16 software
package.37,38 All RISM-KH calculations (1D for solvent susceptibility functions and 3D for solute excess chemical potential calculations in solvents) were done using our in-house code. A working version of this code is implemented in the AMBERTOOLS suite of programs.39 Five solvents, namely, chloroform, cyclohexane, n-hexadecane, n-octanol, and water, were used for 1D-RISM susceptibility calculations. The parameters for these solvents were validated against experimental solvation energy data sets, as reported by us.16,31
We have employed UFF40parameters with AM1 charges for all solutes. The 3D-RISM-KH calculations were performed using a uniform cubic 3D grid of 128 × 128 × 128 points in the box of size 64 × 64 × 64 Å3 to represent a solute with a few
solvation layers with convergence accuracy set to 10−4of the
modified direct inversion in the iterative subspace (MDIIS) solver.41 The molecular descriptors of all the molecules were generated using the MOE2018 software package.42 All statistical analysis was performed using the Rstudio version 3.4.4.43 Several R packages were used to aid analysis and are briefly described in the following section.44−50
Support vector machines (SVM): SVM is a supervised learning technique branch of machine learning and applied to both classification and regression problems. The superiority of the SVM model over conventional neural networks is due to the structure risk management principle adopted by it. There are several kernel functions available for SVM to transform data into a dimension with clear division between classes. We have tested linear kernel, Gaussian type radial basis kernel, ANOVA radial basis kernel, and polynomial kernel types to find the best kernel for our classification problem. The best solution was obtained with the Gaussian type radial basis kernel.
Weighted k-nearest neighbor (kNN): kNN is a nonlinear approach initiated with the choice of a set of variables, randomly, to obtain the best solution. The optimization of selection is done by leave-one-out cross validation where each point is removed and predicted as an average of k-nearest points (i.e., molecules, for QSAR analysis). The weighted
version of the kNN is modified over the original implementation by adding weights to the Euclidean distance of the nearest neighbors based on proximity.51
Gradient boost machine (GBM): This technique is similar to random forest, as an ensemble learner, for performing supervised machine learning tasks.52It differs from RF as the
loss function is minimized iteratively to find the best tree model.
Generalized linear model (GLM): This is an improved version over ordinary least square regression for non-continuous data with the assumptions that the residuals are normally distributed and a linear relationship exists between target and model parameters using a form of maximum likelihood estimation.53
The performance of different statistical methods adopted in this manuscript is calculated via construction of a confusion matrix comparing the reported permeability (1/0) against predicted permeability (1/0) for each method and model. The confusion matrix consists of the most important performance indicators as true positive (TP), false positive (FP), true negative (TN), and false negative (FN) counts. This information is used to calculate accuracy, sensitivity, precision, and specificity of each model and method using the following mathematical relations: = + + + + accuracy (TP TN)/(TP TN FP FN) (1) = + precision TP/(TP FP) (2) = + sensitivity TP/(TP FN) (3) = + specificity TN/(TN FP) (4)
Another performance index, the F1-score is also used for evaluation purposes in this work.54The F1-score is a measure of accuracy of a model that combines the model’s accuracy with sensitivity. A perfect model has an F1-score of 1, while that for a failure is 0.
■
ASSOCIATED CONTENT*
S Supporting InformationThe Supporting Information is available free of charge on the
ACS Publications website at DOI: 10.1021/acsome-ga.9b01512.
Data sets, solvation energies, molecular descriptors, the blood−brain barrier permeability, correlation plots, and correlation coefficients relevant to prediction models (PDF)
Training set, test set, and prediction on test set (XLSX)
■
AUTHOR INFORMATIONCorresponding Author
*E-mail:andriy.kovalenko@ualberta.ca.
ORCID
Dipankar Roy:0000-0002-4703-0130
Vijaya Kumar Hinge:0000-0002-1892-512X
Andriy Kovalenko:0000-0001-5033-4314
Author Contributions
The manuscript was written through equal contributions of all the authors. D.R. performed calculations and statistical modeling; V.K.H. generated molecular descriptors. All the authors have given approval to the final version of the manuscript.
Funding
This work was financially supported by the NSERC Discovery Grant (RES0029477) and Alberta Prion Research Institute Explorations VII Research Grant (RES0039402).
Notes
The authors declare no competing financial interest.
■
ACKNOWLEDGMENTSWe acknowledge generous computing time provided by WestGrid (www.westgrid.ca) and Compute Canada/Calcul Canada (www.computecanada.ca).
■
REFERENCES(1) Reese, T. S.; Karnovsky, M. J. Fine Structural Localization of a Blood-Brain Barrier to Exogenous Peroxidase. J. Cell Biol. 1967, 34, 207−217.
(2) Abbott, N. J.; Patabendige, A. A. K.; Dolman, D. E. M.; Yusof, S. R.; Begley, D. J. Structure and Function of the Blood−Brain Barrier.
Neurobiol. Dis. 2010, 37, 13−25.
(3) Bickel, U. How to Measure Drug Transport across the Blood-Brain Barrier. NeuroRX 2005, 2, 15−26.
(4) Mensch, J.; Melis, A.; Mackie, C.; Verreck, G.; Brewster, M. E.; Augustijns, P. Evaluation of Various PAMPA Models to Identify the Most Discriminating Method for the Prediction of BBB Permeability.
Eur. J. Pharm. Biopharm. 2010, 74, 495−502.
(5) Müller, J.; Esső, K.; Dargó, G.; Könczöl, Á.; Balogh, G. T. Tuning the Predictive Capacity of the PAMPA-BBB Model. Eur. J.
Pharma. Sci. 2015, 79, 53−60.
(6) Martins, I. F.; Teixeira, A. L.; Pinheiro, L.; Falcao, A. O. A Bayesian Approach to in Silico Blood-Brain Barrier Penetration Modeling. J. Chem. Inf. Model. 2012, 52, 1686−1697.
(7) Sun, H. A Universal Molecular Descriptor System for Prediction of LogP, LogS, LogBB, and Absorption. J. Chem. Inf. Comput. Sci. 2004, 44, 748−757.
(8) Naik, P.; Cucullo, L. In Vitro Blood−Brain Barrier Models: Current and Perspective Technologies. J. Pharm. Sci. 2012, 101, 1337−1354.
(9) Hou, T. J.; Xu, X. J. ADME Evaluation in Drug Discovery. 3. Modeling Blood-Brain Barrier Partitioning Using Simple Molecular Descriptors. J. Chem. Inf. Comput. Sci. 2003, 43, 2137−2152.
(10) Kaitin, K. I. Obstacles and Opportunities in New Drug Development. Clin. Pharmacol. Ther. 2008, 83, 210.
(11) Castillo-Garit, J. A.; Casanola-Martin, G. M.; Le-Thi-Thu, H.; Pham-The, H.; Barigye, S. J. A Simple Method to Predict Blood-Brain Barrier Permeability of Drug- Like Compounds Using Classification Trees. Med. Chem. 2017, 13, 664−669.
(12) Luco, J. M. Prediction of the Brain−Blood Distribution of a Large Set of Drugs from Structurally Derived Descriptors Using Partial Least-Squares (PLS) Modeling. J. Chem. Inf. Comput. Sci. 1999,
39, 396−404.
(13) Norinder, U. Support Vector Machine Models in Drug Design: Applications to Drug Transport Processes and QSAR Using Simplex Optimisations and Variable Selection. Neurocomputing 2003, 55, 337−346.
(14) Hemmateenejad, B.; Miri, R.; Safarpour, M. A.; Mehdipour, A. R. Accurate Prediction of the Blood−Brain Partitioning of a Large Set of Solutes Using Ab Initio Calculations and Genetic Neural Network Modeling. J. Comput. Chem. 2006, 27, 1125−1135.
(15) Wang, Z.; Yang, H.; Wu, Z.; Wang, T.; Li, W.; Tang, Y.; Liu, G. In Silico Prediction of Blood−Brain Barrier Permeability of Compounds by Machine Learning and Resampling Methods.
ChemMedChem 2018, 13, 2189−2201.
(16) Roy, D.; Hinge, V. K.; Kovalenko, A. Predicting Blood−Brain Partitioning of Small Molecules Using a Novel Minimalistic Descriptor-Based Approach via the 3D-RISM-KH Molecular Solvation Theory. ACS Omega 2019, 4, 3055−3060.
ACS Omega Article
DOI:10.1021/acsomega.9b01512
ACS Omega2019, 4, 16774−16780
(17) Gleeson, M. P. Generation of a Set of Simple, Interpretable ADMET Rules of Thumb. J. Med. Chem. 2008, 51, 817−834.
(18) Douguet, D. Data Sets Representative of the Structures and Experimental Properties of FDA-Approved Drugs. ACS Med. Chem.
Lett. 2018, 9, 204−209.
(19) Cruciani, G.; Pastor, M.; Guba, W. VolSurf: A New Tool for the Pharmacokinetic Optimization of Lead Compounds. Eur. J.
Pharm. Sci. 2000, 11, S29−S39.
(20) Li, H.; Yap, C. W.; Ung, C. Y.; Xue, Y.; Cao, Z. W.; Chen, Y. Z. Effect of Selection of Molecular Descriptors on the Prediction of Blood−Brain Barrier Penetrating and Nonpenetrating Agents by Statistical Learning Methods. J. Chem. Inf. Model. 2005, 45, 1376− 1384.
(21) Adenot, M.; Lahana, R. Blood-Brain Barrier Permeation Models: Discriminating between Potential CNS and Non-CNS Drugs Including P-Glycoprotein Substrates. J. Chem. Inf. Comput.
Sci. 2004, 44, 239−248.
(22) Zhao, Y. H.; Abraham, M. H.; Ibrahim, A.; Fish, P. V.; Cole, S.; Lewis, M. L.; de Groot, M. J.; Reynolds, D. P. Predicting Penetration Across the Blood-Brain Barrier from Simple Descriptors and Fragmentation Schemes. J. Chem. Inf. Model. 2007, 47, 170−175.
(23) Chandler, D.; McCoy, J. D.; Singer, S. J. Density Functional Theory of Nonuniform Polyatomic Systems. I. General Formulation.
J. Chem. Phys. 1986, 85, 5971−5976.
(24) Chandler, D.; McCoy, J. D.; Singer, S. J. Density Functional Theory of Nonuniform Polyatomic Systems. II. Rational Closures for Integral Equations. J. Chem. Phys. 1986, 85, 5977−5982.
(25) Lowden, L. J.; Chandler, D. Solution of a New Integral Equation for Pair Correlation Functions in Molecular Liquids. J.
Chem. Phys. 1973, 59, 6587−6595.
(26) Kovalenko, A.; Hirata, F. A Molecular Theory of Liquid Interfaces. Phys. Chem. Chem. Phys. 2005, 7, 1785−1793.
(27) Kovalenko, A. Molecular Theory of Solvation: Methodology Summary and Illustrations. Condens. Matter Phys. 2015, 18, 32601.
(28) Kovalenko, A.; Gusarov, S. Multiscale Methods Framework: Self-Consistent Coupling of Molecular Theory of Solvation with Quantum Chemistry, Molecular Simulations, and Dissipative Particle Dynamics. Phys. Chem. Chem. Phys. 2018, 20, 2947−2969.
(29) Kovalenko, A. Multiscale Modeling of Solvation. In Springer
Handbook of Electrochemical Energy; Breitkopf, C., Swider-Lyons, K.,
Eds.; Springer Berlin Heidelberg: Berlin, Heidelberg, 2017; pp 95− 139.
(30) Palmer, D. S.; Frolov, A. I.; Ratkova, E. L.; Fedorov, M. V. Towards a Universal Method for Calculating Hydration Free Energies: A 3D Reference Interaction Site Model with Partial Molar Volume Correction. J. Phys.: Condens. Matter 2010, 22, 492101.
(31) Roy, D.; Kovalenko, A. Performance of 3D-RISM-KH in Predicting Hydration Free Energy: Effect of Solute Parameters. J.
Phys. Chem. A 2019, 123, 4087−4093.
(32) Ertl, P.; Rohde, B.; Selzer, P. Fast Calculation of Molecular Polar Surface Area as a Sum of Fragment-Based Contributions and Its Application to the Prediction of Drug Transport Properties. J. Med.
Chem. 2000, 43, 3714−3717.
(33) Lipinski, C. A.; Lombardo, F.; Dominy, B. W.; Feeney, P. J. Experimental and Computational Approaches to Estimate Solubility and Permeability in Drug Discovery and Development Settings. Adv.
Drug Delivery Rev. 1997, 23, 3−25.
(34) Doniger, S.; Hofmann, T.; Yeh, J. Predicting CNS Permeability of Drug Molecules: Comparison of Neural Network and Support Vector Machine Algorithms. J. Comput. Biol. 2002, 9, 849−864.
(35) Dewar, M. J. S.; Zoebisch, E. G.; Healy, E. F.; Stewart, J. J. P. Development and Use of Quantum Mechanical Molecular Models. 76. AM1: A New General Purpose Quantum Mechanical Molecular Model. J. Am. Chem. Soc. 1985, 107, 3902−3909.
(36) Frisch, M. J.; Trucks, G. W.; Schlegel, H. B.; Scuseria, G. E.; Robb, M. A.; Cheeseman, J. R.; Scalmani, G.; Barone, V.; Petersson, G. A.; Nakatsuji, H. et al.. Gaussian16, revision B.01; Gaussian Inc.: Wallingford, CT, 2016. Complete citation is provided in the Supporting Information.
(37) Cossi, M.; Rega, N.; Scalmani, G.; Barone, V. Energies, structures, and electronic properties of molecules in solution with the C-PCM solvation model. J. Comput. Chem. 2003, 24, 669−681.
(38) Marenich, A. V.; Cramer, C. J.; Truhlar, D. G. Universal Solvation Model Based on Solute Electron Density and on a Continuum Model of the Solvent Defined by the Bulk Dielectric Constant and Atomic Surface Tensions. J. Phys. Chem. B 2009, 113, 6378−6396.
(39) Case, D. A.; Ben-Shalom, I. Y.; Brozell, S. R.; Cerutti, D. S.; Cheatham, T. E., III; Cruzeiro, V. W. D.; Darden, T. A.; Duke, R. E.; Ghoreishi, D.; Gilson, M. K. et al.. AMBER; 2018, University of California: San Francisco.
(40) Rappe, A. K.; Casewit, C. J.; Colwell, K. S.; Goddard, W. A.; Skiff, W. M. UFF, a Full Periodic Table Force Field for Molecular Mechanics and Molecular Dynamics Simulations. J. Am. Chem. Soc. 1992, 114, 10024−10035.
(41) Kovalenko, A.; Ten-no, S.; Hirata, F. Solution of three-dimensional reference interaction site model and hypernetted chain equations for simple point charge water by modified method of direct inversion in iterative subspace. J. Comput. Chem. 1999, 20, 928−936. (42) Molecular Operating Environment (MOE)), 2013.08; Chemical Computing Group Inc.: Montreal, Canada, 2016.
(43) Team, R. Core. R: A Language and Environment for Statistical
Computing; R Foundation for Statistical Computing: Team, R. Core:
Vienna, Austria, 2011.
(44) Robinson, D.; Gomez, M.; Demeshev, B.; Menne, D.; Nutter, B.; Johnston, L.; Bolker, B.; Briatte, F.; Arnold, J.; Gabry, J.; Broom:
Convert Statistical Analysis Objects into Tidy Data Frames; 2017.
(45) Wickham, H. ggplot2: Elegant Graphics for Data Analysis; Springer-Verlag: New York, 2009.
(46) Kuhn, M. Building Predictive Models in R Using the Caret Package. J. Stat. Software 2008, 1, 1−26.
(47) Ridgeway, G. Generalized Boosted Models: A Guide to the gbm
Package. R package vignette, 2007. http://CRAN.R-project.org/ package=gbm
(48) Liaw, A.; Wiener, M. Classification and Regression by randomForest. R News 2002, 2, 18−22.
(49) Meyer, D.; Dimitriadou, E.; Hornik, K.; Weingessel, A.; Leisch, F. e1071: Misc Functions of the Department of Statistics (e1071), TU
Wien. R package version 1.5−18, 2008.http://CRAN.R-project.org/ package=e1071
(50) Schliep, K.; Hechenbichler, K. Weighted k-Nearest Neighbors for
Classification, Regression and Clustering. R package version 1.3, 2016.
https://cran.r-project.org/package=kknn
(51) Gou, J.; Du, L.; Zhang, Y.; Xiong, T. A new distance-weighted k-nearest neighbor classifier. J. Info. Comput. Sci. 2012, 9, 1429−1436. (52) James, G.; Witten, D.; Hastie, T.; Tibshirani, R. Tree-Based Methods. In An Introduction to Statistical Learning: with Applications in
R; James, G., Witten, D., Hastie, T., Tibshirani, R., Eds.; Springer New
York: New York, NY, 2013; pp 303−335.
(53) Chambers, J. M.. Extending R; 2016 Chapman and Hall/CRC.: (54) Powers, D. M. Evaluation: From Precision, Recall and F-measure to ROC, Informedness, Markedness & Correlation. J. Mach.