arXiv:1209.1140v1 [hep-ex] 5 Sep 2012
Measurement of the ratio of three-jet to two-jet cross sections
in p ¯
p
collisions at
√
s
= 1.96 TeV
V.M. Abazov,32 B. Abbott,68 B.S. Acharya,26M. Adams,46 T. Adams,44 G.D. Alexeev,32 G. Alkhazov,36 A. Altona,57 A. Askew,44 S. Atkins,55 K. Augsten,7 C. Avila,5 F. Badaud,10 L. Bagby,45 B. Baldin,45 D.V. Bandurin,44S. Banerjee,26 E. Barberis,56 P. Baringer,53 J.F. Bartlett,45 U. Bassler,15V. Bazterra,46 A. Bean,53 M. Begalli,2L. Bellantoni,45S.B. Beri,24 G. Bernardi,14 R. Bernhard,19I. Bertram,39 M. Besan¸con,15 R. Beuselinck,40P.C. Bhat,45S. Bhatia,59V. Bhatnagar,24G. Blazey,47S. Blessing,44 K. Bloom,60 A. Boehnlein,45 D. Boline,65E.E. Boos,34G. Borissov,39A. Brandt,71O. Brandt,20R. Brock,58A. Bross,45 D. Brown,14J. Brown,14
X.B. Bu,45 M. Buehler,45 V. Buescher,21 V. Bunichev,34 S. Burdinb,39 C.P. Buszello,38E. Camacho-P´erez,29 B.C.K. Casey,45H. Castilla-Valdez,29 S. Caughron,58 S. Chakrabarti,65 D. Chakraborty,47 K.M. Chan,51
A. Chandra,73E. Chapon,15 G. Chen,53 S. Chevalier-Th´ery,15 S.W. Cho,28 S. Choi,28 B. Choudhary,25 S. Cihangir,45 D. Claes,60 J. Clutter,53 M. Cooke,45 W.E. Cooper,45 M. Corcoran,73 F. Couderc,15 M.-C. Cousinou,12 A. Croc,15 D. Cutts,70 A. Das,42 G. Davies,40 S.J. de Jong,30, 31 E. De La Cruz-Burelo,29 F. D´eliot,15 R. Demina,64D. Denisov,45S.P. Denisov,35 S. Desai,45 C. Deterre,15 K. DeVaughan,60 H.T. Diehl,45 M. Diesburg,45P.F. Ding,41A. Dominguez,60 A. Dubey,25 L.V. Dudko,34 D. Duggan,61 A. Duperrin,12 S. Dutt,24
A. Dyshkant,47M. Eads,60 D. Edmunds,58 J. Ellison,43 V.D. Elvira,45 Y. Enari,14H. Evans,49A. Evdokimov,66 V.N. Evdokimov,35G. Facini,56 L. Feng,47 T. Ferbel,64 F. Fiedler,21 F. Filthaut,30, 31 W. Fisher,58 H.E. Fisk,45
M. Fortner,47 H. Fox,39 S. Fuess,45 A. Garcia-Bellido,64J.A. Garc´ıa-Gonz´alez,29 G.A. Garc´ıa-Guerrac,29 V. Gavrilov,33 P. Gay,10 W. Geng,12, 58 D. Gerbaudo,62 C.E. Gerber,46 Y. Gershtein,61 G. Ginther,45, 64 G. Golovanov,32A. Goussiou,75P.D. Grannis,65 S. Greder,16H. Greenlee,45G. Grenier,17 Ph. Gris,10J.-F. Grivaz,13
A. Grohsjeand,15S. Gr¨unendahl,45 M.W. Gr¨unewald,27T. Guillemin,13 G. Gutierrez,45 P. Gutierrez,68J. Haley,56 L. Han,4 K. Harder,41 A. Harel,64 J.M. Hauptman,52 J. Hays,40T. Head,41 T. Hebbeker,18 D. Hedin,47 H. Hegab,69 A.P. Heinson,43 U. Heintz,70 C. Hensel,20 I. Heredia-De La Cruz,29 K. Herner,57G. Heskethf,41
M.D. Hildreth,51 R. Hirosky,74 T. Hoang,44 J.D. Hobbs,65 B. Hoeneisen,9 J. Hogan,73 M. Hohlfeld,21 I. Howley,71 Z. Hubacek,7, 15 V. Hynek,7 I. Iashvili,63 Y. Ilchenko,72R. Illingworth,45 A.S. Ito,45 S. Jabeen,70
M. Jaffr´e,13 A. Jayasinghe,68 M.S. Jeong,28R. Jesik,40 P. Jiang,4 K. Johns,42 E. Johnson,58 M. Johnson,45 A. Jonckheere,45 P. Jonsson,40J. Joshi,43 A.W. Jung,45A. Juste,37 E. Kajfasz,12D. Karmanov,34P.A. Kasper,45
I. Katsanos,60R. Kehoe,72 S. Kermiche,12 N. Khalatyan,45A. Khanov,69A. Kharchilava,63 Y.N. Kharzheev,32 I. Kiselevich,33 J.M. Kohli,24 A.V. Kozelov,35J. Kraus,59A. Kumar,63A. Kupco,8 T. Kurˇca,17 V.A. Kuzmin,34
S. Lammers,49 G. Landsberg,70 P. Lebrun,17 H.S. Lee,28 S.W. Lee,52 W.M. Lee,45 X. Lei,42 J. Lellouch,14 D. Li,14 H. Li,11 L. Li,43 Q.Z. Li,45 J.K. Lim,28 D. Lincoln,45 J. Linnemann,58 V.V. Lipaev,35 R. Lipton,45
H. Liu,72 Y. Liu,4 A. Lobodenko,36 M. Lokajicek,8 R. Lopes de Sa,65 H.J. Lubatti,75 R. Luna-Garciag,29 A.L. Lyon,45 A.K.A. Maciel,1R. Madar,19 R. Maga˜na-Villalba,29S. Malik,60 V.L. Malyshev,32 Y. Maravin,54
J. Mart´ınez-Ortega,29 R. McCarthy,65 C.L. McGivern,41 M.M. Meijer,30, 31 A. Melnitchouk,45 D. Menezes,47 P.G. Mercadante,3 M. Merkin,34 A. Meyer,18 J. Meyer,20 F. Miconi,16 N.K. Mondal,26M. Mulhearn,74 E. Nagy,12
M. Naimuddin,25 M. Narain,70 R. Nayyar,42H.A. Neal,57 J.P. Negret,5 P. Neustroev,36 H.T. Nguyen,74 T. Nunnemann,22 J. Orduna,73N. Osman,12 J. Osta,51 M. Padilla,43A. Pal,71N. Parashar,50V. Parihar,70 S.K. Park,28R. Partridgee,70 N. Parua,49 A. Patwa,66B. Penning,45 M. Perfilov,34 Y. Peters,20 K. Petridis,41
G. Petrillo,64 P. P´etroff,13 M.-A. Pleier,66 P.L.M. Podesta-Lermah,29 V.M. Podstavkov,45A.V. Popov,35 M. Prewitt,73 D. Price,49 N. Prokopenko,35 J. Qian,57A. Quadt,20 B. Quinn,59 M.S. Rangel,1 K. Ranjan,25
P.N. Ratoff,39 I. Razumov,35P. Renkel,72 I. Ripp-Baudot,16 F. Rizatdinova,69 M. Rominsky,45 A. Ross,39 C. Royon,15P. Rubinov,45 R. Ruchti,51 G. Sajot,11 P. Salcido,47 A. S´anchez-Hern´andez,29 M.P. Sanders,22 A.S. Santosi,1 G. Savage,45L. Sawyer,55T. Scanlon,40R.D. Schamberger,65 Y. Scheglov,36 H. Schellman,48 C. Schwanenberger,41R. Schwienhorst,58 J. Sekaric,53H. Severini,68 E. Shabalina,20 V. Shary,15 S. Shaw,58 A.A. Shchukin,35 R.K. Shivpuri,25V. Simak,7 P. Skubic,68 P. Slattery,64D. Smirnov,51 K.J. Smith,63 G.R. Snow,60
J. Snow,67 S. Snyder,66 S. S¨oldner-Rembold,41 L. Sonnenschein,18 K. Soustruznik,6 J. Stark,11 D.A. Stoyanova,35 M. Strauss,68 L. Suter,41 P. Svoisky,68M. Titov,15V.V. Tokmenin,32 Y.-T. Tsai,64K. Tschann-Grimm,65
W.M. van Leeuwen,30 N. Varelas,46 E.W. Varnes,42 I.A. Vasilyev,35 P. Verdier,17 A.Y. Verkheev,32 L.S. Vertogradov,32M. Verzocchi,45 M. Vesterinen,41 D. Vilanova,15 P. Vokac,7 H.D. Wahl,44 M.H.L.S. Wang,45
J. Warchol,51 G. Watts,75 M. Wayne,51 J. Weichert,21 L. Welty-Rieger,48 A. White,71 D. Wicke,23 M.R.J. Williams,39 G.W. Wilson,53 M. Wobisch,55 D.R. Wood,56 T.R. Wyatt,41 Y. Xie,45 R. Yamada,45 S. Yang,4 T. Yasuda,45 Y.A. Yatsunenko,32 W. Ye,65 Z. Ye,45 H. Yin,45 K. Yip,66 S.W. Youn,45 J.M. Yu,57 J. Zennamo,63 T. Zhao,75 T.G. Zhao,41 B. Zhou,57 J. Zhu,57M. Zielinski,64 D. Zieminska,49 and L. Zivkovic70
(The D0 Collaboration∗)
1LAFEX, Centro Brasileiro de Pesquisas F´ısicas, Rio de Janeiro, Brazil 2Universidade do Estado do Rio de Janeiro, Rio de Janeiro, Brazil
3Universidade Federal do ABC, Santo Andr´e, Brazil
4University of Science and Technology of China, Hefei, People’s Republic of China 5Universidad de los Andes, Bogot´a, Colombia
6Charles University, Faculty of Mathematics and Physics,
Center for Particle Physics, Prague, Czech Republic
7Czech Technical University in Prague, Prague, Czech Republic 8Center for Particle Physics, Institute of Physics,
Academy of Sciences of the Czech Republic, Prague, Czech Republic
9Universidad San Francisco de Quito, Quito, Ecuador 10LPC, Universit´e Blaise Pascal, CNRS/IN2P3, Clermont, France
11LPSC, Universit´e Joseph Fourier Grenoble 1, CNRS/IN2P3,
Institut National Polytechnique de Grenoble, Grenoble, France
12CPPM, Aix-Marseille Universit´e, CNRS/IN2P3, Marseille, France 13LAL, Universit´e Paris-Sud, CNRS/IN2P3, Orsay, France 14LPNHE, Universit´es Paris VI and VII, CNRS/IN2P3, Paris, France
15CEA, Irfu, SPP, Saclay, France
16IPHC, Universit´e de Strasbourg, CNRS/IN2P3, Strasbourg, France
17IPNL, Universit´e Lyon 1, CNRS/IN2P3, Villeurbanne, France and Universit´e de Lyon, Lyon, France 18III. Physikalisches Institut A, RWTH Aachen University, Aachen, Germany
19Physikalisches Institut, Universit¨at Freiburg, Freiburg, Germany
20II. Physikalisches Institut, Georg-August-Universit¨at G¨ottingen, G¨ottingen, Germany 21Institut f¨ur Physik, Universit¨at Mainz, Mainz, Germany
22Ludwig-Maximilians-Universit¨at M¨unchen, M¨unchen, Germany 23Fachbereich Physik, Bergische Universit¨at Wuppertal, Wuppertal, Germany
24Panjab University, Chandigarh, India 25Delhi University, Delhi, India
26Tata Institute of Fundamental Research, Mumbai, India 27University College Dublin, Dublin, Ireland
28Korea Detector Laboratory, Korea University, Seoul, Korea 29CINVESTAV, Mexico City, Mexico
30Nikhef, Science Park, Amsterdam, the Netherlands 31Radboud University Nijmegen, Nijmegen, the Netherlands
32Joint Institute for Nuclear Research, Dubna, Russia 33Institute for Theoretical and Experimental Physics, Moscow, Russia
34Moscow State University, Moscow, Russia 35Institute for High Energy Physics, Protvino, Russia 36Petersburg Nuclear Physics Institute, St. Petersburg, Russia
37Instituci´o Catalana de Recerca i Estudis Avan¸cats (ICREA) and Institut de F´ısica d’Altes Energies (IFAE), Barcelona, Spain 38Uppsala University, Uppsala, Sweden
39Lancaster University, Lancaster LA1 4YB, United Kingdom 40Imperial College London, London SW7 2AZ, United Kingdom 41The University of Manchester, Manchester M13 9PL, United Kingdom
42University of Arizona, Tucson, Arizona 85721, USA 43University of California Riverside, Riverside, California 92521, USA
44Florida State University, Tallahassee, Florida 32306, USA 45Fermi National Accelerator Laboratory, Batavia, Illinois 60510, USA
46University of Illinois at Chicago, Chicago, Illinois 60607, USA 47Northern Illinois University, DeKalb, Illinois 60115, USA
48Northwestern University, Evanston, Illinois 60208, USA 49Indiana University, Bloomington, Indiana 47405, USA 50Purdue University Calumet, Hammond, Indiana 46323, USA 51University of Notre Dame, Notre Dame, Indiana 46556, USA
53University of Kansas, Lawrence, Kansas 66045, USA 54Kansas State University, Manhattan, Kansas 66506, USA 55Louisiana Tech University, Ruston, Louisiana 71272, USA 56Northeastern University, Boston, Massachusetts 02115, USA
57University of Michigan, Ann Arbor, Michigan 48109, USA 58Michigan State University, East Lansing, Michigan 48824, USA
59University of Mississippi, University, Mississippi 38677, USA 60University of Nebraska, Lincoln, Nebraska 68588, USA 61Rutgers University, Piscataway, New Jersey 08855, USA 62Princeton University, Princeton, New Jersey 08544, USA 63State University of New York, Buffalo, New York 14260, USA
64University of Rochester, Rochester, New York 14627, USA 65State University of New York, Stony Brook, New York 11794, USA
66Brookhaven National Laboratory, Upton, New York 11973, USA 67Langston University, Langston, Oklahoma 73050, USA 68University of Oklahoma, Norman, Oklahoma 73019, USA 69Oklahoma State University, Stillwater, Oklahoma 74078, USA
70Brown University, Providence, Rhode Island 02912, USA 71University of Texas, Arlington, Texas 76019, USA 72Southern Methodist University, Dallas, Texas 75275, USA
73Rice University, Houston, Texas 77005, USA 74University of Virginia, Charlottesville, Virginia 22904, USA
75University of Washington, Seattle, Washington 98195, USA
(Dated: September 5, 2012)
We present a measurement of the ratio of multijet cross sections in p¯p collisions at√s = 1.96 TeV at the Fermilab Tevatron Collider. The measurement is based on a data set corresponding to an integrated luminosity of 0.7 fb−1collected with the D0 detector. The ratio of the inclusive three-jet
to two-jet cross sections, R3/2, has been measured as a function of the jet transverse momenta. The
data are compared to QCD predictions in different approximations. Popular tunes of the pythia event generator do not agree with the data, while sherpa provides a reasonable description of the data. A perturbative QCD prediction in next-to-leading order in the strong coupling constant, corrected for non-perturbative effects, gives a good description of the data.
PACS numbers: 13.87.Cs,12.88.Qk
In hadron-hadron collisions, production rates of colli-mated sprays of hadrons, called jets, with large transverse momenta with respect to the beam axis (pT) are sensi-tive to both the dynamics of the fundamental interaction and to the partonic structure of the initial-state hadrons. The latter is usually parameterized in parton distribution functions (PDFs) of the hadrons. We observed large sen-sitivities to PDFs in our measurement of the differential three-jet cross section as a function of the three-jet in-variant mass [1]. Studies dedicated to the dynamics of the interaction are therefore preferably based on quan-tities which are minimally sensitive to the PDFs. Such quantities can be constructed as ratios of cross sections, for which the sensitivity to the PDFs is reduced. One class of such quantities is the ratio of multijet cross
sec-∗with visitors from aAugustana College, Sioux Falls, SD, USA, bThe University of Liverpool, Liverpool, UK,cUPIITA-IPN, Mex-ico City, MexMex-ico, dDESY, Hamburg, Germany, eSLAC, Menlo Park, CA, USA,fUniversity College London, London, UK,gCentro de Investigacion en Computacion - IPN, Mexico City, Mexico, hECFM, Universidad Autonoma de Sinaloa, Culiac´an, Mexico and iUniversidade Estadual Paulista, S˜ao Paulo, Brazil.
tions. The two-jet [2] , three-jet [3], and four-jet [4] cross sections have been computed in perturbative Quantum Chromodynamics (pQCD) up to next-to-leading order (NLO) in the strong coupling constant αs. The ratio of the inclusive three-jet cross section to the inclusive two-jet cross section, R3/2, provides a test of the correspond-ing NLO pQCD predictions. Previous measurements of R3/2 in processes with initial state hadrons, have been made in ep collisions at the HERA Collider at DESY [5], and in hadron-hadron collisions at the SPS Collider at CERN [6], the Fermilab Tevatron Collider [7], and at the Large Hadron Collider at CERN [8, 9].
This letter presents the first measurement of R3/2in p¯p collisions at a center-of-mass energy of√s = 1.96 TeV. The results are presented as a function of the highest jet pT in the event, pTmax, for four minimum values of the second highest and (for three-jet events) third high-est jet pT, pTmin. The data sample, collected with the D0 detector during 2004–2005 in Run II of the Fermilab Tevatron Collider, corresponds to an integrated luminos-ity of 0.7 fb−1.
Jets are defined by the Run II midpoint cone jet algo-rithm [10] with a cone radius of Rcone= 0.7. Rapidity is related to the polar scattering angle θ with respect to the
beam axis by y = 0.5 ln [(1 + β cos θ)/(1 − β cos θ)], with β = |~p|/E. The inclusive n-jet event sample (for n = 2, 3) is defined by all events in which the n highest pT jets have pT > pTminand |y| < 2.4. The separations in the plane of rapidity and azimuthal angle φ, Rjj =p(∆y)2+ (∆φ)2 between the n highest pT jets are required to be larger than twice the cone radius (Rjj > 2Rcone). The rapid-ity requirement restricts the jet phase space to the re-gion where jets are well-reconstructed in the D0 detector and the energy calibration is known to 1.2–2.5% for jets with 50 < pT < 500 GeV. The separation requirement strongly reduces the phase space for which the n highest pT jets had overlapping cones which were split during the overlap treatment of the jet algorithm.
The ratio of inclusive three-jet to two-jet cross sections,
R3/2(pTmax, pTmin) = dσ3-jet(pTmin)/dpTmax dσ2-jet(pTmin)/dpTmax ,
is less sensitive to experimental and theoretical un-certainties than the individual cross sections due to cancellations of correlated uncertainties. Here R3/2(pTmax, pTmin) is measured for pTmin requirements of 30, 50, 70, and 90 GeV in bins of pTmax, in the in-terval 80 GeV < pTmax < 500 GeV, with the additional requirement of pTmax> pTmin+ 30 GeV. This additional requirement ensures that there is sufficient phase space for the second and third jet so that corrections due to the experimental pT resolution remain small. Given the definitions above for the inclusive n-jet event samples, at each pTmax value the inclusive three-jet event sample is a subset of the inclusive two-jet event sample. Therefore R3/2(pTmax, pTmin) represents the conditional probabil-ity for a two-jet event (at pTmax) to contain a third jet with pT > pTmin.
A detailed description of the D0 detector can be found in Ref. [11]. The event selection, jet reconstruction, jet energy and momentum correction in this measurement follow closely those used in our recent measurements of inclusive jet, two-jet, and three-jet distributions [1, 12– 16]. The primary tool for jet detection is the finely seg-mented uranium-liquid argon calorimeter that has almost complete solid angle coverage 1.7◦ . θ . 178.3◦ [11]. Events are triggered by a single high pT jet above a par-ticular threshold. In each pTmax bin, events are taken from a single trigger which is chosen such that the trig-ger efficiency is above 99% for two-jet and for three-jet events. Using triggers with different prescale val-ues results in integrated luminosities of 1.54 pb−1 for pTmax < 120 GeV, 17 pb−1 for 120 < pTmax < 140 GeV, 73 pb−1 for 140 < pT
max < 175 GeV, 0.5 fb−1 for 175 < pTmax< 220 GeV, and 0.7 fb−1 for pTmax> 220 GeV.
The position of the p¯p interaction, reconstructed us-ing a trackus-ing system consistus-ing of silicon microstrip de-tectors [17] and scintillating fiber tracker located inside a 2 T solenoidal magnet [11], is required to be within 50 cm of the detector center along the beam direction.
The jet four-momenta are corrected for the response of the calorimeter, the net energy flow through the jet cone, energy from event pile-up and multiple p¯p interactions, and for systematic shifts in rapidity due to detector ef-fects [15]. Cosmic ray backgrounds are suppressed by requirements on the missing transverse momentum in an event [15]. Requirements on characteristics of the shower shape are used to suppress the remaining background due to electrons, photons, and detector noise that mimic jets. The efficiency for these requirements is above 97.5%, and the fraction of background events is below 0.1% at all pTmax.
The jet four-momenta reconstructed from calorimeter energy depositions are then corrected, on average, for the response of the calorimeter, the net energy flow through the jet cone, additional energy from previous beam cross-ings, and multiple p¯p interactions in the same event, but not for muons and neutrinos [12, 15]. The absolute en-ergy calibration is determined from Z → e+e− events and the pT imbalance in γ + jet events in the region |y| < 0.4. The extension to larger rapidities is derived from dijet events using a similar data-driven method. In addition, corrections in the range 2–4% are applied that take into account the difference in calorimeter response due to the difference in the fractional contributions of quark and gluon-initiated jets in the dijet and the γ + jet event samples. These corrections are determined us-ing jets simulated with the pythia event generator [18] that have been passed through a geant-based detector simulation [19]. The total corrections of the jet four-momenta vary between 50% and 20% for jet pT between 50 and 400 GeV. An additional correction is applied for systematic shifts in |y| due to detector effects [12, 15]. These corrections adjust the reconstructed jet energy to the energy of the stable particles that enter the calorime-ter except for muons and neutrinos.
The R3/2 distributions are corrected for instrumental effects using a simulation of the D0 detector response based on parameterizations of resolution effects in pT, the polar and azimuthal angles of jets, and jet recon-struction efficiencies. The parameterizations are deter-mined either from data or from a detailed simulation of the D0 detector using geant. The parameterized simulation uses events generated with sherpa˜v1.1.3 [20] (including the tree-level matrix elements for two-jet, three-jet, and four-jet production) using default settings and MSTW2008LO PDFs [21], and a sample of events, generated with pythia˜v6.419 using tune QW [22] and CTEQ6.6 PDFs [23]. The events are subjected to the detector simulation and are reweighted such that their simulated distributions describe the differential two-jet and three-jet cross sections in the pT and rapidity of each of the three highest pT jets in the data. To min-imize migrations between pTmax bins due to resolution effects, we use the simulation to obtain a rescaling func-tion in pTmax that optimizes the correlation between the
reconstructed and true values. The rescaling function is applied to data and simulation. The bin sizes in pTmax are chosen to be much larger than the pT resolution. The bin purity after pTmax rescaling, defined as the fraction of all reconstructed events that are generated in the same bin, is above 50% for the two-jet and above 45% for the three-jet event samples. Bin efficiencies, defined as the fraction of all generated events that are reconstructed in the same bin, are above 55% for the two-jet and above 45% for the three-jet event samples.
We use the simulation to determine correction factors for the differential two-jet and three-jet cross sections in all pTmaxbins, taking the average of sherpa and pythia. These include corrections for all instrumental effects, in-cluding the energies of unreconstructed muons and neu-trinos inside the jets. The total correction factors for the differential cross sections are between 0.92 and 1.0 for the two-jet and in the range 0.98–1.1 for the three-jet event samples. The correction factors for the ratio R3/2are in the range 0.9–1.2. Over most of the range, the correc-tions from the two models agree within 3%. We take half the difference as an estimate of the model dependence of the correction, taking into account the correlations between the uncertainties for the two sets of correction factors. The corrected data are presented at the “particle level”(jets formed from stable particles after fragmenta-tion) as defined in Ref. [24].
The R3/2 measurement results are listed in Table I and Ref. [25], and are displayed in Fig. 1 as a function of pTmax for different pTmin requirements. The ratio R3/2 increases with increasing pTmax up to a maximum value and decreases for higher pTmax values. The position and the height of the maximum depend on the pTmin require-ment (for the pTminchoices in this analysis, the maximum appears at pTmax values in the range 200–300 GeV). For a given value of pTmax, three-jet final states have on av-erage larger invariant masses than two-jet final states. Therefore the three-jet cross section approaches the kine-matic limit at lower pTmaxthan the two-jet cross section, resulting in the decrease of R3/2 at large pTmax. The ini-tial increase of R3/2 with pTmax reflects the increasing phase space for three-jet final states, for a given pTmin requirement. For higher pTmin requirements, the initial increase of R3/2 occurs at higher pTmax values, thereby shifting the position of the maximum.
Theoretical calculations for R3/2 are computed as the product of NLO pQCD results and correction factors for non-perturbative effects. Predictions of NLO pQCD are obtained from nlojet++ [26] using fastnlo [27]. Jets are reconstructed using the FastJet [28] implementation of the D0 Run II midpoint cone jet algorithm. We use the two-loop approximation of the renormalization group equation for five quark flavors with αs(MZ) = 0.1180 which is close to the world average value of 0.1184 [29]. Results are computed using the MSTW2008NLO [30], the CT10 [31], and the NNPDF2.1 [32] PDF sets. For
TABLE I: The ratio R3/2 measured as a function of pT max
for different pT min requirements, along with statistical and
systematic uncertainties.
pT max pT min R3/2 Stat. uncert. Syst. uncert.
(GeV) (GeV) (percent) (percent)
80–100 30 1.816 × 10⁻¹ ±0.7 +5.6 −5.5 100–120 30 2.182 × 10⁻¹ ±0.6 +4.5 −4.4 120–140 30 2.370 × 10⁻¹ ±0.5 +3.7 −3.7 140–165 30 2.442 × 10⁻¹ ±0.6 +3.3 −3.3 165–190 30 2.464 × 10⁻¹ ±1.0 +3.1 −3.2 190–220 30 2.421 × 10⁻¹ ±0.6 +3.1 −3.1 220–250 30 2.362 × 10⁻¹ ±0.9 +3.1 −3.1 250–285 30 2.228 × 10⁻¹ ±1.4 +3.3 −3.2 285–320 30 2.021 × 10⁻¹ ±2.7 +3.5 −3.4 320–360 30 1.925 × 10⁻¹ ±4.6 +3.8 −3.8 360–400 30 1.688 × 10⁻¹ ±9.1 +4.1 −4.2 400–500 30 1.814 × 10⁻¹ ±13.4 +4.6 −4.6 80–100 50 3.116 × 10⁻² ±1.5 +5.5 −5.5 100–120 50 6.796 × 10⁻² ±1.6 +5.1 −5.1 120–140 50 1.059 × 10⁻¹ ±1.4 +4.5 −4.6 140–165 50 1.292 × 10⁻¹ ±1.0 +3.5 −3.5 165–190 50 1.420 × 10⁻¹ ±1.4 +3.1 −3.2 190–220 50 1.477 × 10⁻¹ ±0.8 +2.8 −2.9 220–250 50 1.470 × 10⁻¹ ±1.2 +2.8 −2.8 250–285 50 1.398 × 10⁻¹ ±1.9 +3.0 −2.8 285–320 50 1.290 × 10⁻¹ ±3.6 +3.3 −3.0 320–360 50 1.217 × 10⁻¹ ±6.2 +3.5 −3.4 360–400 50 1.071 × 10⁻¹ ±12.2 +3.8 −3.9 400–500 50 9.105 × 10⁻² ±20.4 +4.5 −4.4 100–120 70 1.161 × 10⁻² ±2.2 +4.1 −4.4 120–140 70 2.699 × 10⁻² ±1.3 +4.1 −4.2 140–165 70 4.849 × 10⁻² ±1.7 +4.3 −4.3 165–190 70 7.254 × 10⁻² ±2.2 +4.0 −4.1 190–220 70 8.880 × 10⁻² ±1.1 +3.3 −3.5 220–250 70 9.401 × 10⁻² ±1.6 +3.2 −3.3 250–285 70 9.125 × 10⁻² ±2.5 +3.2 −3.0 285–320 70 8.969 × 10⁻² ±4.5 +3.5 −3.1 320–360 70 7.852 × 10⁻² ±7.9 +3.6 −3.5 360–400 70 7.555 × 10⁻² ±14.9 +4.0 −4.1 400–500 70 5.959 × 10⁻² ±26.0 +5.0 −4.8 120–140 90 5.775 × 10⁻³ ±2.9 +4.7 −4.7 140–165 90 1.281 × 10⁻² ±2.8 +4.3 −4.4 165–190 90 2.564 × 10⁻² ±3.5 +4.6 −4.6 190–220 90 4.435 × 10⁻² ±1.7 +4.2 −4.2 220–250 90 5.744 × 10⁻² ±2.2 +3.9 −3.9 250–285 90 6.122 × 10⁻² ±3.2 +3.6 −3.4 285–320 90 6.002 × 10⁻² ±5.6 +3.6 −3.4 320–360 90 5.482 × 10⁻² ±9.7 +3.8 −3.8 360–400 90 5.685 × 10⁻² ±17.5 +4.2 −4.3 400–500 90 4.327 × 10⁻² ±31.0 +5.4 −4.7
consistency, we always use those PDFs which have been obtained for αs(MZ) = 0.1180. The renormalization and factorization scales µR and µF are set to µ0 = pTmax. The scale uncertainties are computed by varying µRand µFindependently between µ0/2 and 2µ0with the restric-tion that 0.5 < µR/µF < 2.0. The uncertainties of the pQCD predictions due to the scale dependence are
be-0
0.05
0.1
0.15
0.2
0.25
R
3/2(p
Tmax, p
Tmin)
0.8
1
1.2
Data / Theory
100 200 400 100 200 400 100 200 400 100 200 400p
Tmax(GeV)
DØ
L = 0.7 fb-1 √s = 1.96 TeV αs(MZ) = 0.1180 µR = µF = pTmax MSTW2008 PDFspTmin = 30 GeV pTmin = 50 GeV pTmin = 70 GeV pTmin = 90 GeV
Data NLO plus non-pert. correct.
Data / Theory Theory uncert. PDF uncert.
FIG. 1: The measured R3/2results, compared to the predictions from NLO pQCD corrected for non-perturbative effects (top),
and the ratio of data to theoretical predictions (bottom). The results are presented as a function of the highest jet pT, pT max,
for different pT min requirements. The inner uncertainty bars represent the statistical uncertainties while the total uncertainty
bars represent the quadratic sums of statistical and systematic uncertainties. (N.B. the inner uncertainty bars are within the markers for most data points.)
tween −15% and +5%.
The non-perturbative correction factors are the prod-ucts of hadronization and underlying event corrections. Both are estimated using pythia with tunes DW [22] and AMBT1 [33]. Tune DW uses Q2-ordered parton showers and an older underlying event model, while AMBT1 uses pT-ordered parton showers and a newer underlying event model. For each of these tunes, three event samples have been generated: parton shower level without an underly-ing event, particle level without an underlyunderly-ing event, and particle level with an underlying event. The hadroniza-tion correchadroniza-tions are estimated as the ratio of R3/2 at the particle level and at the parton level (from the partons at the end of the parton shower). Both are obtained without an underlying event. The underlying event cor-rection is the ratio of the particle level results with and without an underlying event. We use the average of the corrections obtained with tunes DW and AMBT1 as the central choice, and quote half the spread as the uncer-tainty. The total non-perturbative correction factors are in the range of 0.96–0.99 with uncertainties of less than 1%.
The theoretical predictions for the MSTW2008NLO PDF sets are overlaid on the data in Fig. 1. The results for CT10 and NNPDFv2.1 PDFs (not shown) agree with those obtained for MSTW2008NLO to better than 0.1% for pTmax < 300 GeV, and are always better than 0.4%. Figure 1 shows good agreement between the theoretical predictions and data. At the lowest pTmin value, the
ra-TABLE II: The χ2values between theory and data for
differ-ent pT minrequirements, for different choices of µR, µF.
pT min Number of χ2for µR= µF =
data points pT max/2 pT max 2pT max
30 GeV 12 46.4 21.7 14.0
50 GeV 12 12.4 8.5 9.1
70 GeV 11 10.9 9.6 13.5
90 GeV 10 13.3 12.7 14.4
tio of data and theory decreases from +8% to −6% with increasing pTmax. For pTmin= 50 and 70 GeV, the ratio of data to the theoretical predictions is consistent with unity over the entire range of pTmax. For pTmin= 90 GeV the theoretical predictions are slightly higher than the experimental results, but still consistent within the the-oretical uncertainty. The agreement between theory and data is quantified by computing χ2values for each choice of pTmin. The χ2 definition takes into account all ex-perimental uncertainties and their correlations as well as uncertainties in the non-perturbative corrections and the PDFs. The χ2 values are listed in Table II for the differ-ent pTmin requirements and for three choices of µR and µF. For pTmin= 30 GeV, the χ2 value depends strongly on the scale, and agreement within the expectation of χ2 = N
data ±√2 · Ndata (where Ndata is the number of data points) is obtained only for the largest scale of µR,F = 2pTmax. For larger requirements of pTmin= 50, 70, and 90 GeV, the theoretical predictions agree with
0.5
1
1.5
2
ratios
100 200 400 100 200 400 100 200 400 100 200 400p
Tmax(GeV)
DØ
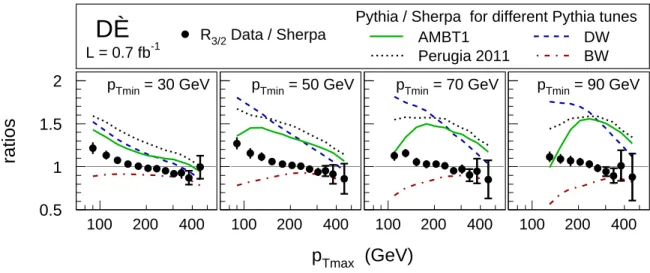
L = 0.7 fb-1 √s = 1.96 TeVpTmin = 30 GeV pTmin = 50 GeV pTmin = 70 GeV pTmin = 90 GeV
Pythia / Sherpa for different Pythia tunes AMBT1
Perugia 2011
DW BW
R3/2 Data / Sherpa
FIG. 2: The measured R3/2 results, normalized to the predictions of the sherpa Monte Carlo event generator. The inner
uncertainty bars represent the statistical uncertainties while the total uncertainty bars represent the quadratic sums of statistical and systematic uncertainties. Overlaid are the predictions from the pythia Monte Carlo event generator for four different tunes, also normalized to the sherpa predictions.
the data for all three scales, and the central scale choice of µR,F = pTmax always provides the lowest χ2.
Predictions from different Monte Carlo event genera-tors are compared to the data in Fig. 2. In this Figure, the measured R3/2 results and the pythia predictions for different tunes are divided by the predictions from sherpawhich includes the tree-level matrix elements for two-, three-, and four-jet production, matched with a parton shower. The sherpa predictions for R3/2have a different pTmax dependence and, independent of pTmin, they are approximately 20% lower (10% higher) than the data at low (high) pTmax.
pythiaincludes only the two-jet matrix elements and a parton shower. The pythia predictions for the three-jet cross section therefore depend directly on the par-ton shower model and the corresponding parameter set-tings (tunes). The pythia results have been obtained for tunes DW, BW [22], A [34], AMBT1, S Global [35], Pe-rugia 2011, PePe-rugia 2011 LO∗∗, and Perugia 2011 Teva-tron [36]. The first three tunes use Q2-ordered parton showers and an older underlying event model, while the latter five use pT-ordered parton showers and a newer underlying event model. Tune DW was tuned to de-scribe the D0 measurement of dijet azimuthal decorre-lations [37], and tunes AMBT1, S Global and Perugia 2011 were tuned to LHC data at√s = 7 TeV. The pre-dictions for tune Perugia 2011 agree within 1% with those for tunes Perugia 2011 LO∗∗ and Perugia 2011 Tevatron (the latter two are not shown in Fig. 2). The predic-tions for tune A (not shown in Fig. 2) are always above those for tune DW, and the predictions for tune S Global (not shown Fig. 2) are 2–5% higher than those for tune AMBT1. Figure 2 shows that none of the studied pythia
tunes describe the data; all predict a different pTmax de-pendence, and the discrepancies are strongly depending on pTmin. While a dedicated study of the sensitivity of the pythia parameters is beyond the scope of this letter, these R3/2 data demonstrate the limitations of current pythia tunes and provide strong constraints for future parameter adjustments.
In summary, we have presented the first measurement of the ratio R3/2 of three-jet to two-jet cross sections in hadron-hadron collisions at a center of mass energy of √s = 1.96 TeV. The ratio R
3/2 is presented for pTmin re-quirements of 30, 50, 70, and 90 GeV, as a function of the highest jet pT, pTmax, in the range of 80–500 GeV. sherpa predicts a slightly different pTmax dependence, but it describes the data within approximately −10% to +20%. None of the pythia tunes DW, BW, A, AMBT1, S Global, and Perugia 2011 describe the data. The data are well described by the pQCD predictions at the next-to-leading order in the strong coupling constant αs, cor-rected for non-perturbative effects.
We thank the staffs at Fermilab and collaborating in-stitutions, and acknowledge support from the DOE and NSF (USA); CEA and CNRS/IN2P3 (France); MON, NRC KI and RFBR (Russia); CNPq, FAPERJ, FAPESP and FUNDUNESP (Brazil); DAE and DST (India); Col-ciencias (Colombia); CONACyT (Mexico); NRF (Ko-rea); FOM (The Netherlands); STFC and the Royal So-ciety (United Kingdom); MSMT and GACR (Czech Re-public); BMBF and DFG (Germany); SFI (Ireland); The Swedish Research Council (Sweden); and CAS and CNSF (China).
[1] V. M. Abazov et al. (D0 Collaboration), Phys. Lett. B 704, 434 (2011).
[2] S. D. Ellis, Z. Kunst and D. E. Spoer, Pys. Rev. Lett. 64, 2121 (1990); Phys. Rev. D 69, 1496 (1992);
W. T. Giele, E. W. N. Glover and D. A. Kosower, Nucl. Phys.B403, 633(1993).
[3] Z. Nagy, Phys. Rev. Lett. 88, 122003 (2002); Z. Nagy, Phys. Rev. D 68, 094002 (2003);
W.B. Kilgore and W.T. Giele, Phys. Rev. D 55, 7183 (1997).
[4] Z. Bern et al., arXiv:1112.3940 [hep-ph].
[5] C. Adloff et al. (H1 Collaboration), Phys. Lett. B 515, 17 (2001);
S. Chekanov et al. (ZEUS Collaboration), Eur. Phys. J. C 44, 183 (2005);
F. D. Aaron et al. (H1 Collaboration), Eur. Phys. J. C 65, 363 (2010)
[6] G. Arnison et al. (UA1 Collaboration), Phys. Lett. B 158, 494 (1985);
J. A. Appel et al. (UA2 Collaboration), Z. Phys. C 30, 341 (1986).
[7] B. Abbott et al. (D0 Collaboration), Phys. Rev. Lett. 86, 1955 (2001).
[8] S. Chatrchyan et al. (CMS Collaboration), Phys. Lett. B 702, 336 (2011).
[9] G. Aad et al. (ATLAS Collaboration), Eur. Phys. J. C 71, 1763 (2011).
[10] G. C. Blazey et al., in: U. Baur, R.K. Ellis, and D. Zeppenfeld (Eds.), Proceedings of the Workshop: QCD and Weak Boson Physics in Run II,Fermilab-Pub-00/297 (2000).
[11] V. M. Abazov et al. (D0 Collaboration), Nucl. Instrum. Methods Phys. Res. A 565, 463 (2006).
[12] V. M. Abazov et al. (D0 Collaboration), Phys. Rev. Lett. 101, 062001 (2008).
[13] V. M. Abazov et al. (D0 Collaboration), Phys. Rev. Lett. 103, 191803 (2009).
[14] V. M. Abazov et al. (D0 Collaboration), Phys. Lett. B 693, 531 (2010).
[15] V. M. Abazov et al. (D0 Collaboration), Phys. Rev. D
85, 052006 (2012).
[16] V. M. Abazov et al. (D0 Collaboration). Submitted to Phys. Rev. Lett. arXiv:1207.4957 [hep-ex].
[17] S. .N. Ahmed et al., Nucl. Instrum. Methods Phys. Res. A 634, 8 (2011).
[18] T. Sj¨ostrand et al., Comput. Phys. Commun. 135, 238 (2001).
[19] R. Brun and F. Carminati, CERN Program Library Long Writeup W5013, 1993 (unpublished).
[20] T. Gleisberg et al., J. High Energy Physics 0902, 007 (2009).
[21] A. D. Martin, W. J. Stirling, R. S. Thorne and G. Watt, Eur. Phys. J. C 63, 189 (2009).
[22] M. G. Albrow et al. (TeV4LHC QCD Working Group), arXiv:hep-ph/0610012.
[23] P. M. Nadolsky et al., Phys. Rev. D 78, 013004 (2008). [24] C. Buttar et al., arXiv:0803.0678[hep-ph], section 9. [25] Supplementary material is available in the
online version of this Letter available at doi:10.1016/j.physletb.YYYY.MM.AA.
[26] Z. Nagy, Phys. Rev. D68, 094002 (2003).
[27] T. Kluge, K. Rabbertz, and M. Wobisch, arXiv:hep-ph/0609285v2.
[28] M. Cacciari and G. Salam, Phys. Lett. B641, 57 (2006). [29] J. Beringer et al. (Particle Data Group), Phys. Rev. D86,
010001 (2012).
[30] A.D. Martin et al., Eur. Phys. J. C 63, 189 (2009). [31] H.-L. Lai et al., Phys. Rev. D82, 074024 (2010). [32] R. D. Ball et al., Nucl. Phys. B838, 136 (2010). [33] G. Brandt in: M. Diehl, J. Haller, T. Schorner-Sadenius
and G. Steinbruck (Eds.), 5th Conference: Physics at the LHC 2010, DESY-PROC-2010-01 (2010).
[34] R. D. Field (CDF Collaboration), in the Proceedings of APS / DPF / DPB Summer Study on the Future of Par-ticle Physics (Snowmass 2001), Snowmass, Colorado, 30 Jun - 21 Jul 2001, p. 501.
[35] H. Schulz and P. Z. Skands, Eur. Phys. J. C 71, 1644 (2011)
[36] P. Skands, Phys. Rev. D 82, 074018 (2010)
[37] V. M. Abazov et al. (D0 Collaboration), Phys. Rev. Lett. 94, 221801 (2005).