Distribution Networks Consolidation and Optimization
for a Large Industrial Conglomerate
by
Phol Sridurongkatum B.Eng. Civil Engineering Thammasat University, 2000 M.Eng. Transportation Engineering Asian Institute of Technology, 2002
Submitted to the Engineering Systems Division in Partial Fulfillment of the Requirements for the Degree of
Master of Engineering in Logistics
MASSA EC NTYTUTEat the
JUL 282010
Massachusetts Institute of Technology
LIBRARIES
June 2010
ARCHVES
© 2010 Phol Sridurongkatum
All rights reserved.
The author hereby grants to MIT permission to reproduce and to distribute publicly paper and electronic copies of this document in whole or in part.
Signature of A uthor... ...
Master of Enginee'ng in Logistics Program, Engineering Systems Division May 7,2010 Certified bA
Dr. Bruce Arntzen Research Associate, Center for Transportation and Logistics Xhesis Supervisor Accepted by... ... .. -- ---.
(
Prof. Yossi SheffiProfessor, Engineering Systems Division Professor, Civil and Environmental Engineering Department Director, Center for Transportation and Logistics Director, Engineering Systems Division
Distribution Networks Consolidation and Optimization
for a Large Industrial Conglomerate
By
Phol Sridurongkatum
Submitted to the Engineering Systems Division On May 07, 2010 in Partial Fulfillment of the
Requirements for the
Degree of Master of Engineering in Logistics
ABSTRACT
Redesigning the distribution networks for the company's various supply chains to lower the cost of delivering products to customers is crucial to company's competitiveness. Redesign includes changing warehouse locations for a specific product to be closer to customers and warehouse consolidation, which requires sharing warehouse space by more than one product type and closing some existing warehouses that are not cost efficient to operate.
The objective of this project is to develop a decision tool to help an industrial conglomerate makes decisions related to the redesign its distribution networks. The data collection was done through collaboration with company's representatives. A Mixed Integer Linear Programming (MILP) model was developed as a tool to solve the optimization problem, which involves moving 9 product types from 21 manufacturing plants, through 22 warehouses, and to 26 destination zones,. The results from the model provides a useful information for the company about which warehouses should be retained, which warehouses should be closed, and what would be the new distribution networks, in order to minimize total distribution costs while still
satisfy the customers' demand.
Thesis Supervisor: Bruce Arntzen
Acknowledgements
First and foremost, I would like to thank my thesis advisor, Dr. Bruce Arntzen, for his valueless advice. His helpfulness and guidance were critical for developing this thesis from the beginning to the end. Moreover, I would like to express my sincere thanks to Mr. Arichai Lalitkulanant, Mr. Wichian Jiamwijitkul, Mr. Nawee Butsuntorn, Mr. Tanoos Pha-obsaeng, and all colleagues
at AllSources for advising and providing me the material for the thesis. This thesis could not
have been completed without the generous help and information given by them. Lastly, I would like to thank my family for their always being supportive during my entire period at MIT.
Table of Contents
A b stract ... . . 2
A cknow ledgem ents ... 3
L ist of T ables ... 6
L ist of F igures ... 7
C hapte 1 Introduction ... 8
1.1 Project Background and Motivation ... 8
1.2 Overview of this document's structure ... 9
Chapter 2 Company Business Structure ... 12
2.1 Overview of Business Structure ... 12
2.1.1 Chemicals Business ... 12
2.1.2 Paper Business ... 13
2.1.3 Cement Business ... 14
2.1.4 Building Material Business ... 14
2.1.5 D istribution Business ... 15
2.2 Company Supply Chain and Distribution Networks ... 16
2.2.1 Profile of the Company Supply Chain ... 16
2.2.2 Cement Distribution Networks ... 17
2.2.3 Building Materials Distribution Networks ... 18
2.2.4 Transportation and Distribution Facilities ... 19
2.3 Managing the Supply Chain ... 21
Chapter 3 Problem Definition ... 23
Chapter 4 Literature Review ... 28
4.1 Importance of Distribution Network Design ... 28
4.2 Distribution Network Design using Mixed Integer Linear Programming A pproach ... 30
Chapter 5 Data Collection...32
5.1 Customer Locations... 32
5.2 Manufacturing Plant and Warehouse Locations ... 33
5.3 Distance Data ... 33
5.4 Product Types...33
5.5 Annual Demand for Each Product by Customer Location...34
5.6 Transportation Costs... 34
5.7 Warehouse Fixed and Variable costs...35
Chapter 6 Model Development...37
6.1 Objective Function...37
6.2 Decision Variables...38
6.3 Constraints ... 39
6.4 Model Formulation ... 39
6.4.1 Indices and Sets... 39
6.4.2 Model Parameters... 40
6.4.3 Decision variables ... 40
6.4.4 Mathematical Formulation... 40
6.5 Scenarios... 41
Chapter 7 Result Analysis... 45
7.1 Optimization Results ... 45
7.2 Comparison between Existing Networks with Model Suggestions ... 49
7.3 Operational Issues ... 60
Chapter 8 Conclusion and Opportunities for Future Research... 64
8.1 Summary of the Thesis ... 64
8.2 Key Learnings... ... ... 35
8.3 Opportunities for Future Research ... 66
List of Tables
Table 3.1 Detail of Manufacturing Plants and Warehouses in the Study Area ... 24
Table 3.2 Current Product Volume and Maximum Capacity of Each of AllSources' Warehouse by Business Unit ... 26
Table 5.1 Product Unit Conversion Factor ... 34
Table 5.2 Warehouses' Fixed and Variable Costs by Business Units ... 36
Table 6.1 Summary of Decision Variables ... 38
Table 7.1 Optimization Results ... 46
Table 7.2 Warehouse Categories by Model Preference ... 49
Table 7.3 Comparison of Warehouse Utilization of Existing and Suggested Networks ... 52
Table 7.4 Comparisons between Existing Networks and the Model Results of Increasing Capacity Scenarios ... 54
Table 7.5 Detail of Warehouses as Suggested by the Model from Four Times C apacity Scenario ... 55
Table 7.6 Number of Product Types Stored at Each Warehouses as Suggested by the Model ... 62
Table 7.7 Number of Destination Warehouses of Product Delivery from Manufacturing Plants ... 63
List of Figures
Figure 1.1 Map of Thailand and its neighboring countries ... 1
Figure 2.1 Locations of AllSources Cement Plants ... 18
Figure 2.2 Locations of AllSources Building Materials Plants ... 19
Figure 2.3 AllSources' Distribution Facilities ... 21
Figure 3.1 AllSources' Existing Distribution Network ... 25
Figure 7.1 Comparisons of Total Distribution Costs of Existing and Suggested Networks ... 50
Figure 7.2 Distribution Networks from Baseline Scenario ... 57
Figure 7.3 Distribution Networks from Two Times Warehouse Capacity Scenario ... 58
Figure 7.4 Distribution Networks from Three Times Warehouse Capacity Scenario ... 59
Chapter 1 Introduction
This chapter explains the background and motivation to conduct this thesis. It illustrates the importance of the problems this study aims to solve. Also, the organization of this thesis document is explained at the end of this chapter.
1.1 Project Background and Motivation
For a company producing products that are common in the market and there are many other manufacturers produce the same kind of products, it has to inevitably compete on price.
Consequently, it is essential for the company to preserve its margin through cost efficiency. So, today, most companies are paying a great deal of attention to improve their supply chain
efficiency in order to reduce product distribution costs without negatively affecting customer service level.
Redesigning the distribution networks for the company's various supply chains to lower the cost of delivering products to customers is crucial to company's competitiveness. Redesign includes changing warehouse locations for a specific product to be closer to customers;
warehouse consolidation which requires sharing warehouse space by more than one product type and closing some existing warehouses that are not cost efficient to operate.
AllSources, an industrial conglomerate in Thailand, is one of the companies facing this
redesigning its warehouse networks in central, eastern, and western parts of Thailand. Due to its large scale organization, with 5 business units (BUs), and multi products manufacturing, the company faces great complexity in the overlapping of its existing distribution networks. Also growing by acquisition of other firms, each of AllSources distribution networks is still managed separately by each of its subsidiary company. This practice leads to the inefficiency of
AllSources' supply chain management in which the problem involves multiple products,
manufacturing plants, warehouses, and distribution centers. Redesigning the distribution
network is a strategic decision that has a long-lasting effect on the company, so AllSources needs to have a reliable tool to help it making decision on this network redesign problem. Figure 1.1
shows the location map of Thailand and its neighboring countries.
The objective of this project is to develop a decision tool to help AllSources make decisions related to the redesign its distribution networks. First, this thesis will examine the company's existing warehouse networks, and then second it will define the scope and number of warehouses that has the potential to be consolidated. Then, a Mixed-Integer Linear
Programming (MILP) model will be developed as an optimization tool. Various scenarios will be run to test the sensitivity of the model. Finally, the optimization result will be analyzed and a new distribution network will be recommended for the company.
1.2 Overview of this document's structure
This first chapter gives information about the background and motivation of conducting this thesis. In the second chapter, the overview of the company's business structure is provided and a summary of company's existing supply chain and distribution networks is also discussed.
The third chapter discusses about the definition and scope of the problem that this thesis needs to solve.
In the fourth chapter, the prior literature related to this study is discussed. Two topics of the literature are reviewed; the importance and necessity of distribution network design and the previous studies of the redesigning of distribution network, using a Mixed Integer Linear Programming (MILP) approach. Chapter five identifies the data needed to be input into the model and explains how to obtain those data.
Chapter six explains the model development. In this chapter, the objective function, decision variables, and all constraints are identified, and all mathematical formulations in the model are presented. Also, all of the scenarios set for running the model are identified and
explained. Chapter seven provides the model results of all scenarios, the comparison between existing distribution networks and the new networks suggested by the model, and some
operational issues that AllSources has to concern when implementing the new networks. Lastly, chapter eight concludes what have been done in this thesis, the key learnings, and opportunities for future research expanding from this thesis.
Figure 1.1 Map of Thailand and its neighboring countries C Chiang Mai
THAILAND
Bangkok
0 ePaAN
Phnom I GULF OF SIAMODIA
SOUTH
CHINA SEA
Thailand
& Neighbor
Digt map byPhukhma Advetising HalyaPtuket www.Ptilta.cSINdGAPORd at aSINGAPORE ANDAMAN SEA Phuket
I
Chapter 2 Company Business Structure
This chapter provides an overview of AllSources' business structure, which is comprised of five business units. In the second part, the company's existing supply chain and distribution networks are discussed.
2.1 Overview of Business Structure
At present, AllSources has 5 core business focused in chemicals, paper, cement, building materials, and distribution. The detail of each business unit is described below.
2.1.1 Chemicals Business
AllSources' chemicals business unit manufactures and supplies a full range of chemical
products ranging from upstream chemicals such as olefins, intermediate chemicals such as styrene monomer, PTA, and MMA, to downstream chemicals such as polyethylene,
polypropylene, polyvinyl chloride, and polystyrene resins. It is now one of the largest integrated chemical companies in Thailand and a key industry leader in the Asia-Pacific region.
Widely accepted for its quality products as well as excellent management and operational prowess, AllSources' chemicals business has entered into joint venture deals with a number of the world's leading chemicals firms.
AllSources' chemicals business has a policy of expanding its investment and business
overseas. In 2006, the export sales volume of polyolefins products amounted to 43,600 million Baht or 36% of the total sales. AllSources exports its polyolefins products to more than 100 countries across the world. Currently, AllSources has 6 Sales Representative Offices in different Asian countries including Vietnam, China, Myanmar, the Philippines and Japan.
2.1.2 Paper Business
AllSources entered the paper business in 1975. At present, AllSources' paper business is
the largest integrated producer of paper products in Thailand, consisting of pulp, printing and writing paper, packaging paper, and corrugated containers. The products have gained wide acceptance in both domestic and international markets for their world quality standards. The paper business remains the industry leader in Thailand and in the Association of Southeast Asian Nation (ASEAN) region.
To cope with the intense competition, the paper business strives to drive innovations, producing a wide range of value-added products and services to satisfy customer needs.
The paper business focuses on constant improvement of operation and management efficiency, which enhances the country's productivity and competitiveness. This enduring commitment has won the AllSources numerous prestigious awards in the past decade.
2.1.3 Cement Business
The cement business is the original business of AllSources since the company was founded in the early 1 9th century. This business produces and supplies cement, ready-mixed
concrete, concrete products, white cement, and refractory as well as providing technical services and consultation on plant installation to customers both within and beyond the group.
The cement business has a policy of extending its cement investment both domestically and regionally. Examples include the construction of a grey cement plant in Cambodia and the establishment of a ready-mixed concrete plant network in the ASEAN region. The business exports its products to many ASEAN countries to create brand and product awareness among customers and to lay solid foundations for future business expansion in the region.
With extensive industry knowledge and advanced production technology, the company is now recognized as a leading manufacturer of a diverse range of products in Thailand and the Southeast Asia region.
2.1.4 Building Material Business
AllSources' building materials business commenced its operation in the 1980's as a
complement to the cement business. Today, the building materials business offers a range of products including roofing materials, ceramic tiles, sanitary ware, faucets, paving blocks, and insulation products. With extensive industry knowledge, advanced production technology and
product design capability, the business is now recognized as a leading manufacturer of a diverse range of products in a wide variety of construction related applications in Thailand and the ASEAN region.
In addition to exports through a global distribution network, particularly to major market in ASEAN, U.S.A., Europe, and Australia, the business currently has 9 business operations in Indonesia, The Philippines, Cambodia, Laos and Vietnam.
2.1.5 Distribution Business
AllSources Distribution Business is involved in domestic and international trading,
logistics, transportation, and warehouse management. This business unit does not manufacture any product; rather it deals with sales and marketing of the products manufactured by other business units. It is also a trader company, buying products from suppliers outside Al/Sources and selling them to other customers.
To strengthen the domestic distribution network for other AllSources' businesses, the distribution business adopts Partner Relationship Management (PRM) with its dealers throughout the country. The business is also adapting to the era of e-commerce, enabling customers to make transactions electronically. In the retail business, the distribution business is developing its retail network through dealer-owned stores.
For international trading, the distribution business continues to pursue trading
opportunities in emerging markets and seeks new sources of quality products and raw materials. Its goals are to strengthen its customer base, boost customer confidence, and consolidate its role as a center for procurement for various local industries.
With proven experience and expertise in logistics, the distribution business focuses on enhancing transportation efficiency to reduce costs and develop its service quality to better satisfy customer demand. Radio Frequency Identification (RFID) together with Global
Positioning System (GPS) has been deployed, allowing for close monitoring of the transportation status. The advanced tracking system enables on-time delivery and reduces costs.
2.2 Company Supply Chain and Distribution Networks
This sub-section describes the company's existing distribution networks of selected business units that related to the scope of this thesis; cement, building materials, and distribution.
2.2.1 Profile of the Company Supply Chain
The supply chain network of AllSources is mainly a local network, that is, products are manufactured and sold to customers within the country because the products are considered commodity or low margin to volume. The company exports some products from any excess production capacity to customers outside Thailand. Export sales make up approximately 30% of
the company's sales revenue. Also AllSources does import some raw materials from outside the country.
While customer locations are scattered throughout the country, manufacturing sites are located near the sources of raw materials. Today, manufacturing sites ship products to their adjacent warehouses for local distribution, and to regional distribution centers for remote distribution.
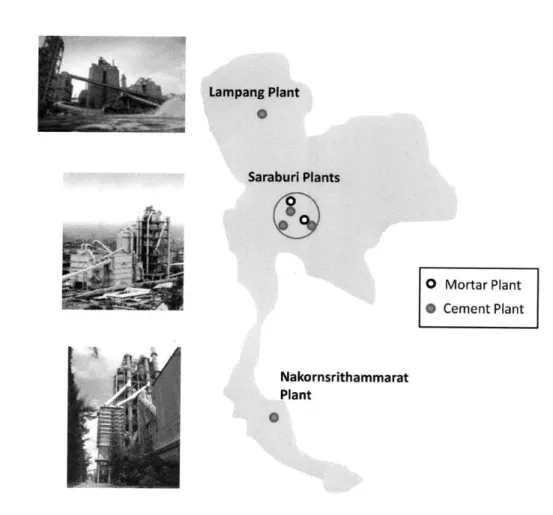
2.2.2 Cement Distribution Networks
Most AllSources cement plants are located in central part of Thailand because limestone,
a key raw material for cement production, is abundant in the area. There are also two small plants in the northern and southern parts of Thailand, which specifically serve customers in those areas. All cement plants have their own warehouses to store the products before delivery to customers. Figure 2.1 shows the locations of AllSources cement plants in Thailand.
Figure 2.1 Locations of AllSources Cement Plants Lampang Plant Saraburi Plants
o
Mortar Plant * Cement Plant Nakornsrithammarat Plant2.2.3 Building Materials Distribution Networks
Like cement products, most building material production plants are located in the central part of Thailand. Due to the variety of the products, there are many manufacturing plants in the area located close to each other, each producing only one type of product family. Products produced at these plants range from roofing tiles to ceramic floor/wall tiles, paving blocks, sanitary wares, and faucets. All building material plants have their own warehouses to store
products before delivery to customers, similar to cement plants. Figure 2.2 shows the locations
of AllSources building material plants in Thailand.
Figure 2.2 Locations of AllSources Building Materials Plants
Lampang Saraburi Khon Kaen 0 Paving Block Nakornsrithammarat Songkla
Fiber-cement Roofing Tile
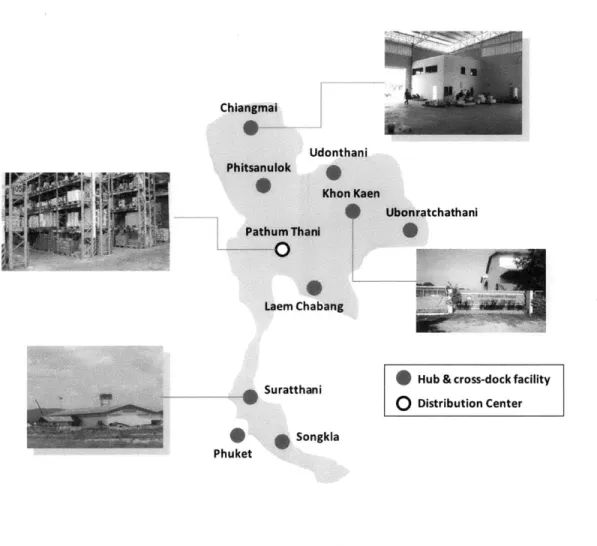
2.2.4 Transportation and Distribution Facilities
AllSources product distribution is managed centrally by AllSources' subsidiary
companies in the distribution business. These companies have major roles in domestic sale,
international trading, and logistics. The distribution network of the company, covering the areas within Thailand, comprises of domestic dealer networks, multi-modal transportation including ground transportation with truck and train, inland waterway transportation with barge, and distribution facilities such as a distribution centers, hubs, cross-docking facilities, and ports.
Due to the variety of its products and customer locations scattered all over the country,
AllSources has many distribution facilities spread out to serve its customers. Apart from the
warehouses that are attached to all manufacturing plants, the company also owns regional distribution centers, called "hubs", in the major provinces. These hubs are located in the northern, northeastern, and southern parts of Thailand, which are far from the central area where most of the manufacturing plants are located. Figure 2.3 shows locations of AllSources'
distribution centers.
For transportation of products, Allsources outsources its trucking activities to other carriers, of which some have developed good relationships with AllSources and become partner companies. The products are distributed in bulk form, e.g. bulk cement or ready mixed concrete with special type of trucks and barges, or shipped in bag or pallet form by truck or train. Most of the delivery is done by truck load (TL) service.
Figure 2.3 AllSources' Distribution Facilities Chiangmal Udonthani Phitsanulok Khon Kaen Ubonratchathani Pathum Thani Laem Chabang Suratthani
Songka
Phuket* Hub & cross-dock facility
o
Distribution Center2.3 Managing the Supply Chain
Advanced IT systems are considered as a core mechanism of the company's supply chain management. AllSources utilizes SAP to manage all of its delivery transactions. These activities include order processing, inventory management, and managing both accounts payable and receivable financial transactions. For transportation activities, Transportation Management System (TMS) is used to manage its transportation activities including shipment processing, load
building, and load tendering to truck carriers. Global Positioning System (GPS) is widely used to track shipments delivered by trucking carriers and a Radio Frequency Identification (RFID) application is in place to automatically transfer delivery information into the company
controlling system.
Multi-modal transportation is initiated to reduce transportation costs while back hauling transportation is emphasized to improve truck utilization and generate additional revenue. Cross docking activities are implemented to sort products before delivery to end customers with no inventory added. Also, the continuous move concept has been introduced to minimize deadhead distance and thus increase truck utilization.
Collaboration among subsidiary companies is promoted to improve efficiency of
AllSources' supply chain management. Business processes have been integrated and information
has been shared throughout the supply chain from production to operation and customers. Accuracy of demand forecasting has been improved by achieving consensus from all related parties in Sale and Operation Planning (S&OP) meetings. Customer Relationship Management (CRM) is also implemented to collect customer information. Finally, AllSources set up a Supply Chain Committee, which consists of representatives from all business units, to facilitate
improvement of supply chain activities across business units and drive change in any supply chain related activities.
Chapter 3 Problem Definition
AllSources is considering consolidating the warehouses of its business units (BUs). Each
of its business units owns and operates its own warehouses separately from the others. The BUs have never considered using the warehouses owned by other BUs to store its products, even when their warehouses are located close to each other, and when there will be no effect on customer service level in terms of on-time delivery. This thesis focuses on three major business units; cement, building materials, and distribution.
AllSources' cement and building material BUs each has its own manufacturing plants and
each plant has an adjacent warehouse attached to it. Currently, products manufactured at each plant are shipped to be stored at its adjacent warehouse before being distributed to end
customers. The distribution BU does not manufacture any product, so it does not own a manufacturing plant. However it owns and operates one distribution center (DC).
AllSources is considering the consolidation of warehouses in central, eastern and western
parts of Thailand. There are 21 manufacturing plants and 22 warehouses or DCs in this area. These warehouses and DCs serve a total of 26 of the 76 provinces in Thailand.
The cement BU has 5 manufacturing plants and 5 warehouses in the area, which produce and store 2 product families: bagged cement and bagged mortar. The building material BU has
14 manufacturing plants and 14 warehouses in the area, which produce and store 6 products families: corrugated roof tile, monier roof tile, ceramic tile, paving block, lightweight block, and
gypsum board. The distribution BU ships steel construction materials from 2 external
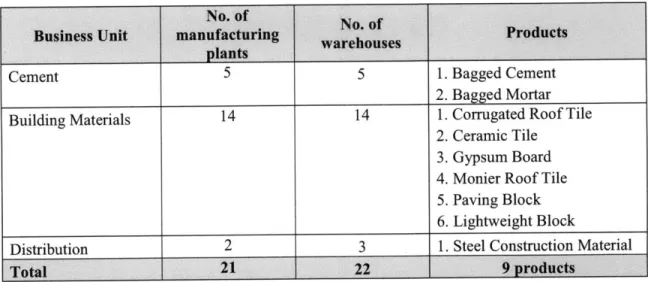
manufacturer warehouses and stores the products at its own distribution center before delivery to end customers. So, it can be assumed that the distribution business is taking care of distribution of steel construction materials from 2 manufacturing plants and operating 3 warehouses; two of them located adjacent to the manufacturers' plants and another one located independently from any manufacturing plant. Table 3.1 shows the detail of manufacturing plants and warehouses in the study.
Table 3.1 Detail of Manufacturing Plants and Warehouses in the Study Area No. of
Business Unit manufacturing warehouses Products
plants
Cement 5 5 1. Bagged Cement
2. Bagged Mortar
Building Materials 14 14 1. Corrugated Roof Tile
2. Ceramic Tile 3. Gypsum Board 4. Monier Roof Tile
5. Paving Block
6. Lightweight Block
Distribution 2 3 1. Steel Construction Material
Total 21 22 9 -products
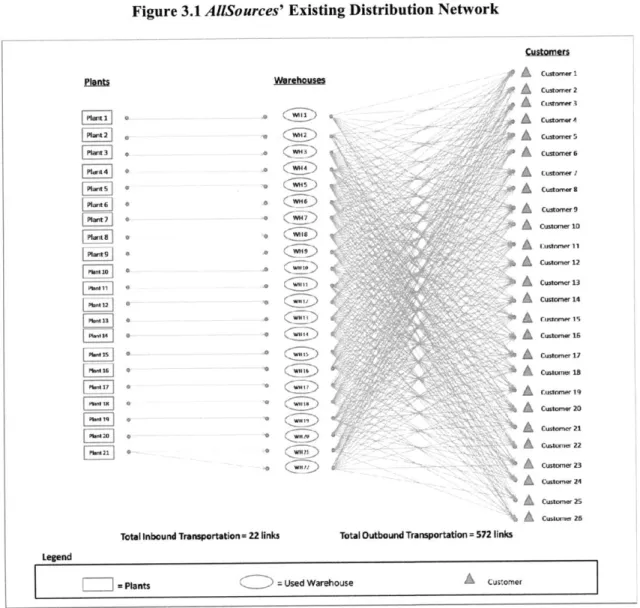
AllSources' outbound distribution networks are single echelon where all products move
from a manufacturing plant through a warehouse and then to end customers. Figure 3.1 shows
Figure 3.1 AllSources' Existing Distribution Network Custorner Plantsteouc 9A A Custornr pmant2 ,__ utmr SA Cuaromr) Fnt .- A c FPI-1] * . =-2 *'4 A cuorner 15 0W . 0 'o A C~~f
~
0.0 w'to)~'~~' AA Cutomnerl9 Fplia 0 0ni~ACw-L~i
(PI
~A
Ct, 12[
nt6 06oK
PCFn *3A
P la .- n A ru .. 19 PI no AL~1iiI
~Th
,~A
c~ca 1i A A Customer 17*
01iA
c.,
A A ss~A
C.I. 20 A Custo 21 ACustomr 220I
.0 A Customner s3 customer Zo A custemer aTotal inbound Transportation= =22 links Total Outbound Truaportation 572 links Legend
=CPlants Used Warehouse A Customer
cuIe II
Given the information about the number of warehouses and their locations above, it can be seen that these warehouses are located close to each other and the distribution network of each product always overlaps with other products'. This inefficiency comes from the current practice where the products can only be stored at the warehouse adjacent to their manufacturing plant, and cannot be stored at other warehouses which may be closer to end customers and that may incur lower distribution costs. To avoid this overlapping network, AllSources needs to redesign
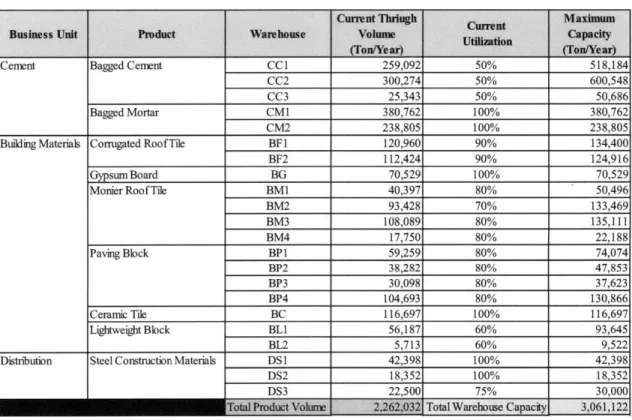
the whole distribution network in the area. This idea is roughly evaluated as possible due to the fact that the current utilization of these warehouses is low so that space is available in these warehouses for moving other products in from other manufacturing plants. Total capacity of all warehouses is approximately 3,000,000 ton per year while the total product volume that passed through these warehouses is currently about 2,200,000 ton per year. So, these 22 warehouses have an excess capacity of 800,000 ton per year. Table 3.2 shows AllSources' warehouse capacity compared to current through product volume.
Table 3.2 Current Product Volume and Maximum
AllSources' Warehouse by Business Unit
Capacity of Each of
Cunutrt ThigiMarkmun
Business Unit Product Warehouse Volume Capacity
____________Cr(on/year) _ ________ (oYer
Cement Bagged Cenent CCl 259,092 50% 518,184
CC2 300,274 50% 600,548
CC3 25,343 50% 50,686
Bagged Mortar CM1 380,762 100% 380,762
CM2 238,805 100% 238,805
Building Materials Corrugated Roof Tile BF1 120,960 90% 134,400
BF2 112,424 90% 124,916
Gypsum Board BG 70,529 100% 70,529
Monier Roof Tile BM1 40,397 80% 50,496
BM2 93,428 70% 133,469
BM3 108,089 80% 135,111
BM4 17,750 80% 22,188
Paving Block BPI 59,259 80% 74,074
BP2 38,282 80% 47,853
BP3 30,098 80% 37,623
BP4 104,693 80% 130,866
Ceramic Tile BC 116,697 100% 116,697
Lightweight Block BLI 56,187 60% 93,645
BL2 5,713 60% 9,522
Distribution Steel Construction Materials DS1 42,398 100% 42,398
DS2 18,352 100% 18,352
DS3 22,500 75% 30,000
Another factor that supports the idea of warehouse consolidation is that all warehouses in the study area can handle all types of the products. In other words, the characteristics of all the warehouses are similar so that there will be no problem handling other products.
All 22 warehouses have different throughput capacity in term of total product volume that passes through it in a year, and different fixed and variable costs to operating them. Therefore, the closest warehouse to the end customers yielding the lowest outbound transportation cost may turn out to be costly because of its higher fixed and variable cost compared to other warehouses. On the other hand, a warehouse which incurs the lowest fixed and variable costs may be far away from AllSources' customers, thus yielding a very high outbound transportation cost.
To deal with these dilemmas, there is a need to have a systematic decision tool which considers all constraints and conflicting factors affecting the network restructuring, along with balancing tradeoffs among them. Mixed-Integer Linear Programming (MILP) is used as a decision-aid tool in this study. The model is designed to find the optimal number of warehouses, their locations, and new patterns of product flow in order to minimize the total distribution cost
Chapter 4 Literature Review
The distribution network design problem has been examined in a great deal of recent research and articles. This section reviews some of the literatures that related to cases similar to what is examined in this thesis.
Two topic areas are discussed. First, the important and necessity of distribution network design of the physical supply chain in today's highly competitive business environment is discussed, requiring an efficient supply chain network. The second part reviews previous studies of the redesigning of distribution network, using a Mixed Integer Linear Programming (MILP) approach, which is the methodology employed in this thesis.
4.1 Importance of Distribution Network Design
Simchi-Levi, et al (2008) clarified that network design is a strategic decision that has a long-lasting effect on the company. It usually involves a variety of decisions relating to plant and warehouse location, and also distribution and sourcing. The ultimate objective of network design is to reconfigure the logistic network in order to minimize systemwide costs. These costs include production and purchasing costs, inventory holding costs, warehouse storage and fixed costs, and lastly transportation costs, exposed to a set of service level requirements. However, there are clear trade-offs regarding the redesign of a distribution network. For example, increasing the number of warehouses for higher customer service levels in terms of a reduction in average travel time to the customer requires an increase in overhead and setup costs and also
inventory holding costs. The company must balance the advantages of being closer to customers and the costs of opening the new warehouse. Thus, warehouse location decision is an essential component of formulating supply chain strategy.
Ballou (2004) also emphasized that locating facilities in the supply chain network is the most significant issue in formulating a strategic plan for most companies. Typically, this is a very complex decision, dealing with multiple facilities, many products, and several customers at the same time. The redesign of warehouse network could yield around 5-10% saving of annual logistics cost for a firm.
Melachrinoudis and Min (2007) pointed out that the warehouse consolidation can improve inventory turns and increase asset utilization. This results from the implementation of more efficient inventory management tools, including cross-docking, radio frequency
identification (RFID), or warehouse management system (WMS), and the elimination of under-utilized facilities. Also, the opportunity to consolidate products into larger volume shipments can potentially reduce transportation costs.
Taskin Gamus, et al (2009), highlighted that the supply chain network design is one of the biggest strategic decision problems for efficient long term operations in the whole supply chain. And because of this importance, network design needs optimization to figure out the numbers, capacity, layout, and type of the factories, warehouses, distribution centers, and also the product flow though these distribution channels in the supply chain.
4.2 Distribution Network Design using Mixed Integer Linear Programming Approach
Manzini, et al (2006) proposed models using a mixed integer linear programming solver to find solutions in complex industrial applications even when several entities, including production plants, distribution centers, customers, are involved. The problem solved in this article is similar to the problem contained in this thesis and I will use the same approach to find the best solution for AllSources by changing variables and constraints to what AllSources is having presently.
Melachrinoudis and Min (2007) developed a mixed-integer programming model to solve the warehouse redesign problem of a firm distributing products to customers in the US and Canada, with a major constraint that the customers should be within 10 hours driving time from the nearest warehouse. They addressed the following issues; (1) which warehouses to retain, which warehouses to establish, and which warehouses to eliminate, (2) which customers to be served by which consolidated warehouses, and (3) how to evaluate the sensitivity of the redesign decisions. The size of the problem examined by Melachrinoudis and Min is 1 manufacturing plant, 21 warehouses, and 281 customers, while the size of the problem in this thesis is 21 manufacturing plants, 22 warehouses, and 26 customer zones.
Tsiakis and Papageorgiou (2008) proposed a mixed integer linear programming (MILP) model to find the optimal solution of a production and distribution network subject to operational and financial constraints. Those operational constraints include quality, and production and supply restriction, which are all related to the allocation of the production and the work-load
balance. Financial constraints included production costs, transportation costs, and duties of the material flowing subject to exchange rates. The purpose of this model is to be used for long term (quarterly, biannually, or yearly) to address strategic and tactical supply chain aspects.
Chapter
5
Data Collection
This chapter explains the data needed to input into the MILP model and how to collect and aggregate all of these data. Most of the data used are secondary data provided by AllSources and some missing data are calculated based on formulated assumptions which were agreed between Allsources and the author.
All the data needed includes:
1. Locations of customers, warehouses, and manufacturing plants,
2. Distance between all manufacturing plants and all warehouses, and between all warehouses and all customer points,
3. Product types,
4. Annual demand for each product by customer location,
5. Transportation cost,
6. Warehouse fixed and variable cost, and 7. Warehouse capacity.
5.1 Customer Locations
In this thesis, the study area is limited only the central, eastern, and western parts of Thailand. There are 26 destination provinces in the study area. The customer points in each province are aggregated and assumed to be located at the city center of each province, so there are also 26 customers or demand points in this study.
5.2 Manufacturing Plant and Warehouse Locations
There are 21 manufacturing plants and 22 warehouses in the study area as mentioned in chapter 4. Each manufacturing plant has its own warehouse attached to it, so it can be assumed that any manufacturing plant and its attached warehouse are located at the same location. Another warehouse is located separately without any manufacturing plant attached to it.
5.3 Distance Data
Distance between all manufacturing plants and all warehouses, and between all
warehouses to all customer points must be collected as a basis for transportation cost calculation. All of the distances are extracted from the distance engine embedded in transportation
management system (TMS) used by AllSources to manage their shipment deliveries.
5.4 Product Types
There are 9 product types studied for this warehouse consolidation problem; bagged cement, bagged mortar, corrugated roof tile, monier roof tile, paving block, lightweight block, ceramic tile, gypsum board, and steel construction materials. The storage requirements for these products align with characteristics of all the warehouses so that each product can be handled at every warehouse in the study area.
5.5 Annual Demand for Each Product by Customer Location
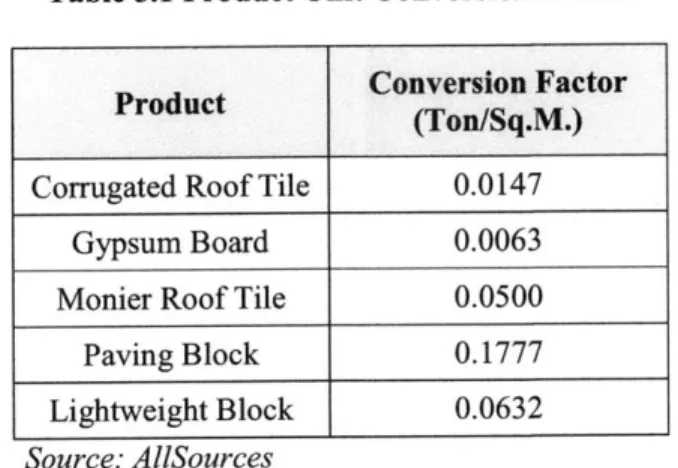
The annual demand data of each product by destination input in the model is the actual demand data of all products in 2009. The demand is converted into the unit of ton per year for all products. The secondary demand data obtained from AllSources for corrugated roof tile, monier roof tile, paving block, lightweight block, and gypsum board are in the units of square meter per year, so it has to be converted into the unit of ton per year using conversion factors of each product. The conversion factors used in this study are shown in Table 5.1
Table 5.1 Product Unit Conversion Factor
Conversion Factor
Product (Ton/Sq.M.)
Corrugated Roof Tile 0.0147
Gypsum Board 0.0063
Monier Roof Tile 0.0500
Paving Block 0.1777
Lightweight Block 0.0632
Source: AllSources
5.6 Transportation Costs
Transportation costs from all manufacturing plants to all warehouses and from all
warehouses to all customer points are the products of distance and transportation rate, which is in the unit of Baht per ton per kilometer and varied by product type. Each product has its own transportation rates. In the current situation, there is no transportation cost from a manufacturing
plant to its adjacent warehouse, since it is assumed that these two facilities are located at the same location, thus the distance between them is equal to zero.
5.7 Warehouse Fixed and Variable costs
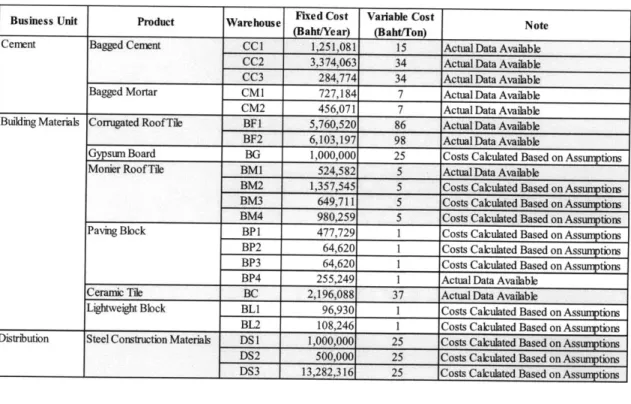
Warehouse fixed cost is in the unit of Baht per year, and warehouse variable cost is in Baht per ton. AllSources provided data on warehouse costs in 2009 for 11 out of its 22 warehouses. From these 11 warehouses, 20% of the warehouse cost is estimated to be
warehouse fixed cost, while the rest 80% is warehouse variable cost. Warehouse variable cost is then divided by product volume that passed through the warehouse in 2009 to obtain variable cost in Baht per ton. For the other 11 warehouses that we have no real data about fixed and variable costs, it is assumed that warehouse variable cost is the same as those warehouses that we have the data, given that they have to handle the same product type. For warehouse fixed cost, it is assumed that warehouse fixed cost depends on the warehouse storage area in square meters. So, I divided the actual fixed cost for the warehouses for which the data was available by its storage area to get the rate of fixed cost per square meter. I then used this rate to calculate fixed warehouse cost of other warehouses. Warehouses' fixed and variable costs that are input into the model are shown in Table 5.2
Table 5.2 Warehouses' Fixed and Variable Costs by Business Units Business Unit Product Warehouse (B eost Viabl ost Note Cenent Bagged Cerment CC1 1,251,081 15 Actual Data Available
CC2 3,374,063 34 Actual Data Available
CC3 284,774 34 Actual Data Available Bagged Mortar CMl 727,184 7 Actual Data Available
CM2 456,071 7 Actual Data Available Building Materials Corrugated Roof Tile BF1 5,760,520 86 Actual Data Available
BF2 6,103,197 98 ActualData Available
Gypsum Board BG 1,000,000 25 Costs Calculated Based on Assumptions Monier Roof Tile BMI 524,582 5 Actual Data Available
BM2 1,357,545 5 Costs Calculated Based on Assunptions
BM3 649,711 5 Costs Calculated Based on Assumptions
BM4 980,259 5 Costs Calculated Based on Assumptions Paving Block BPl 477,729 1 Costs Calculated Based on Assumptions BP2 64,620 1 Costs Calculated Based on Assumptions BP3 64,620 1 Costs Calculated Based on Assumptions BP4 255,249 1 Actual Data Available
Ceramic Tile BC 2,196,088 37 Actual Data Available
Lightweight Block BLI 96,930 1 Costs Calculated Based on Assumptions BL2 108,246 1 Costs Calculated Based on Assumptions Distribution Steel Construction Materials DSl 1,000,000 25 Costs Calculated Based on Assumptions
DS2 500,000 25 Costs Calculated Based on Assumptions DS3 13,282,316 25 Costs Calculated Based on Assumptions
5.8 Warehouse Capacity
Warehouse capacity is the maximum through capacity of the warehouse, or in other words, the maximum volume of product that can pass through the warehouse in a year. Warehouse capacity is in the unit of tons per year and is calculated by dividing total product volume that passed thought the warehouse in 2009 by percent of warehouse utilization.
Chapter 6 Model Development
To find the best possible flow of all products, a Mixed-Integer Linear Programming (MILP) model is used to optimize the network design problem in this study. The MILP model addresses the following issues:
1. Which warehouses are to be retained and which warehouse are to be closed in such a way
that AllSources' redesigned distribution network minimizes total distribution cost to the
company's supply chain, while meets all of the customer demand? 2. Which products are to be handled together at which warehouses?
3. Which destination provinces are to be served by which consolidated warehouses?
What's Best! Modeling software from LINDO Systems Inc. is used as a tool to run the
MILP model. What's Best! 9.0 is an add-on application to Microsoft Excel, which increases computational speed and reliability. It enhances the capability of solving mixed-integer programming of standard Excel solver function, without the requirement to learn a new system interface.
6.1 Objective Function
The objective function of the model is to minimize yearly total distribution cost, including inbound transportation cost to warehouses, outbound transportation cost from
warehouses to customers, total warehouse fixed costs, and total warehouse variable costs for handling the products.
6.2 Decision Variables
Decision variables represent the decision about the flow of the product. The variables will address the following issues:
1. How much of each product should be shipped from each plant to each warehouse? 2. How much of each product should be shipped from each warehouse to each
customer zone?
3. Which warehouses should be retained and which warehouses should be closed?
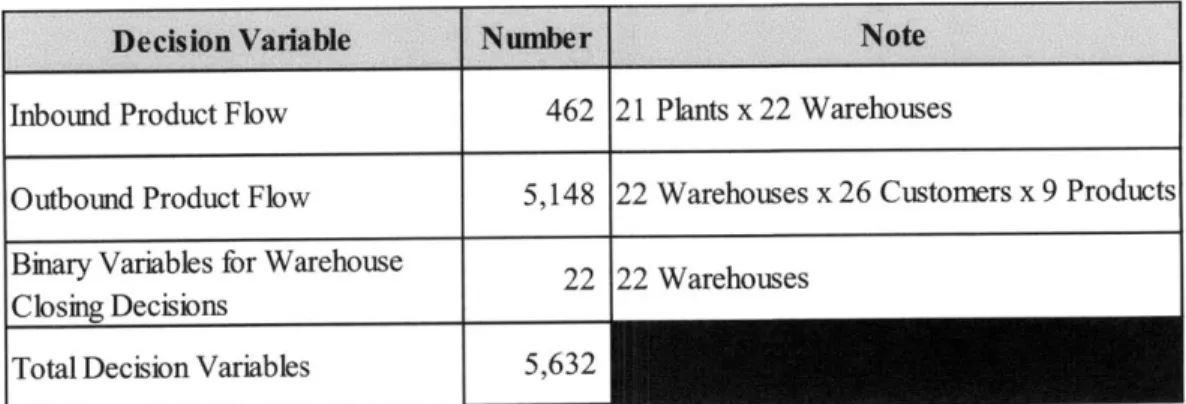
Table 6.1 summarizes the detail and number of decision variables in the model
Table 6.1 Summary of Decision Variables
Decision Variable Number Note
Inbound Product Flow 462 21 Plants x 22 Warehouses
Outbound Product Flow 5,148 22 Warehouses x 26 Customers x 9 Products
Binary Variables for Warehouse 22 Closing Decisions
Total Decision Variables 5,632
6.3 Constraints
To achieve the objective function, which is to minimize total product distribution cost, a set of constraints must be included in the MILP model. In total, four constraints are included in the model, which reflect the following facts:
" Inbound volume of all products to a warehouse must not exceed the warehouse's capacity. * Inbound volume of a product to all warehouses from a plant must be equal to production
volume of the plant.
* Outbound volume of a product from warehouses to a destination province must equal to the demand of the product of that destination province.
" Outbound volume of a product from a warehouse must be equal to inbound volume of that product to that warehouse.
There is an additional constraint on eligibility of some warehouses. Warehouse BG, DS 1, and DS2 can store only the product manufactured from its adjacent manufacturing plant and products manufactured from other plants are not allowed to be stored at these three warehouses.
6.4 Model Formulation
The following mathematical formulations are used to develop the MILP model.
6.4.1 Indices and Sets
p index for manufacturing plants; p E P
k = index for customer zones; k E K
i = index for warehouses; i E A g = index for products; g E G
6.4.2 Model Parameters
ts, = unit transportation cost of product g from plant p to warehouse i (Baht/Ton)
Sgik = unit transportation cost of product g from warehouse i to customer zone k (Baht/Ton)
f
= fixed cost of opening warehouse i (Baht/Year)vi =variable cost of warehouse i (Baht/Ton)
ci= throughput capacity of warehouse i (Ton/Year)
dgk = demand of product g for customer zone k (Ton/Year)
qgp = production capacity of manufacturing plant p for product g (Ton/Year)
6.4.3 Decision variables
Xgpi = volume of product g supplied by plant p to warehouse i Ygik = volume of product g shipped from warehouse i to customer k
i
(1,
if warehouse i is usedz 0, otherwise
6.4.4 Mathematical Formulation
Objective function Minimize
= q, = X keK Ygik = dgk ci 0 0
E (0,1)
Vp
E
P
Vi EA,gEGVk
E
K, g
E
G
Vi
e
A
Vg E G,i E A,p E P Vg E G,i E A,k E K ViEA 6.5 ScenariosThe MILP model was run with both the existing situation and with other eight scenarios to see the sensitivity of warehouse selection due to the variability of warehouse fixed cost and capacity. The six scenarios are
Scenario 1: Baseline
In this scenario, the model is run by setting each warehouse's capacity at 95% of its maximum capacity. This is to allow space at each warehouse to be at the appropriate level for convenient warehouse operation. AllSources agreed to use 95% of maximum warehouse capacity as a baseline of the model.
Subject to iEA Xpi EP EP Xgpi ieA Ygik ZpEP Xpi Xgpi Ygik zi Eq. Eq. Eq. Eq. Eq. Eq. Eq.
Scenario 2: No warehouse fixed cost
This scenario is used to determine the sensitivity of warehouse selection by considering only warehouse variable cost and capacity. Given that the warehouse fixed cost is not
considered by the model, the eligibility of warehouse will be highly depended on variable cost.
Scenario 3: Lower warehouse fixed cost by 5% for warehouses that were not selected in Baseline scenario
This scenario examines whether the warehouses that were not selected by the model in Baseline scenario will be selected if their fixed costs were decreased by 5%. In other words, this is to see how much reduction in the fixed cost will make the warehouse eligible; higher or lower than 5%.
Scenario 4: Raise warehouse fixed cost by 5% for warehouse that were selected in Baseline scenario
This scenario examines whether the warehouses that were selected by the model in Baseline scenario, will be selected again if their fixed costs were increased by 5%. In other words, this is to see how much increase in the fixed cost will make the warehouse ineligible; higher or lower than 5%.
Scenario 5: Two times warehouse capacity Scenario 6: Three times warehouse capacity Scenario 7: Four times warehouse capacity Scenario 8: Five times warehouse capacity
The objective of these four scenarios is to determine the sensitivity of warehouses selection due to the increase of warehouse capacity. These increasing of capacities were based on 95% of maximum capacity. It can be seen from these four scenarios that if all the
warehouses' capacities were increased, which warehouses will be neglected by the model. The warehouses that will still be selected can be implied that they are located at the right locations and should be considered expanding their capacities to be able to store more products, which can help to reduce total distribution cost for AllSources.
In order to use the model to determine the optimal locations and number of warehouses, I conducted an experiment. In the experiment, I increased the capacity of each warehouse to be 2x, 3x, 4x, and 5x their original capacity. This was done to allow the MILP to shift more loads through warehouses in favorable locations and pull loads away from warehouses in less
favorable locations. In order to conduct the experiment, I also changed the variable cost of each warehouse to be the same to avoid the situation where MILP would choose to heavily load on out-of-way warehouses which happened to have a very low variable cost. I also increased the fixed cost of the warehouses but not linearly. For this experiment, I assumed that the fixed cost would rise at the rate ofViT, where n was the multiplier of the capacity.
Intuitively, if the warehouses' capacity were increased, the number of warehouses selected by the model will decrease. This is due to the fact that the warehouses located at the appropriate locations can handle more product volume, thus the products that were stored at other warehouses in Baseline scenario will be stored at these appropriate warehouses instead. So, that will lead to the smaller number of warehouses selected by the model. And if we
continue to increase the warehouses' capacity, the number of warehouses selected by the model will continue to decrease. The number of warehouses selected will decrease until the total distribution cost cannot go down further. We can determine the optimal number of warehouses
for AllSources by continuing to increase warehouses' capacity and seeing that at which point the
model will not suggest using fewer warehouses. The fewest number of warehouses selected by the model can be assumed to be the optimum number of warehouses, if AllSources could expand its warehouses' capacity.
Chapter 7 Result Analysis
This chapter analyzes the results of running the MILP model in the eight scenarios mentioned in the previous chapter. The reasons why some warehouses were used and others were not used in each scenario are explained, and the total distribution cost of Allsources' existing distribution network and the cost of the networks suggested by the model are compared.
7.1 Optimization Results
The results from running the model in six scenarios are shown in Table 7.1. The analysis of the optimization result of each scenario is as following;
Scenario 1: Baseline (95% warehouse capacity)
Three warehouses; BF1, BF2, and DS3 are not selected by the model, so the total number of warehouses used in this scenario is 19 out of 22 warehouses. The reason why the model does not recommend using these 3 warehouses is the high fixed cost of the warehouses compared to other warehouses. For the 19 warehouses that are selected, 16 of them are utilized at their maximum capacity, while the other 3 warehouses, CCl, CC2, and BG, are utilized at approximately 60% of their maximum capacity.
Table 7.1 Optimization Results hv~u~L UiiatioA __________ 1 t ~o1Scenarlo 2 I Existing Distribution Networks 95% WH No Fixed Capacity Cost
CC
I
492,2751
1,251,0811
15
500.1
68%1
66%
34 7 5~0/
1 100. 'i/. 0004, ,1 100 1 1 l0AAL 04 1 1000 A0/. , 7_ %i '^^'Ware ouse~tl zin
Lower Lower WH cost 5% for unused W68 68% Raise WH Cost 5% for used WH 68% 62% 63% 100% 100% 2 Times WI Capacity 54% 0% 100% 3 Times WT Capacity 00/ 0% 100% 4 Times WH Capacity 00/ 0% 0 100/ 5 Times WH Capacity 0% 0% 100% 5% 0% 10/71 0%1 0%0 0% 0%1 0%j 00/a 0% 0% % 0% 0% I 0% 00/ 0% BF2 118,670 6,103,197 98 90%00 ____ BG 67,003 1,000,000 25 1000/ 62% 53% 62% 62% 0% 0% 00/ 0% BMI 47,971 524,582 5 80% 100% 100% 1000/ 100% 1000/a 57% 43% 34% BM2 126,796 1,357,545 5 70% 100% 100% 100% 100% 100% 85% 62% 48% BM3 128,355 649,711 5 80% 100% 100% 100% 100% 1000/a 100% 1000/0 94% BM4 21,079 980,259 5 80% 100% 100% 100% 100% 0% 0% 0% 0%
BPI 70,370 477,729 5 80% 100% 1000/a 100% 100% 69% 48% 23% 00/a
BP2 45,460 64,620 1 800/a 100% 100% 100% 100% 73% 48% 33% 24% BP3 35,742 64,620 1 80% 100% 100% 100% 100% 100% 96% 67% 54% BP4 124,323 255,249 1 80% 100% 100% 100% 100% 1000/a 100% 96% 75% BC 110,862 2,196,088 37 100% 100% 100% 100% 100% 0% 0% 00/a 0% BLI 88,963 96,930 1 60% 100% 100% 100% 100% 95% 48% 28% 11% BL2 9,046 108,246 1 60% 100% 100% 100% 100% 0 DS1 40,278 1,000,000 25 1000/ 100% 100% 100% 100% 00/a 0% 00/a 0% DS2 17,434 500,000 25 100% 100% 100% 100% 100% 53% 0% 00/0 0% DS3 28,500 13,282,316 25 70/ 0% _ 100% 0% 0% 00/a 0% 00/0 0%
No. ofWarehouse Used 122 19 20 19 19 13 12 12
11 95% capacity (Ton/Year) Fixed Cost (Baht/Year) Variable Cost (Baht/Ton) Warehouse CC2 CC3 CMI CM2 BFI 570521 3374.063 152 724 48, 361, 226, 127 284,774 727,184 865 456,071 7 100%0 10% 5,760,520 86 90% 0% 71% 35% 23% 100% 100% 100% 100% ario 2-I ,680 Scenario 1 IScen 62%1 60% 50% 5 2 5 'I/o 100% 100% 100% 100%
Scenario 2: Nofixed cost
Twenty warehouses are selected by the model in this scenario. Only 2 warehouses that are not selected are BF1 and BF2. These 2 warehouses have the highest variable cost among all the warehouses. For warehouse DS3, which has highest fixed cost among all warehouses, when I exclude the fixed cost in optimization this warehouse is selected with 100% utilization. This emphasizes the result from Baseline scenario that DS3 is not selected because of its very high fixed cost.
Scenario 3: Lower warehouse fixed cost by 5%for warehouses that were not selected in Baseline scenario
The optimization result of this scenario is not different from Baseline scenario. So, by lowering fixed cost of those unselected warehouses in Baseline scenario by 5%, it is not enough to lower total distribution cost for the entire network because those fixed costs are still much higher that other warehouses'.
Scenario 4: Raise warehouse fixed cost by 5%for warehouse that were selected in Baseline
scenario
Again, the optimization result of this scenario is not different from Baseline scenario. So, by increasing fixed costs of those already selected warehouses in Baseline scenario by 5%, these warehouses' fixed costs are still much lower than those of unselected warehouses.
Compared to the Baseline scenario, six more warehouses were not selected: CC2, CM1, BG, BM4, BC, and DS 1. So the total number of warehouses used in this scenario is 13 out of 22 warehouses. These warehouses that were now neglected tend to have both higher fixed costs and less appropriate location than those selected warehouse. The products previously stored in these warehouses are moved to the remaining (selected) warehouses instead.
Scenario 6: Three times warehouse capacity and Scenario 7: Four times warehouse capacity
The results of these two scenarios are the same. Compared to scenario 5, two more warehouses, CC 1 and DS2, were dropped by the model, while warehouse CMI was selected by the model again. So In these three scenarios, 12 out of 22 warehouses are used.
Scenario 8: Five times warehouse capacity
. Compared to scenario 6 and 7, one more warehouse, BP1, was dropped by the model. So, in this scenario, 11 out of 22 warehouses are used.
From the optimization results of above scenarios, it can be seen that some warehouses are selected by the model in every scenario, some warehouses are not selected at all, and some warehouses are sensitive to the changing in warehouse capacity. So these warehouses can be ranked by eligibility in to 3 categories as shown in Table 7.2.
Table 7.2 Warehouse Categories by Model Preference
Category Importance Criteria Warehouse
Always Selected First Group Been selected in all scenarios with 100% utilization CC3, BM3, BP4, BL2
Second Group Been selected in all scenarios with 100% BM1, BM2, BP3
utilization except at less than 100% utilization in 3 tines capaciy scenario
Third Group Been selected in all scenarios with 100% CM2, BP1, BP2, BLI
utilization except at less than 100% utilization in 2 tines and 3 tines capaciy scenario
Capacity Sensitive Fourth Group Not been selected in 3 tines capacity scenario CCl, CM1, DS2
Fifth Group Not been selected in 2 tines and 3 times capacity CC2, BG, BM3, BC,
scenario DS1
Never Been Sixth Group Not been selected in all scenarios BF1, BF2, DS3
Selected
The information in the above table is useful for AllSources in order to make any decision about its warehouses. The table shows which warehouses are preferred by the model, which can be implied that they are located at the appropriate locations. So, managers will have a guideline about which warehouses he/she should pay more attention to.
7.2 Comparison between Existing Networks with Model Suggestions
From the previous section, we can see that the MILP model suggests new different distribution networks for AllSources from the existing networks. This section compares the characteristics of the existing networks to the suggested networks.
Total Distribution Costs
The comparison between total distribution cost of existing networks and the suggested networks by cost elements is shown in Figure 7.1