Analyzing the Accountability, Systems and Efficiency of Demand Planning Processes in a Consumer Products Environment
By
Christy A. Prilutski
B.ChE. Chemical Engineering, University of Delaware (1998)
Submitted to the Sloan School of Management and the Department of Civil and Environmental Engineering in Partial Fulfillment of the Requirements for the Degrees of
Master of Business Administration and
Master of Science in Civil and Environmental Engineering In Conjunction with the Leaders for Manufacturing Program at the
Massachusetts Institute of Technology
June 2006
C2006 Massachusetts Institute of Technology. All rights reserved.
Signature of Author Certified by Certified by Certified by Accepted by Accepted by
WT1.
1W vV-Sloan School of Management Department of Civil and Environmental Engineering
Jonathan By e, Thesis Supervisor
Senior Lecturer I E gi eC' g Systems Division
/
ossi Sheffi, Thesis Reader
Professor, MIT Departmen4o ivil au nvironmental Engineering
Donald B. R6senfield, Thesis Supervisor
Senior cturer, Sloan School of Management
I I i
Andrew J. Whittle, Professor of Civil & Environmental Engineering Chairman, Committee for Graduate Students
6e-2: - ~- - - -- - - -
-MASSACHUSETTS INS OF TECHNOLOGY
AUG 31 2006
Debbie Berechman, Exe utive Director of Masters Program / MIT Sloan School of Management
BARKER
I Y V
Analyzing the Accountability, Systems and Efficiency of Demand Planning Processes in a Consumer Products Environment
By
Christy A. Prilutski
Submitted to the Sloan School of Management and Department of Civil Engineering on May 6, 2006 in partial fulfillment of the Requirements
for the Degrees of Master of Business Administration and Master of Science in Civil and Environmental Engineering
As consumer products companies like P&G strive to achieve a consumer driven supply network, the value of forecast accuracy comes into question. Many companies push for faster cycle times and shorter supply chains, driving towards make-to-order production. These trends may appear to reduce the importance of forecasts. However, a closer look into P&G and their business reveals that sales forecasts are still very important and have a far reaching impact stretching from the supply network through to Wall Street. This thesis evaluates the forecasting process in a company like P&G. The thesis delves into the accountability around sales forecasts and proposes a top-down, statistical process for creating and tracking forecast accuracy which was implemented across P&G's global organization. Another analysis is conducted on the evaluation of a new demand planning system which provides more granular input data for generating forecasts, and the implications from this trial on the demand planning process. Finally, an assessment on the efficiency of current systems is also detailed.
Thesis Title: Thesis Title: Supervisor: Supervisor: Thesis Reader: Title: Don Rosenfield
Senior Lecturer, Sloan School of Management
Jonathan Byrnes
Senior Lecturer, MIT Engineering Systems Division
Yossi Sheffi
I would like to thank Rick Ciccone and the P&G Company for sponsoring the internship. My internship was an amazing experience, and Ifeel so lucky to have worked with such exceptional people. Special thanks to Richard Clark, my supervisor, who put together a great set ofprojects, and managed to provide
continuous support even as work took him around the world many times. Many thanks to my personal
P&G coaches: Mark Kremblewski, Jim Yuhas, and Ethan Chamberlain. They provided countless lessons
in not only demand planning, but also P&G business and culture. I'm sincerely grateful for their mentorship throughout my internship experience. I also need to acknowledge P&G's Global Analytics
Group - especially Oscar Rosen -for many hours of analysis, explanation, and statistical instruction.
My experience wouldn't have been complete without the support and camaraderie from my P&G friends. Thanks to Nancy, Jim, Steve, Bob, Lisa, Alex, Ivan, Lina, and Brian.
I would also like to thank the Leaders for Manufacturing Program at MJTfor its support of this work, and for providing the opportunity to pursue it. I would especially like to thank my advisors, Don Rosenfield
and Jonathan Byrnes for their support and encouragement throughout the internship. I always appreciated your input and opinions, especially with this thesis. I would like to offer thanks to my LFM friends and classmates, whose support network stretched throughout the summer, providing invaluable
support and encouragement.
I would like to thank my family -parents, brothers, sisters, nieces and nephews - who have always been such a major part of my life. Without your love and support, I never would have had the courage to go back to school. At every step along the way, you are there doing everything you can to support me. Mom,
you go above and beyond the call of duty again and again, in this case being the reader of my first thesis draft. Thanks so much.
Table of Contents
TA BL E O F CO NTENTS ...-- 7
1 IN TR O D UCTIO N ... 10
1.1 THESIS M OTIVATION... 10
1.2 THESIS O VERVIEW ... 10
2 PROCTER AND GAMBLE: THE WORLD'S GREATEST CONSUMER PRODUCT COMPANY...12
2.1 HISTORY ... 12 2.2 K EY COMPETITIVE A DVANTAGES ... 13 2.2.1 Branding... 13 2.2.2 Innovation ... 14 2.2.3 Go-to-m arket ... 14 2.2.4 Scale... 14 2.3 M OMENTS OF TRUTH ... 14 2.4 ORGANIZATION... 14
2.5 CUSTOMER VERSUS CONSUMER... 16
2.6 SUPPLY CHAIN: SCOPE, COMPLEXITY AND MAGNITUDE ... 16
3 IMPORTANCE OF FORECAST ACCURACY...18
3.1 INVENTORY LEVELS... 18
3.2 CUSTOMER SERVICE ... 18
3.3 PROCUREMENT COSTS ... 19
3.4 BUSINESS PLANNING... 19
3.5 SALES PROJECTIONS TO FINANCIAL ANALYSTS ... 19
4 D EM A N D PLANNING ... 21
4.1 ORGANIZATIONAL STRUCTURE ... 21
4.2 DEMAND PLAN TERMINOLOGY... 21
4.2.1 Horizon, weeks-out...22 4.2.2 Tim e bucket... 22 4.2.3 Aggregation... 22 4.2.4 Product hierarchy... 22 4.2.5 Events ... 23 4.3 PLANNING PROCESSES ... 24
4.3.1 Factors Influencing Dem and ... 24
4.3.2 Statistical Forecast ... 25
4.3.3 Independent N et Forecast... 25
4.4 RELATIONSHIP TO ORGANIZATION ... 26
5 M EA SU RING FO RECA ST A CCURA CY... 27
5.1 FORECAST ERROR INDEX ... 27
5.2 BIAS... 27
5.3 W A PE: W EIGHTED-ABSOLUTE PERCENT ERROR ... 27
5.4 M A PE, M EAN-ABSOLUTE PERCENT ERROR... 29
5.5 PROBABILITY... ... .29
6 ENABLING ACCOUNTABILITY FOR FORECAST ACCURACY...30
6.1 M OTIVATION FOR STATISTICAL ACCOUNTABILITY PROCESS... 30
6.2 SETTING A GLOBAL M ETRIC... ...----... 31
6.2.1 Historical evaluation of P& G perform ance ... 31
6.2.2 Using historical data to predict future perform ance ... 32
6.3 CHOOSING APPROPRIATE FACTORS FOR STATISTICAL PROCESS (SIZE, COMPLEXITY, CAPABILITY)... 33
6.3.2 Popular opinion ...--....-.---... 33
6.3.3 Statistical relationships ... ... 34
6.3.4 Fairness but flexibility ... ... --... 35
6.4 TECHNICAL DECISIONS ...--... 35 6.4.1 Scope ...-.-...-... ---.-... 36 6.4.2 D uration of history... ... 36 6.4.3 Update frequency... ... ... ... 37 6.4.4 Leveling Process... ... ... ... ---... 37 6.4.5 Correlations ... ...-... 37 6.4.6 Standard D eviation ... . ---.... 39 6.5 IMPLEMENTATION... 41 6.5.1 Implementation Strategy ...--- ... ... 41
6.5.2 Issues and Execution... ... 42
6.6 SUMMARY AND RECOMMENDATIONS... 43
6.6.1 Bias - Using the Process to Emphasizing its Effect... 43
6.6.2 Organizational impact... --.. ... ---... 45
7 IMPROVING FORECAST ACCURACY ... 46
7.1 CURRENT SYSTEM: CUSTOMER REPLENISHMENT PROCESS, SAP FIRST ... 46
7.2 PROPOSED SYSTEM: SAP-RESPONSIVE REPLENISHMENT ... 47
7.3 SYSTEM DIFFERENCES ... ... ... 48
7.4 PILOT SCOPE...---.---... - .- --... 49
7.4.1 Motivation and Broad Scope ...- ...- .. ...---.... 50
7.4.2 Expected Impact ...-...--... ---... 50
7.4.3 D etailed Scope...--...---...5 1 7.5 EVALUATION... ---... ----... 51
7.5.1 P&G Safety Stock Model...---... ---... 51
7.5.2 Measuring Forecast Accuracy Improvement... 52
7.5.3 Extrapolating to P& G ... .... .... .... ... 53
7.6 FINDINGS...--... ---... 54
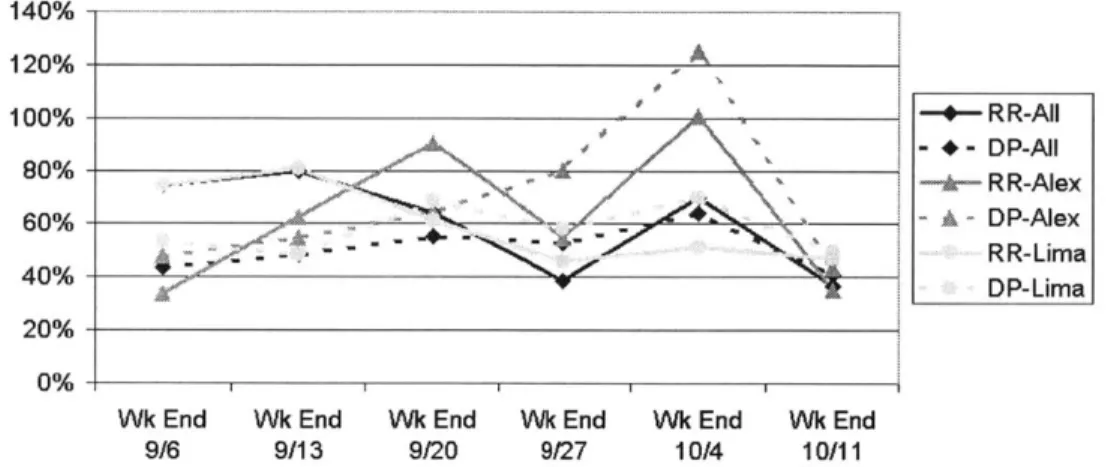
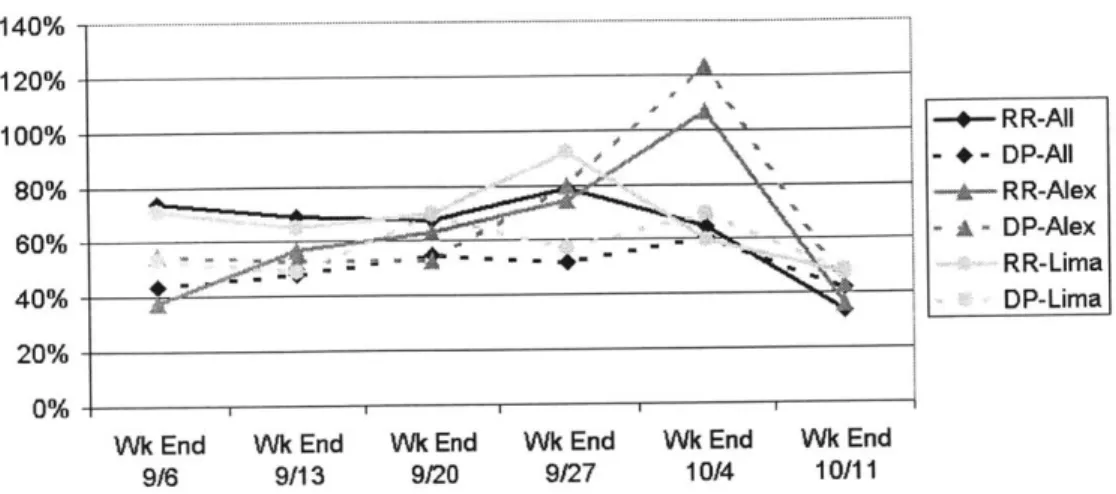
7.6.1 MAPE by SKU -> Results ...----. ... 54
7.6.2 MAPE by SKU, and by manufacturing site -> Results... 57
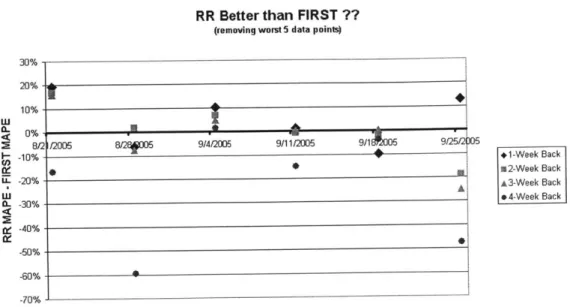
7.6.3 SAP-FIRST Forecast better than anticipated... .... 58
7.6.4 Event M anagem ent ... ... ---... 60
7.6.5 Organizational Changes ... ----... 64
7.6.6 Analyzing Errors in RR...----... 66
7.6.7 Plant Interview ...--- .... .. ... ---... 67
7.6.8 G illette A cquisition ... .. ---... 68
7.7 SUMMARY ... ---... -... ---... 68
7.7.1 Improvements Too Costly ... ... ... 68
7.7.2 Scope Determination Key ... ... ---... 68
7.7.3 Opportunities for Other Improvement... 69
8 EVALUATING THE EFFICIENCY OF CURRENT SYSTEMS...70
8.1 MOTIVATION FOR EFFICIENCY STUDY ... 70
8.2 ANALYTICAL APPROACH ...---..---.-...- . -- - - -- --... 71
8.2.1 Data Available ...---... . - --- ----... 71
8.2.2 First Approach: Category Accuracy... .... ... 72
8.2.3 Second Approach: Accuracy of product forms within a brand... 72
8.2.4 Third Approach: DFU level accuracy within a category ... 72
8.3 ANALYTICAL RESULTS AND INTERPRETATION... ... 73
8.3.1 Category Level : Forecast Index... . . .... 73
8.3.2 Product Level Within Brand: Forecast Index ... 75
8.3.3 Products Level Within Brand: Forecast WAPE... 76
8.3.4 Category: Forecast WAPE ...- ... ... ... ... ---... 78
8.4 SUMMARY AND RECOMMENDATIONS... 85
9 ORGANIZATIONAL AND PROCESS CHALLENGES...86
9.1 STRATEGIC LENS ... 86
9.1.1 P& G Corporate Strategy ... 86
9.1.2 Im pact of P& G Strategy on Projects... 88
9.2 POLITICAL LENS ... 90
9.2.1 P& G Corporate Politics... 90
9.2.2 Im pact of P& G Politics on Projects ... 91
9.3 CULTURAL LENS... 92
9.3.1 P&G Corporate Culture... 92
9.3.2 Impact of P& G Culture on Pro ects ... 95
9.4 EVALUATION OF PROJECT OUTCOMES ... 95
10 LEADERSH IP LESSO NS... 96
10. 1 M ETRIC SETTING ... 96
10.2 CONSISTENCY... 97
10.3 BALANCING STAKEHOLDER NEEDS... 97
11 CONCLUSIONS ... 99
11.1 P&G DEMAND PLANNING PROCESS COMMENTS ... 99
11.2 KEY APPLICATIONS... 99
1
Introduction
The objective of this thesis is to evaluate the processes surrounding forecast accuracy within the consumer products organization of Procter and Gamble, P&G.
1.1
Thesis Motivation
Significant excitement exists around shortening and simplifying supply chains, and creating make-to-order systems. This emphasis of having responsive and flexible supply chains calls into question the need for forecasts. Whether in discussions with students studying supply chain and operations, or even global process owners within P&G's organization, a consistent questioning of the importance of forecasting was evident. The following quote from Sam Ouliaris
exemplifies a common message, "If we could always adjust instantaneously and costlessly to new conditions there would be no need for forecasts."' My research at P&G indicated that even
as the organization makes major strides in moving towards a more responsive supply chain, forecast accuracy is still critically important to the business. This thesis will provide sufficient background to allow readers to obtain a basic understanding of P&G's business and then will present ideas surrounding the importance of forecast accuracy. The thesis will back up these ideas with a review of an initiative to drive forecast accuracy accountability, an evaluation of an investment to improve forecast accuracy, and an analysis of the efficiency of the current demand planning process. The objective of the thesis is to evaluate the importance of forecast accuracy to P&G, and provide enough detail to allow readers to apply the lessons to their own
organizations.
1.2 Thesis Overview
Procter and Gamble has a successful history of building and maintaining brand leadership in the consumer product marketplace. Their success lies not only from excellent management,
innovation and marketing, but from leveraging their size to capture economies of scale. By driving innovation in finding the most efficient business processes, P&G lowers the cost of bringing products into the hands of consumers, allowing them to spend more money on activities
such as marketing and product development. In order to continue along this model of success, integrating supply chains between P&G and the retailers will be necessary to reach the next breakthrough in efficient supply chains. Additionally, P&G looks inside the organization for cost savings and process improvement. This thesis introduces P&G, its organization, and supply chain in Chapter 2. Next, Chapter 3 seeks to assert the importance of forecast accuracy, and the effects poor forecasting has in the organization. The effects include the cost of inventory, lost sales from not having product on the shelf, cost of expedited procurement, cost of lost resources when deploying people and capital assets to projected business growth, and the hit to the stock
1Ouliaris, Sam. "The Art of Forecasting" NUS Business School & Monetary Authority of Singapore,
http://www.ess.org.sg/The%20Art%200f%2OForecasting.ppt# 2 5 6,1,The Art of Forecasting, accessed 3/1/2006.
price from poor forecasting. These issues are rising in importance, and more attention is being drawn towards improving forecast accuracy.
Having set the stage for forecast accuracy being very important to business, the remainder of the thesis evaluates forecast accuracy within the P&G Organization. Chapter 4 introduces the team at P&G responsible for demand planning, the vocabulary and processes employed, and the relationship to the rest of the organization. A relatively large organization at P&G, the demand planning group is well organized and follows standard procedures worldwide to forecast weekly demand at the SKU level for all of P&G products. Chapter 5 describes the technical details of the measures P&G employs to assess forecast accuracy.
Understanding the P&G approach to forecasting and measuring accuracy, the next three chapters outline two internal and one integrated approach to improving forecast accountability, accuracy, and efficiency. Chapter 6 presents a process for deploying metrics top-down using statistics to cascade tolerance limits depending on the size, complexity, and capability of organizations. The development of the process and implementation is discussed. Chapter 7 evaluates the pilot of an integrated system connecting P&G's customer service system with the customer's distribution center. Predicted accuracy savings were not realized. The most promising hypothesis seem to be that the opportunity for applying this system was not as large as originally believed and that organizational challenges hindered implementation and adoption of new systems in a timely and cost-effective manner. The system tested in Chapter 7 did show improvements, but at a huge
financial and organizational cost. This introduced the idea of efficiency, and the cost of improvement, leading into an efficiency study in Chapter 8. Following on a similar study at
Radio Shack2
, the efficiency of the P&G forecast output was compared against simple statistical models to evaluate areas for efficiency improvement.
Lastly, an organizational review is presented to demonstrate the importance of P&G's strategy, politics and culture on corporate efforts. Each of these areas is analyzed and the particular
impact of these areas on the projects is discussed.
2 Harwell, Jack and Michael Gilliland. "Applying Forecast Value Added at Radio Shack." Conference Presentation at the Institute of Business Forecasting Supply Chain Forecasting Conference, Phoenix, AZ, March 1, 2005.
2 Procter and Gamble: The world's greatest consumer
product company
This chapter provides an introduction to Procter and Gamble, setting the background for the thesis. Clearly stated in the 2005 Annual Report, the vision of P&G is:3
"Be, and be recognized as, the best consumer products and services company in the world.
Our Promise: Two billion times a day, P&G brands touch the lives of people around the world. P&G people work to make sure those brands live up to their promise to make everyday life just a little bit better.
Touching lives, improving life. P&G."
While leaving a heart-warming feeling, these words do not speak to the fundamental statistics and strategy which allow for P&G to fulfill the vision expressed.
2.1 History
Formed as a soap and candle business by two brothers-in-law in 1837, P&G had a humble
beginning. Surviving difficult market conditions and the civil war, the company grew to a multi-million dollar corporation by 1890. At the same time, P&G built one of the first product
research labs in America. This investment into research led to the development of new products including soap for clothes and dishes, and Crisco, the first all-vegetable shortening. In 1920,
P&G chose to sell directly to retailers avoiding the uneven production needs from dealing with
wholesalers, changing the way the grocery trade would operate.4
Throughout the 1930s and 40s, Procter and Gamble expanded into beauty products, shampoo, and toilet goods. At the same time, P&G developed a system for brand management and began advertising on both radio, and eventually TV. In fact, the sponsorship of radio programs by P&G's soap powder led to the term, "soap opera" to be used for these popular radio programs. Even in these early days, P&G advertising and sponsorship was invading US households. P&G also started early with international expansion, and in 1935 P&G acquired Philippine
Manufacturing Company, the first operations in the Far East.3
In 1946, the introduction of Tide laundry detergent proved so successful that it funded new growth into other product lines and other markets. Between 1946 and 1980, P&G would expand into new products including Crest toothpaste, toilet tissue and paper towel, Pampers disposable diapers, Pringles potato chips, Folger's coffee and Downy fabric softener. P&G also expanded
3 P&G Annual Report 2005.
4 "A Company History" P&G, 2005
geographically starting on-the-ground operations in Mexico, Europe and Japan. By 1980 P&G was doing business in 23 countries around the world with sales of over $10 billion.
Throughout the last two and a half decades, P&G has continued to expand into new product markets including health care and cosmetics, as well as geographic markets as it now sells its products in over 160 countries worldwide.
2.2 Key Competitive Advantages
P&G publicizes that its core strengths lie in four main areas: branding, innovation, go-to-market, and scale. 6 These core strengths lead to a competitive advantage in the market place.
2.2.1 Branding
Known for marketing expertise, especially their frequently copied methodology of "brand management," P&G has over three hundred brands. P&G prides itself on building large brands which are hugely popular globally. P&G introduced the concept of "billion dollar brands" referring to brands which independently generates over $1 billion dollars in sales each year. P&G has 17 brands in this category in 2005, and with the acquisition of Gillette, will add another 5 brands anticipating 22 brands in 2006. Some of these brands are quite huge. Pampers alone generates over $6 billion in sales each year. Another favorite, Tide, generates $3 billion.
Figure 2.1 Billion-Dollar Brands6
Having twenty-two brands each selling over a billion dollars in sales each year may seem impressive. But the pipeline is also exceptional, and P&G has another thirteen brands with sales of over $500 million in the pipeline. Each of these is capable of crossing the billion-dollar mark in the next several years.
5 "A Company History" P&G, 2005
6 P&G Annual Report 2005.
2.2.2 Innovation
P&G's size, resources and history allows P&G to have massive repositories of consumer and market knowledge spanning the globe and decades of transactions. P&G leverages this
knowledge, along with science and engineering expertise to continually innovate both products and processes. P&G has collected consumer data from more than 100 million consumers across
30 countries and 20 categories of business. Additionally, P&G invests nearly $2 billion a year in
research and development, more than most of their direct competitors combined. This knowledge and commitment to investment drives P&G innovation and brand building and strengthens the value provided to both retail partners and consumers.7
2.2.3 Go-to-market
P&G can leverage its knowledge, size and expertise to developing strong relationships to bring
products to consumers through the retail channel. P&G provides retailers with consumer and shopper research, supply chain solutions, branding and marketing expertise, and more. In a recent industry survey of U.S. retailers, P&G was ranked #1 in six of eight categories: clearest
strategy, most innovative, most helpful consumer and shopper information, best supply chain management, best category management, and best consumer marketing. 7
2.2.4 Scale
With $56 billion dollars in annual sales, not including a recent acquisition of Gillette which adds another $10 billion in annual sales, P&G is one of the world's largest consumer products
organizations. With over 100,000 employees operating in over 80 countries, the large organization can function with significant economies of scale P&G both creates and capture value from its massive size in areas such as purchasing, distribution, and business services at the
company level.7
2.3 Moments of Truth
P&G's CEO, AG Lafley, has created a vision of two moments of truth in which P&G needs to win to be successful. This vision has energized the organization and focused people on two core ideas. The first moment of truth occurs in the store, when the marketing, pricing, and availability of a product entice a consumer to purchase it. The second moment of truth occurs when the consumer uses the product, and is pleased with the quality enough to become a repeat user.
2.4 Organization
P&G also implemented an organizational change to setup a structure around these two moments
of truth, which would provide the ability to integrate new businesses while continuing to build
Christy Prilutski Thesis, LFM 2006
7 P&G Annual Report 2005.
existing businesses. P&G is divided into three major areas: Global Business Units (GBU), Market Development Organizations (MDO), and Global Business Services (GBS). The main idea is to capture the benefits of focused smaller companies through dedicated GBUs while capturing the go-to-market strengths and capabilities of a $50 billion company through local market development organizations. Lastly, shared business services organization and lean corporate functions groups ensure P&G's functional disciplines will continue to lead the industry. 8
Global Business Units manage the profit and loss for brands globally. They develop and implement long-term strategies for P&G brands. Operating globally, they can leverage deep consumer understanding to determine common consumer needs and quickly expand brands and product innovations to different markets around the world. GBUs are measured on shareholder return and their development of strong market leadership positions in their individual industries. The GBUs include functions such as global marketing, product development, and product supply.
P&G divides its businesses into three main GBUs: Beauty Care, Household, and Health, Baby
and Family Care. The GBU is focused on winning the "second moment of truth" - when the consumer uses the product and evaluates how well the product meets their expectations - by
focusing on delivering superior products, packaging and marketing.
Market Development Organizations are responsible for understanding local needs and leveraging their scale in distributing to customers in local regions. MDOs are responsible for the entire portfolio of brands in a particular geography, and this breadth provides flexibility to serve the needs for local retailers. These regional MDOs can focus on the customers, retailers, supply chains and governments associated with local markets. Essentially functioning like a sales and customer service organization, they are aligned behind top-line growth, market share, cash, cost, and value-creation objectives. The key advantage of this structure is that MDOs can focus 100% of their resources on local consumers and customers without duplicating product innovation, product sourcing, brand advertising or other activities that are led by the Global Business Units. This eliminates inefficient overlaps and frees up resources to collaborate better with customers and focus exclusively on winning in local markets. Thus, the MDO is focused on winning the "first moment of truth" - when a consumer stands in front of the shelf and chooses a product
from among many competitive offerings.
Each of the Global Business Units is headed by a vice-chairman reporting to the chief executive officer of the company. All of the MDOs also report to the Vice-Chairman of Operations. Thus
employees within the GBU or MDO do not officially connect in the organization until reaching the CEO level.
Global Business Services, the third major organization, operates as the "back office" for the
GBU and MDO organizations, providing world-class technology, processes and standard data
tools to understand the business and serve consumers and customers better. This organization includes functions such as accounting, IT and human resources.
Two other smaller corporate organizations also exist at P&G: Global MDO and Corporate Functions. Corporate functions operate across the GBUs for functions typically conducted
Christy Prilutski Thesis, LFM 2006
8 P&G 2004 Annual Report.
within the GBU. These functional organizations include marketing, finance, and product supply. They support the GBUs ensuring functional discipline and installing industry best practices. Likewise, the Global MDO supports functions which occur across the different regional MDOs, such as sales, physical distribution, and demand planning.
2.5 Customer versus Consumer
There is an important distinction between the term customer and consumer. P&G uses 'customer' to refer to the retailers, primarily mass merchandisers, grocery stores, membership club stores and drug stores that purchase products from P&G. The term 'consumer' refers to the person who purchases the product and uses it in the household. So while P&G works to improve relationships with their customers to reduce costs and improve service, the purpose statement of
P&G stresses the importance of the consumer:
"We will provide branded products and services of superior quality and value that improve the lives of the world's consumers."
In order to provide superior quality and value to today's demanding, diverse and changing marketplace, each brand maintains a significant amount of variety and is constantly refreshing the product portfolio and to add new products. This adds complexity to the relationships with customers, a critical part of the supply chain.
2.6 Supply Chain: Scope, complexity and magnitude
The supply chain refers to the network of suppliers, manufacturing plants, distributors, and retailers that participate in the sale, delivery and production of a particular product. The emphasis on the first moment of truth indicates the importance of P&G's supply chain in ensuring the product is on the shelf at the retailer and able to be sold.
P&G has a large supply organization, operating over 100 manufacturing plants, prior to the
Gillette acquisition, and engaging in numerous contract manufacturing relationships.9 P&G also
has its own distribution network, in addition to that of its customers. Selling over 50,000 products to mass merchandisers, grocery stores, and drug stores worldwide, P&G products can be purchased from a huge number of retailers worldwide. This supply chain is depicted below.
9 P&G leaders, including Richard Clark, Mark Kremblewski and Jim Yuhas, provided much of the background
about the company and its supply chain.
Suppliers P&G -Mfg P&G - DC Customer DC StorefShelf Consumption Figure 2.2 P&G Supply Chain'0
This picture shows the many components in the channel between manufacturing the product and finally getting the product into hands of the consumer. The breadth and size of P&G further complicate the system. Strong differences occur between businesses and regions. For example, the relative importance of customers varies significantly by region. Over 30% of the sales volume passes through Wal-Mart in North America. However, in Western Europe there are more relatively equivalent retailers responsible for selling to consumers. One example can be used to highlight both the importance of Wal-Mart, and supply chain policies such as inventory management. Inventory reductions at Wal-Mart are cited by the Dow Jones Newswires as triggering the forecast update at P&G, which caused the stock price to fall 2.3%.1"
The size and scope of P&G's product variety also complicates the supply chain. First, from a size perspective, P&G operates sixty Sales and Operations Planning (S&OP) processes around the globe each month. S&OP refers to process where various departments within P&G come together to convert the business plan into an operating plan, balancing and determining the appropriate demand and supply plans. There is also significant variety with the supply processes for different P&G businesses. For example, some businesses are quite responsive and have the flexibility to change the schedule of what they plan to make a few hours before it is actually produced. These same businesses execute the planning and scheduling processes multiple times a day. On the other hand, some businesses plan production weeks in advance, and fix the schedule a month out, leaving little flexibility for last minute changes. In this wide variety of business environments, the importance of forecast accuracy begins to unfold.
1 Cheung, Christine. "A Short-range Forecasting and Inventory Strategy for New Product Launches." MIT Thesis.
2005.
" Lloyd, Mary Ellen. "Procter & Gamble Down After Tempering E Europe, Asia Outlook" Dow Jones Newswire. March 14, 2006.
3 Importance of Forecast Accuracy
This chapter will analyze the importance of forecast accuracy and the direct impacts it has on the organization. The forecast enables the first moment of truth - having the product available on the shelf.
3.1
Inventory Levels
Many supply chain and operations textbooks and journal articles discuss the direct relationship between forecast error and inventory levels. With perfect accuracy, and instantaneous capacity, no inventory would be required in the system as companies could plan to make the right quantity
of equipment exactly at the right time. However, it is not feasible that companies would have infinite instantaneous capacity. Thus, even if the forecast accuracy is perfect, inventory will be required to ensure that demand can be met. This is referred to as process tock, pipeline stock, or WIP. Once forecast error is introduced, safety stock inventory rises to manage the variability in demand. The ownership of inventory ties corporate dollars which could have been invested otherwise. Thus, over-predicting sales can lead to excess costly inventory levels. It can also lead to costs of inventorying the material, warehouse, handling and management costs.
Additionally, as this unpredictability of demand amplifies finished product inventory, it can pass through to raw material inventory safety stock, requiring higher levels in this category as well. Finally, excess inventory created from poor forecasting may not be able to be sold at all, with the rapid product life cycle occurring for many consumer goods. P&G refers to this inventory as remnants, excess inventory without any plans to sell.
3.2 Customer Service
The relationship between forecast accuracy, inventory, and instantaneous capacity demonstrates how having additional inventory or capacity protects against forecast error. However, if the inventory is carried in the wrong product, a consumer may find the shelf empty of his or her favorite variety. This refers to another factor impacted by forecast accuracy, customer service. Customer service refers to the availability of goods for sale on the shelf. Under-predicting sales can lead to supply shortages resulting in empty shelves in the store. This would result in a failure at the first moment of truth as a customer can not find the particular product that they desire. Thus, this can result in lost sales to the customer. This is not always a major issue. Sometimes a customer will wait until the material is in stock, purchase a similar SKU still from
P&G, or travel to a different store that does have the SKU in stock. However, there is a risk of
devastating long term effects on profitability if the customer were to purchase a competitors product and cease being a repeat user of P&G's product, and switch to the competitor's product. This lost revenue can extend for long periods of time and be exceptionally costly to the business. Therefore P&G strives to have a high level of customer service, keeping product on the shelf Other mechanisms can be used to minimize out-of-stock occurrences on the shelf, for example, rush shipping of product. But this premium freight is also expensive and reduces the overall profits of the enterprise.
3.3 Procurement Costs
The impact of poor forecasting on inventory levels stretches beyond finished product to raw materials. It can also be felt in many other procurement areas, including the expedition costs of rushing material, in the demurrage cost of not being able to offload excess material, in
negotiating future vendor relationships and in lining up adequate supply in the future. For example, one plant listed detention and demurrage costs in excess of $10,000 per week. Under-forecasting raw material requirements can lead to a shortage of material, forcing a shipment to a customer to go with fewer cases than requested. This would not be reflected in forecast error, as the forecast is compared with actual shipments, and not customer demand. Additionally, raw material shortages can lead to unplanned downtime as equipment is wasted without being able to make product. To provide an example of the magnitude of potential savings in this area, one of the P&G manufacturing plants spends in excess of one billion dollars per year on raw material cost. If the forecast accuracy could be improved, and thus the variability reduced, a significant percentage of raw materials, and thus cash, could be freed up for better ventures.
3.4 Business Planning
Not only does forecast error have a direct impact on the daily inventory and costs, and product sales, it also impacts longer term decision making. Forecast accuracy is important to driving big business decisions and can impact pricing decisions, timing of new product introductions, and investment decisions for the allocation of resources between R&D, sales, and marketing. For example, some businesses carry extra capital assets to be able to deliver instantaneous capacity, where these investments could be avoided if better forecasting were available. Even when business budgets are allocated to new product development and the introduction of a new product, P&G customer service managers give examples of how development production has been required to shift to actual production for immediate sale, delaying initiative timing of new products. Capital investment, R&D investment, and marketing budgets decisions hinge on
appropriate forecasts.
3.5 Sales Projections to Financial Analysts
Lastly, the course of work at P&G highlighted the importance of accurate forecasts in areas beyond sales and demand. Forecast accuracy is important for building credibility on Wall Street
and protecting the company's stock price. Many journal articles discuss the relationship between earnings forecasts and stock performance. Copeland writes:
"Changes in noise, measured by changes in the standard deviation of analyst forecasts of earnings, have a significant negative correlation with total return to shareholders. If the
company can decrease "noise"--that is, the dispersion of expectations across analysts and investor forecasts - then its share price should increase."12
This essentially asserts that forecast error reduces the stock price, and improving accuracy should improve the stock price. One article expresses how superior forecasting has a great impact on
stock prices.13 Another interesting article studied how since investors reward firms that meet or exceed earnings expectations, executives of firms with sizable option components in their compensation plans have increased incentives to report earnings that meet or exceed analysts' forecasts.1 4 It further went on to investigate the correlation between options granting and a
history of exceeded expectations. This last article touches upon the management motivation for introducing forecast bias to ensure that forecasts are always met. This bias can be difficult to impossible to remove from the system under the current policies. However, in light of the fact that error has a strong effect on stock price, it is evident that improvements in forecast accuracy are better for the shareholders.
12 Copeland, Tom, Aaron Dolgoff, and Alberto Moel. "The Role of Expectations in Explaining the Cross-Section of Stock Returns" Review of Accounting Studies. 9, 149-188, 2004
13 Park, Chul W. and Earl K. Stice. "Analyst Forecasting Ability and the Stock Price Reaction to Forecast
Revisions" Review of Accounting Studies. 5, 259-272 (2000)
" Bauman, Mark P and Kenneth W. Shaw. "Stock option compensation and the likelihood of meeting analysts' quarterly earnings targets." Review of Quantitative Finance and Accounting. (2006) 26: 301-319
4 Demand Planning
Forecast accuracy hinges on the demand planning organization, whose objective is to generate volume forecasts which are timely, unbiased, and reasonable. The organization operates at an intersection of two of the major organizations within P&G.
4.1 Organizational Structure
As described earlier, the majority of P&G employees work in one of the three major
organizations: GBUs, MDOs, or GBS. Global Business Services (GBS), which includes groups such as information technology, are not relevant to most of this thesis. The demand planners operate at an interesting bridge in the organization between the other two major groups. The three Global Business Units have responsibility for product supply - which includes every phase from product development, procurement, manufacturing plants and their processes. Therefore the GBU essentially owns creating and maintaining the inventory for the corporation. The Market Development Organizations are regional groups which operate across the business units and align with customers, thus coordinating sales, promotions, shipments, and customer service across the different business units. The demand planners fall within the MDO organizations and are responsible for collecting the input from the respective parties and generating the sales forecast which is then used by the business to determine how much product to make and when to make it.
As this is a fairly involved role for a large consumer products company like P&G, demand planning is quite a sizeable organization. There are over five hundred demand planners throughout the P&G organization. This is believed to be one of the largest demand planning
organizations. While demand planners reside within the MDO and report through that
organization, they are aligned with GBUs. For example, although the MDO is not divided by brands, the demand planners within the MDOs are. With the large breadth of P&G businesses
and the number of general managers representing various countries, brands and profit centers, these planners are required handle a large volume and breadth of situations.
Turnover is another interesting consideration. There are approximately 200 new planners turning over in the role each year. Many people leave this role for other positions within P&G, thus training is a high priority of the organization, and consistent processes are necessary for bringing new people up to speed quickly. To retain knowledge, enable standard process
maintenance and improvement, a Global Demand Planning organization exists. This
organization has regional leads which support the planners within their regions, as well as global experts focusing on improving the processes. This work was conducted from the global demand planning organization, though funded by the product supply corporate function group.
4.2 Demand Plan Terminology
When discussing forecast accuracy, certain terms will be used repeatedly. Below, the common terms used by P&G will be presented and used subsequently in this thesis.
4.2.1 Horizon, weeks-out
The horizon refers to the time period between when the forecast is generated, and when the shipments are expected to occur. Horizon is synonymous with weeks-out. A one-week-out horizon indicates that the forecast was generated one-week before the shipment was expected to
occur. The horizon is often expressed as month-n, where n is the horizon. When creating a forecast for the month of September in July, the P&G convention is to call this horizon month-1, indicating that the forecast was generated a full month ahead. A forecast for sales in September generated in August, would be referred to as having a horizon of month-0. This can be a source of confusion, as different groups within P&G use different rules for the zero period.
4.2.2 Time bucket
The phrase, "time bucket" is used to refer to the period of time for which the forecast and shipments are aggregated. For example, within P&G the most common time buckets are weeks and months. A weekly time bucket indicates that the forecast is generated for a seven-day period, thus alleviating any concern on which day within a week the shipment will occur. This weekly forecast will be compared with the shipment total for that week. Monthly time buckets are often used for evaluating business forecast accuracy. Essentially the forecast generated for a month will be compared with the month's shipments.
4.2.3 Aggregation
Aggregation refers to combining together different units to represent a broader perspective. For example, demand for different fragrances of deodorant may be aggregated together to represent an aggregated demand for deodorant. Aggregation may occur across products, across businesses,
even across time. Many logistics and supply chain experts indicate that aggregate forecasts are more accurate than individual forecasts. Yossi Sheffi gives the example of how Cadillac
aggregated demand across its Florida dealers, instead of forecasting each dealer individually. This resulted in much higher accuracy and improved customer service."
4.2.4 Product hierarchy
Different levels of the organization will refer to different levels of products. For example, the stock keeping unit, or SKU, is the lowest level of the hierarchy and refers to a unit that is sold of a product. Sometimes P&G will replace one SKU number with a new SKU number when the image on the packaging changes, although it is the same product in the same quantity. In this case, to ease the transition between the two numbers, though different SKUs, the term, demand forecast unit, or dfu, is used to refer to the level above SKU referring to the size for which a product is forecast. Above this, products are aggregated according to similarities. The hierarchy varies based on the product, but an example is shown in the figure below:
15 Sheffi,,Yossi. "A Demand for Steady Supply" Financial Times. August 22, 2005.
PRODUCT HIERARCHY
Category: Fabric Care3.
Brand: Tide
Packaging: Bottle
Fragrance: Clean Breeze
Sku: Tide Clean Breeze Liquid, 100 oz
Figure 4.1 Sample of Product Hierarchy
As shown in Figure 4.1, Tide, Era, Gain, Cheer, and Ivory Snow are all P&G brands of laundry detergent. Combining the concepts of aggregation, predicting the monthly sales of the laundry category is easier than predicting a particular brand. Once inside the liquid form of the Tide brand, it is more difficult to predict whether a customer will stick with Mountain Spring Tide, or switch to April Fresh. Lastly, the largest amount of forecast error would occur for the SKU, which defines the unit sold. Thus, as you move up the product hierarchy, products are
aggregated together according to common features, and the forecast also tends to become more accurate.
4.2.5 Events
The term "event" refers to different instances which represent a deviation from normal day-to-day business operations. Events can have a large impact on demand, and are thus critical to the
forecast. Different types of events include merchandising, price changes, new item introductions, planogram or distribution changes. Merchandising refers to special efforts to encourage sales of
an existing product, such as a special advertising campaign, end-of-aisle display or other shelf arrangement, brochures, or perhaps coupons. When a new price is rolled out for an existing product line, the purchasing behavior from the customer can be impacted. For example,
customers may over-order in advance of a price increase. New item introductions are difficult to
forecast as explained by the thesis of the previous P&G intern.16 A 'planogram' is a graphic diagram showing how and where specific retail products should be placed on retail shelves or displays. Changes in the customer stores can have a large impact on product sales.
4.3 Planning Processes
This section will explain the process used by demand planning, building upon the terminology discussed previously. The over five hundred demand planners execute a weekly process where they generate a SKU-level forecast, in weekly buckets, for every week for a period of years. This process employs historical data, user input, and the use of a statistical forecasting tool which incorporates many of the important inputs to determining a forecast.
4.3.1
Factors Influencing Demand
The factors coming together in the statistical forecasting tool are demonstrated in the following diagram excerpted from P&G's Demand Planning Global Process Owner, Richard Clark.
Company Plans
Promotions Advertising Sampling Initiative s Pipelines I Pricing Master DataSales
Forecast by product, location, periodOrders & Shipments
Forecasting
.
Tool
For sales, manufacturing, finance, etc.Incorporate Six C's
Customers Consumers Competition Consumption Customization CannibalizationFigure 4.2 Inputs to the Sales Forecasting Tool "
16 Cheung, Christine. "A Short-range Forecasting and Inventory Strategy for New Product Launches." MIT Thesis.
2005.
" Clark, Richard A. "Demand Planning Overview: Key Elements of P&G's Global Demand Planning Process." Internal P&G Documentation. December 9, 2004.
Figure 4.2 depicts the demand planner's use of the sales forecasting tool to generate forecasts. The sales forecast tool takes historical data, including years of shipment history, along with future orders as the base data. Additionally, master data is recorded around the size of shipping quantities, choice of forecast models, and the parameters used. The list of company plans are also important to consider. Promotions typically refer to discounts passed through to customers to encourage buying within a certain time window due to a reduced cost. Advertising can be accomplished through multiple media, and is intended to have an impact on sales. Many studies evaluate consumers and competitors response to changes in advertising and promotion.18
Distributing of product samples, launching of new initiatives and the time and quantity to fill a new product pipeline, along with fundamental pricing changes all reflect P&G decisions which have an impact on the forecast. Additionally, the external "C's" have an impact on the sales forecast. Customers who control the channel through which the products are sold make independent decisions with regard to their advertising, promotions, store placement which impact sales. Consumer tastes and preferences continually change and impact demand. Direct competition can be beneficial by increasing the awareness of a market, or can steal demand by attracting customers away whether based on quality or cost. Previous history of consumption is important, as with consumer goods, the inventory that the average consumer has will impact buying patterns. For example, when consumers run out of toilet paper at home, they are likely to purchase another roll, regardless of price. However, if they have recently purchased a mass merchandiser case of 100 rolls, they are unlikely to purchase even more regardless of the
promotion offered. Lastly, P&G can cannibalize their own products as they have multiple brands which serve the same marketplace.
4.3.2 Statistical Forecast
The first step in the demand planning process is to develop the statistical forecast. The demand planner is responsible for evaluating, selecting, maintaining and updating the forecast model which predicts sales based on historical data and model parameters. The model parameters are set based on a review of historical data, assumptions about market behavior, and an evaluation of how well different models perform at predicting future demand. The statistical forecast is the output of the computerized sales forecasting tool which predicts demand by demand forecast unit, in most cases the SKU, by week for an extended period of time.
4.3.3 Independent Net Forecast
With the statistical forecast, the demand planner classifies the SKUs according to their historical demand profile. For each supply chain, focus is placed on those which have the most impact on overall shipment variation and forecast error for the category. The demand planner meets with organizations such as the marketing and sales functions to collect intelligence on special causes which might impact demand. The planner uses historical data to determine what manual forecast adjustments are warranted from the information. This generates the "independent net forecast," the final forecast which is communicated to the organizations within P&G.
18 Ailawadi, Kusum L., Donald R. Lehmann, and Scott A. Neslin. "Market Response to a Major Policy Change in the Marketing Mix: Learning from Procter & Gamble's Value Pricing Strategy" Journal of Marketing, 65, 44-61, 2001.
4.4 Relationship to Organization
Demand planning requires significant interaction with the other organizations at P&G.
Organizational motivations can have an impact on the forecast. In some markets, regional sales input might be inclined to over-forecast demand to ensure that product is available and no shortages occur. Since inventory is owned by the GBU, not the MDO, there is no penalty for the MDO if excess material is not able to be sold. In a softening business, market representatives may encourage planners to keep demand high to justify additional spending. Thus much of the work of the demand planner is to drive out bias introduced by organizational motivations. Much of the success of the demand planner comes from managing by influence.
The output of the demand planning process is a forecast by SKU, for a group of customers, for a weekly bucket by region. In order to transform this forecast into more detailed demand plan which can be used for site integrated planning, split tables are maintained which maintain fixed percentages for materials and the manufacturing plants. For example, if two plants, A and B, both make a certain SKU of Tide, the table maintains a data record for Tide indicating that 30% will be manufactured in plant A and 70% will be manufactured in plant B. These tables are also maintained for the days of the week, keeping fixed percentages for each day, based on material.
The demand planning organization essentially presents a volume forecast to a particular product, split according to groups of customers. However, it is the product supply organization, which lies within the GBUs, that takes the forecast and translates it into a plan detailing exactly when and what each plant will make. This group also maintains the inventory levels and is responsible for procuring raw materials. Thus the impacts of the good or bad forecast are typically not felt
by the planning organization, but by another branch of P&G.
5 Measuring Forecast Accuracy
It is clear that demand planning plays an important, yet complicated role in the organization. Thus, measuring forecast accuracy is critical not only for analyzing the performance of the
forecast process, but also for determining how to properly design the rest of the organizational processes to deal with this uncertainty. For example, inventory levels and customer service are
directly impacted by the forecast error. This section will introduce the main areas of forecast accuracy used at P&G.
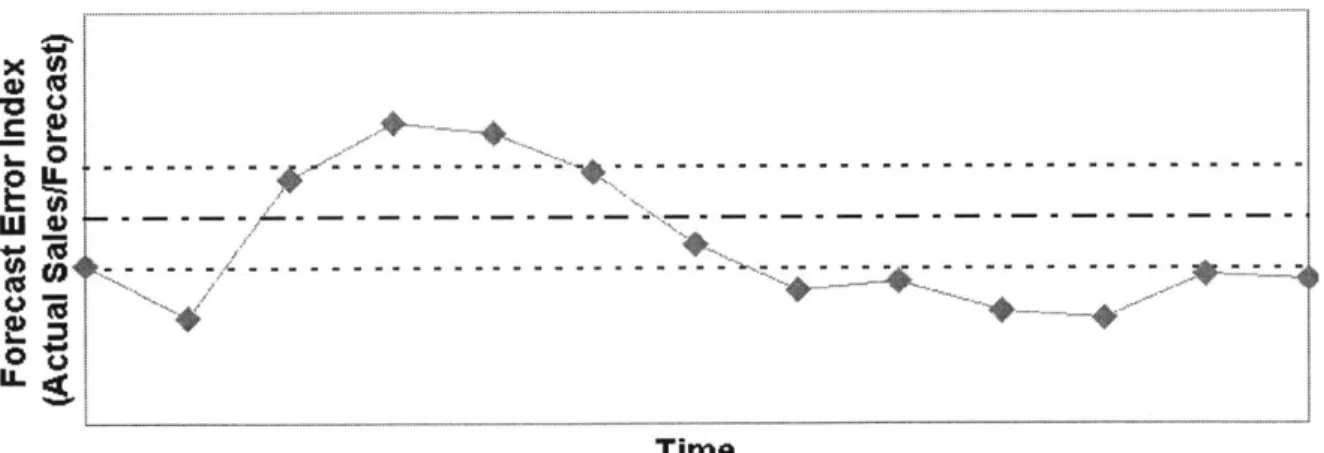
5.1 Forecast Error Index
A simple index is commonly used to review forecast error at P&G. The index is simply a ratio
of the actual sales, as measured by shipment volume to the sales forecast for that period. This is shown as follows:
Forecast Error Index: Actual Sales/Forecast * 100
This simple ratio is represented as a percent, so that a value of 100 indicates that the sales matched the forecast, and a number over 100, indicates that the sales exceeded the expectations. Whereas a number below 100 indicates that sales did not meet the forecast. This not only gives an indication of the size of the error (the difference from 100), but also a visible measure of the bias, which is the tendency to over, or under-forecast demand.
5.2 Bias
Silver, Pyke and Peterson indicate that the term bias is used to indicate that on average a forecast is substantially above or below actual demand.19 Bias is commonly indicated by evaluating a period of forecast error indices to determine if over an extended period of time, the errors lie heavier on one side of 100. It can be also evaluated using probabilities, to be explained later. Common perception is that bias can be removed by making a model correction, or by
management intervention.
5.3 WAPE: Weighted-Absolute Percent Error
The global standard definition that P&G uses for forecast error is WAPE, weighted-absolute percent error.20 P&G defines a process for calculating this factor, aggregating it up through the
19 Silver, Edward A., David F Pyke, and Rein Peterson. Inventory Management and Production Planning and Scheduling. 3rd Ed., John Wiley & Sons, 1998.
2 Kremblewski, Mark. "Supply Chain Forecast Error: Global Standard Definition" P&G Internal Documentation.
March 2005
organization and handling exception cases. This is detailed below based on training provided by Mark Kremblewski, Global Demand Planning Business Expert.
Supply Chain Error is based on a weekly measure of Absolute Percent Error (APE) by Demand Forecasting Unit (DFU) by Market:
APE = Absolute (Shipment-Forecast)/Forecast x 100%
When determining the forecast for a period of time, the appropriate 'lead-time' or 'time fence' between when the forecast was created and when the shipment occurred is left to the discretion of the demand planner but should in general reflect the 'supply chain cumulative lead time' for that DFU. For simplicity, entire brands, categories or even countries may use the same average lead-time.
Results are reported in a monthly aggregate. Aggregation is volume weighted based on shipping volume. DFU APE's are volume weighed, based on shipped, not forecast volume, horizontally across the month: this is the WAPE for a DFU for that month DFU. Additionally, APE's are volume weighed (based on shipped volume) vertically to the Brand: this is the WAPE for a Brand for that month. All further aggregations (to country, category, GBU, MDO, Global etc.) are all done on a shipped volume weighted basis.
W
Kshipment,
|
-forecast,,I
-Ishipment,
x-WAE n ,=
forecast,_
-_XOZshipment,
t=1
Standards are applied to other circumstances to ensure uniformity across P&G. For a DFU/week with a positive forecast but 0 (zero) shipments, APE should indicate 100%. This will not affect the Brand total WAPE since the volume weight of that data point is null (zero). For a DFU/week with a positive Forecast but <0 (negative) shipments, the APE will show a real calculated value. The weighting calculation will use the absolute value of the negative shipment. This may occur if product returns in a given period exceed shipments. Thus the error will affect the WAPE result in the correct direction. (If the negative were to be used in the weighing, this DFU/Week data point would serve to actually reduce the overall WAPE result). For a DFU/week with a 0 (zero) forecast and positive shipments, the APE calculation fails due to the divide by zero term, therefore these instances need to be excluded from the calculation. As these data points are excluded completely from aggregate calculations, removing them also essentially detracts from the actual volume shipped term of the equation. If the actual shipment is zero, even if there is a forecast, the data point will essentially be excluded as the weighting applied will be zero. This is summarized in the following table:
Forecast Actual Data point Weighted Roll Up
shipment shows
Real Real XX% Included
Real 0 100% Not included due to 0 weighting
Real < 0 XX% Absolute value of the Actual is used
for weighting (increases WAPE)
0 Real, 0, <0 Div/0 or NA Excluded
Additionally, in some cases if the forecast is close to zero, but a large shipment occurs, the error may become huge. Therefore P&G specifies a cap of 1000% for individual APE data points. This occurs when a very large shipment occurs (as in the shipment of a remnant) for a very small
forecast. In severe situations, these data points can make an entire country or region's WAPE result meaningless.
5.4 MAPE, Mean-Absolute Percent Error
The mean absolute percent error, MAPE follows identical rules to WAPE, however, it is not weighted based on the shipment volume, and is instead averaged across the data set, giving equal weight to each data point. Silver, Pyke and Peterson present MAPE as another intuitive measure of forecast error.21 Essentially, it measures the absolute percent error for each of the data points, and takes an un-weighted average across the data points, and then represents it as a percent error as shown below:
=
K
|shipment,
-forecast,-, jx100n ,aj forecast,_1
It is important to note that MAPE is not appropriate if demand values are very low. For example, a forecast of one unit of demand matched with an actual value of two units shows an error of 100 percent.
5.5 Probability
Another measure that has been commonly adopted at P&G is a probability. Managers easily understand a percent of how likely a behavior is to happen. Therefore probability is frequently used to evaluate bias, and indicate how likely an organization is to have a forecast that is over
100% versus a forecast that is under 100% -when measured by the forecast error index. The
probability that a forecast will be under 100 is determined by evaluating a normally distributed curve with a mean and standard deviation determined from the forecast error index data. The probability that a forecast will be over 100 can be determined by determining the difference from one. P&G strives for a forecast which is 50% likely to be over and under 100.
21 Silver, Edward A., David F Pyke, and Rein Peterson. Inventory Management and Production Planning and Scheduling. 3rd Ed., John Wiley & Sons, 1998.
6 Enabling Accountability for Forecast Accuracy
Previous chapters demonstrated the importance of forecast accuracy, and also discussed the general organizational structure at P&G. While there are a number of resources dedicated to demand planning, this organization is not functionally close with the supply organization which uses the forecast generated from demand planning. While the supply process and manufacturing
resides in the GBUs (Global Business Units), demand planning resides with the MDOs (Market Development Organizations). So while many functions may point to the demand planning process as contributing to issues, they do not have responsibility over the department. This becomes quite interesting when the MDO is responsible for budgeting the resources dedicated to forecasting, while it is the GBUs that are most impacted by the quality of the forecasts generated. This chapter details a process P&G employed to create accountability for forecast accuracy across the organization. Using a top-down metric driven approach, targets have been set for the company as a whole, and a process has been developed to disaggregate a metric into appropriate targets for sub-components, allowing managers to further demand accountability from within their organizations.
6.1 Motivation for Statistical Accountability Process
Forecast accuracy is critically important to P&G, as inaccuracy can have a direct impact on the stock price. P&G publishes quarterly statements, which indicate the sales revenue (in dollars) for the quarter. If these revenues exceed expectations, the stock price typically rises. If these revenues fall short of expectations, the stock price falls. Therefore the ability to accurately predict and manage future sales is critically important to the evaluation of the company.
When talking about the forecast generated for P&G as a whole, typically this is discussed in terms of dollars sold, instead of units sold. However, predicting quarterly profit is difficult as the contributing factors fluctuate with time. These factors include the mix of products sold, the cost to manufacture, distribute and sell these products, and the price achieved for each of these products. One of the challenges discussed is whether businesses generate the volume forecast of the units that will be sold, and then use this to drive the financial forecast (dollars of revenue), or whether businesses set the revenue (dollar) target, and then back calculate the volume forecast (units to sell).
In a move to create more accountability, accuracy, and clarity in the system, P&G has recently moved to use the S&OP Process (Sales and Operations Planning) to have all of the relevant parties represented at a routine meeting to generate the appropriate volume forecasts for
businesses. This S&OP process should generate the volume forecast, which should be the basis for the financial forecast. As Finance has a seat in the S&OP process, their opinions should be represented at this earlier point in the process, and the most realistic and accurate forecast should be generated.