HAL Id: hal-02991119
https://hal.archives-ouvertes.fr/hal-02991119
Submitted on 5 Nov 2020
HAL is a multi-disciplinary open access archive for the deposit and dissemination of sci-entific research documents, whether they are pub-lished or not. The documents may come from teaching and research institutions in France or abroad, or from public or private research centers.
L’archive ouverte pluridisciplinaire HAL, est destinée au dépôt et à la diffusion de documents scientifiques de niveau recherche, publiés ou non, émanant des établissements d’enseignement et de recherche français ou étrangers, des laboratoires publics ou privés.
Ultra-depleted 2.05 Ga komatiites of Finnish Lapland:
Products of grainy late accretion or core-mantle
interaction?
Igor Puchtel, Andrea Mundl-Petermeier, Mary Horan, Eero Hanski, Janne
Blichert-Toft, Richard Walker
To cite this version:
Igor Puchtel, Andrea Mundl-Petermeier, Mary Horan, Eero Hanski, Janne Blichert-Toft, et al.. Ultra-depleted 2.05 Ga komatiites of Finnish Lapland: Products of grainy late accretion or core-mantle interaction?. Chemical Geology, Elsevier, 2020, 554, pp.119801. �hal-02991119�
1 2 3 4 5 6 7 8 9 10 11 12 13 14 15 16 17 18 19 20 21 22 23 24 25 26 27 28 29 30 31 32 33 34 35 36 37 38 39 40 41 42 43 44 45 46 47 48 49 50 51 52 53 54 55 56 57 58 59 60 61
Ultra-depleted 2.05 Ga komatiites of Finnish Lapland: Products of grainy
1late accretion or core-mantle interaction?
23 4 5
Igor S. Puchtel1*, Andrea Mundl-Petermeier1,2, Mary Horan3, Eero J. Hanski4, 6
Janne Blichert-Toft5, and Richard J. Walker1, 7
8 9 10
1
Department of Geology, University of Maryland, 8000 Regents Drive, College Park, MD 20742, USA
11
2Department of Lithospheric Research, University of Vienna, Althanstraße 14, 1090 Vienna, Austria
12
3Department of Terrestrial Magnetism, Carnegie Institution for Science, 5241 Broad Branch Rd. NW,
13
Washington, DC 20015, USA
14
4Oulu Mining School, P.O. Box 3000, FI-90014 University of Oulu, Finland 5
Laboratoire de Géologie de Lyon, Ecole Normale Supérieure de Lyon, CNRS UMR 5276, Université de Lyon,
15
46 Allée d’Italie, 69007 Lyon, France
16 17 18
*Corresponding author: [email protected]
19 20 21 22 Revised for: 23 Chemical Geology 24 25 26
Revised for Chemical Geology 27
Version: June 24, 2020 28
29 30
Keywords: Hf-W, Sm-Nd, Lu-Hf, Re-Os and Pt-Os isotope systems; highly siderophile 31
elements; Paleoproterozoic komatiites; grainy late accretion; core-mantle interaction; Finnish 32
Lapland 33
34
*Revised manuscript with no changes marked
1 2 3 4 5 6 7 8 9 10 11 12 13 14 15 16 17 18 19 20 21 22 23 24 25 26 27 28 29 30 31 32 33 34 35 36 37 38 39 40 41 42 43 44 45 46 47 48 49 50 51 52 53 54 55 56 57 58 59 60 61 Abstract 35
Rhenium-Os, Pt-Os, Sm-Nd, Lu-Hf, and Hf-W isotope data, together with lithophile trace 36
element and highly siderophile element (HSE: Re, Os, Ir, Ru, Pt, and Pd) abundances, are 37
reported for 2.05 Ga Jeesiörova and Kevitsa komatiites from the Central Lapland Greenstone 38
Belt, Fennoscandia, Finland. Both komatiites are closely genetically related, with the Kevitsa 39
dikes having served as feeding magma conduits to the Jeesiörova pillowed and massive lavas. 40
The parental komatiite magma is estimated to have contained ~25 wt.% MgO and was, thus, 41
derived from a mantle source at least as hot as those of some of its late Archean counterparts. 42
A suite of Jeesiörova and Kevitsa whole-rock komatiite samples and olivine and chromite 43
separates define an internal Re-Os isochron with an age of 2049±13 Ma and an initial 187Os 44
= –0.2±0.2 (2SE), indicating long-term chondritic Re/Os in the mantle source. By contrast, Pt-45
Os data for a set of Jeesiörova chromite separates define an average initial 186Os = +29±2 46
(2SE), indicating a long-term history of suprachondritic Pt/Os in the mantle source. The 47
absolute HSE abundances in the mantle source of the Jeesiörova-Kevitsa komatiite system are 48
estimated to have been 120±5% of the present-day Bulk Silicate Earth (BSE). This is the first 49
komatiite system for which excess HSE in the mantle source, relative to modern BSE, has 50
been documented. 51
The 147Sm-143Nd and 176Lu-176Hf data yield isochron ages and initial ratios of, 52
respectively, 2046±22 Ma with 143Nd = +3.7±0.3, and 2072±20 Ma with 176Hf = +8.7±0.4 53
(2SE), indicating a long-term history of depletions of Nd relative to Sm, and Hf relative to Lu. 54
The measured 182W = +1.5±3.3 is indistinguishable from the modern mantle value. Despite 55
being strongly depleted in highly incompatible lithophile trace elements, the Th-Nb-La 56
systematics of the komatiites indicate ~1% crustal contamination of the original komatiite 57
magma, assuming the contaminant was similar in composition to the calculated 58
Fennoscandian Tonalite Average (FTA). This level of contamination would have also 59
significantly modified the Nd, Hf, and W isotope compositions of the original komatiitic 60
magma, but not the Os isotope compositions or HSE abundances. The calculated original 61
komatiite magma, corrected for the effects of crustal contamination, would have had initial 62
143
Nd ~ +4.9, 176Hf ~ +10.2, and 182W ~ –10. 63
Our modeling indicates that the initial 186,187Os/188Os isotopic compositions and 64
suprachondritic HSE abundances, coupled with the projected negative 182W, are best 65
explained by either (1) derivation from a mantle domain characterized by an excess of late 66
accreted, differentiated planetesimal core metal, i.e., “grainy” late accretion, or (2) addition of 67
chemically fractionated terrestrial core metal to the mantle source domain of the komatiites. 68
The presence of these characteristics in the Jeesiörova-Kevitsa komatiite mantle source 69
provides further evidence for the early creation and long-term survival of chemically diverse 70
domains within the mantle. 71
1 2 3 4 5 6 7 8 9 10 11 12 13 14 15 16 17 18 19 20 21 22 23 24 25 26 27 28 29 30 31 32 33 34 35 36 37 38 39 40 41 42 43 44 45 46 47 48 49 50 51 52 53 54 55 56 57 58 59 60 61 1. Introduction 73
The chemically and isotopically heterogeneous nature of the mantle has long been 74
established, largely through the study of modern rocks (e.g., Gast et al., 1964; Hart and 75
Brooks, 1977; Zindler et al., 1982; White and Hofmann, 1982; White and Patchett, 1984; 76
Hofmann, 1984, 1997; Jacobsen, 1988; Galer and Goldstein, 1991). However, the origin of 77
the heterogeneities for different elements and isotopic systems (e.g., 146,147Sm-142,143Nd, 176 Lu-78
176
Hf, 182Hf-182W), as well as their length scales and residence times, remain topics of debate. 79
Some of the heterogeneities have been argued to be primordial, reflecting initial planetary 80
accretion/differentiation, including magma ocean crystallization processes (e.g., Goldstein 81
and Galer, 1992; Albarède et al., 2000; Boyet and Carlson, 2005; Touboul et al., 2012; 82
Jacobsen and Yu, 2015; Puchtel et al., 2013; 2016a; Rizo et al., 2016b; Mundl et al., 2017; 83
Mundl-Petermeier et al., 2019; Tusch et al., 2019), while others may have originated as a 84
result of a protracted accretion history (Willbold et al., 2011; Kruijer et al., 2015; Touboul et 85
al., 2015; Puchtel et al., 2018; Archer et al., 2019). 86
Osmium isotope and highly siderophile element (HSE, including Re, Os, Ir, Ru, Pt, and 87
Pd) abundance systematics of the mantle through time provide information about certain 88
aspects of early Earth processes. For example, the observation that the HSE occur in 89
approximately chondritic relative proportions in the Bulk Silicate Earth (BSE), and that 90
absolute abundances of at least some of the HSE are higher than would be expected from 91
metal-silicate equilibration during core formation, have led to the concept of late accretion, 92
which purports that 0.5-1% of Earth’s mass was accreted to the mantle subsequent to 93
cessation of core formation (Kimura et al., 1974; Chou et al., 1983; Morgan, 1985, 1986). 94
Issues related to the nature of late accretion include the composition of the late accreted 95
materials and the time frame within which they were delivered to Earth and homogenized 96
within the mantle (e.g., Bennett et al., 2002; Maier et al., 2009; Coggon et al., 2013; Walker et 97
al., 2015; van de Löcht et al., 2018). 98
The Os isotopic composition and absolute HSE abundances of portions of the Archean 99
mantle have been the subject of considerable prior study (e.g., Brügmann et al., 1987; Walker 100
et al., 1988; Foster et al., 1996; Gangopadhyay and Walker, 2003; Puchtel et al., 2014, 101
2016a,b; 2018; Maier et al., 2009). These studies have mostly focused on komatiites because 102
komatiites are valuable probes of absolute HSE abundances and Os isotopic compositions in 103
some portions of the mantle. This stems from the fact that most komatiites were formed by 104
sufficiently high degrees of partial melting that the dominant sulfide hosts of HSE in the 105
mantle were dissolved into the melts. Under such conditions, the HSE abundances in 106
1 2 3 4 5 6 7 8 9 10 11 12 13 14 15 16 17 18 19 20 21 22 23 24 25 26 27 28 29 30 31 32 33 34 35 36 37 38 39 40 41 42 43 44 45 46 47 48 49 50 51 52 53 54 55 56 57 58 59 60 61
komatiitic melts are much more similar to the initial mantle source compositions than those in 107
basaltic melts. These high degrees of partial melting also led to comparatively high Os 108
abundances in komatiitic melts, which make their Os isotopic compositions insensitive to 109
crustal contamination. The high Os concentrations in komatiites, coupled with typically low 110
Re/Os ratios, mean that they can provide precise initial Os isotopic compositions of mantle 111
sources. 112
Compared to Archean komatiites, HSE and Os isotopes have been much less extensively 113
studied in their Proterozoic counterparts, primarily due to the paucity of Proterozoic 114
komatiites in the rock record. Here, we report combined 147Sm-143Nd, 176Lu-176Hf, 187 Re-115
187
Os, 190Pt-186Os, 182Hf-182W, and HSE and lithophile trace element abundance data for the 116
Proterozoic Kevitsa komatiitic dikes and associated Jeesiörova komatiites, all part of the 117
Central Lapland Greenstone Belt in Fennoscandia, Finland. The Kevitsa komatiite dikes in 118
particular display strong chemical differentiation trends, excellent preservation of igneous 119
minerals, including olivine, and no signs of interaction with their wall rocks (Mutanen, 1997; 120
Huhma et al., 2018). They hence provide ample opportunity for dating and obtaining 121
information on the composition of the original komatiitic magmas. We use these data to (i)
122
constrain the long-term evolution of the mantle domain from which the Fennoscandian Shield
123
was produced and which also gave rise to the komatiite parental magmas, and (ii) further
124
evaluate the extent of Archean-Paleoproterozoic mantle heterogeneity.
125
2. Geological background
126
Paleoproterozoic komatiites of Finnish Lapland are part of the Central Lapland 127
Greenstone Belt (Fig. 1), which consists of a thick supracrustal rock series spanning 570 Ma 128
(Hanski and Huhma, 2005). The komatiites are known to occur at two stratigraphic levels 129
and, as such, have been referred to as the lower and upper komatiites (Hanski et al., 2001). 130
The lower komatiites are found near the bottom of the succession and are assigned to the 131
Kuusamo Group. They were emplaced subaerially and, locally, lie directly on Archean 132
granitoid basement. A type occurrence has been described from the Möykkelmä area, where 133
komatiites form part of a 250-m-thick komatiite-tholeiite sequence with a strong upper crustal 134
signature in their chemical composition (Hanski and Huhma, 2005). Stratigraphically, the 135
lower komatiites can be correlated with the komatiitic lavas of the Vetreny Belt in the SW 136
part of the Fennoscandian Shield, which have an internal Re-Os isochron age of 2407±6 Ma 137
(Puchtel et al., 2016b). 138
1 2 3 4 5 6 7 8 9 10 11 12 13 14 15 16 17 18 19 20 21 22 23 24 25 26 27 28 29 30 31 32 33 34 35 36 37 38 39 40 41 42 43 44 45 46 47 48 49 50 51 52 53 54 55 56 57 58 59 60 61
The upper komatiites are associated with phyllites and black schists of the Savukoski 139
Group whose sedimentary precursors were deposited on cratonic siliciclastic sediments of the 140
Sodankylä Group (Hanski and Huhma, 2005). The upper komatiitic volcanic rocks extend 141
from Finnish Lapland to northern Norway over a distance of ~400 km and are associated with 142
Ti-rich picrites and basalts (Hanski et al., 2001). Unlike typical Archean komatiites, the upper 143
komatiites are characterized by the abundance of volcaniclastic eruptions (Saverikko, 1985; 144
Barnes and Often, 1990). They also occur as massive lava flows, pillow lavas, tuffs, and rare 145
layered flows. The volcanic structures and types of the associated sedimentary rocks attest to 146
submarine conditions of eruption in a deepened sedimentary basin. Although belonging to the 147
Al-undepleted, or Munro-type of lavas of Nesbitt et al. (1979) typical of late Archean 148
komatiite sequences, the upper komatiites are further distinct from Archean komatiites in 149
having elevated TiO2 contents and, therefore, they were classified as a Ti-enriched komatiite
150
type (Hanski et al., 2001). 151
The upper komatiites are best preserved in the Jeesiörova area studied by Hanski et al. 152
(2001). Magmatic olivine has not been reported to have been preserved in komatiitic lavas 153
anywhere in Finnish Lapland, but magmatic clinopyroxene is well preserved at Jeesiörova, 154
occurring as poikilitic intergrowths in olivine cumulates, as prismatic grains in gabbroic 155
rocks, and as needle-like crystals in pillowed and massive lavas. The presence of magmatic 156
clinopyroxene in the lavas allowed Hanski et al. (2001) to obtain a weighted average Sm-Nd 157
isochron age of 2056±25 Ma for clinopyroxene-whole-rock pairs for the Jeesiörova 158
komatiites. The initial 143Nd values range from +2 to +4 for individual samples, with the 159
most LREE-depleted samples having the highest initial 143Nd values. This inverse correlation 160
between the La/Sm and 143Nd values was interpreted to be the result of contamination by 161
material of the upper crustal rocks through which the Jeesiörova komatiite magma ascended 162
(Hanski et al., 2001). 163
Gangopadhyay et al. (2006) analyzed a set of whole-rock Jeesiörova komatiite samples 164
and chromite separates for Re-Os isotope systematics. Although the Re-Os system in the 165
whole-rock samples was found to be disturbed by post-magmatic processes, by analyzing 166
chromite separates, the authors constrained the initial 187Os/188Os ratio for the komatiite lavas 167
to be chondritic (187Os(T) = +0.1±0.6). 168
The Kevitsa komatiitic dikes were discovered by Mutanen (1997) during an exploration 169
drilling campaign of the Kevitsa Ni-Cu sulfide deposit. The dikes were penetrated by at least 170
a dozen drill holes in an area of ~1 km2, covering the ore-bearing part of the Kevitsa mafic-171
1 2 3 4 5 6 7 8 9 10 11 12 13 14 15 16 17 18 19 20 21 22 23 24 25 26 27 28 29 30 31 32 33 34 35 36 37 38 39 40 41 42 43 44 45 46 47 48 49 50 51 52 53 54 55 56 57 58 59 60 61
ultramafic intrusion (Fig. 1c). This intrusion is located approximately 50 km east of the 172
Jeesiörova area within pelitic metasediments of the Savukoski Group (Fig. 1a) and has a U-173
Pb zircon age of 2058±4 Ma (Mutanen and Huhma, 2001), which is identical, within 174
uncertainty, to the Sm-Nd age of the Jeesiörova komatiites. Each of the drill cores contains 175
from one to four dike intersections at depths varying from 12 to 870 m beneath the surface. 176
Although the true thickness of the dikes is less than 7 m, the lengths of the intersections reach 177
up to 16 m because the drill holes cut through the dikes at sharp angles (≤30°). 178
The dikes are generally subvertical, with the dip varying between 65° and 90°, and strike 179
approximately ENE (Mutanen, 2005). They are characterized by strong internal 180
differentiation related to olivine fractionation, having an olivine-enriched central part and 181
finer-grained chilled zones near contacts with the wall rocks, which are composed of olivine-182
pyroxene cumulates of the Kevitsa intrusion. The differentiation is rather symmetrical across 183
the dikes, suggesting that originally they were also steeply dipping. The dikes are chemically 184
similar to the Jeesiörova komatiites and have been interpreted to represent their feeder magma 185
conduits (Huhma et al., 2018); the absolute age of the dikes, however, has so far remained 186
unknown. 187
3. Samples
188
Sampling of the Kevitsa komatiite dikes was done at the National Drill Core Depot of the 189
Geological Survey of Finland, Loppi, Finland. Samples for chemical and isotopic analyses 190
were selected from drill core DDH 814, which contains two dike intersections at depths of 191
152.10–159.55 and 175.00–188.50 m, with the corresponding estimated thicknesses of the 192
dikes being ~1.3 and ~6.8 m. 193
For this study, we also prepared powders from hand specimens of the best preserved and 194
most primitive komatiite lava samples 12D-PPR, 13-EJH, and 17.1-PPR from the Jeesiörova 195
area (Hanski et al., 2001). In addition, we powdered sample LP-10 that was recently collected 196
from an olivine-phyric massive komatiite lava flow from the same area. 197
198
4. Analytical techniques
199
Details of the majority of the analytical techniques used in this study have been reported in a number of
200
previous publications (e.g., Puchtel et al., 2016a,b; 2018); these, therefore, are only briefly summarized here. In
201
contrast, full details are provided for those techniques implemented here for the first time.
202
4.1. Analysis of mineral compositions 203
1 2 3 4 5 6 7 8 9 10 11 12 13 14 15 16 17 18 19 20 21 22 23 24 25 26 27 28 29 30 31 32 33 34 35 36 37 38 39 40 41 42 43 44 45 46 47 48 49 50 51 52 53 54 55 56 57 58 59 60 61
Mineral compositions were determined using a JEOL JXA-8530F Plus Hyper Probe instrument at the
204
Center of Material Analysis, University of Oulu. The analytical conditions were an accelerating voltage of 15 kV
205
and a beam current of 15 nA. Peak and background counting times were 10 and 5 s, respectively. The standard
206
built-in ZAF correction routine was used.
207
4.2. Re-Os isotopic compositions and HSE abundances 208
The measurements of Ru, Pd, Re, Ir, and Pt were performed at the Plasma Laboratory (PL) on Faraday cups
209
of a ThermoFisher Neptune Plus ICP-MS in static mode using 1013 Ohm amplifiers. Isotopic mass fractionation
210
was monitored and corrected for by interspersing samples and standards. The external precision of the analyses
211
was estimated, on the basis of standard measurements performed during the period of the analytical campaign, to
212
be 185Re/187Re = 0.25%, 99Ru/101Ru = 0.26%, 191Ir/193Ir = 0.15%, 194Pt/196Pt = 0.10%, and 105Pd/106Pd = 0.08%
213
relative (2SD). The accuracy of the data was assessed by comparing the results for the reference materials IAG
214
MUH-1 (Austrian harzburgite), IAG OKUM (ultramafic komatiite), and NRC TDB-1 (Diabase PGE Rock
215
Material) obtained at the Isotope Geochemistry Laboratory (IGL) with the reference values. Concentrations of
216
all HSE and Os isotopic compositions obtained at the IGL are within the uncertainties of the certified reference
217
values (Supplementary Table A1).
218
The average total analytical blank (TAB) measured during the present analytical campaign was (in pg): Ru
219
6.0, Pd 17, Re 0.53, Os 0.42, Ir 1.2, and Pt 174 (N = 9). For the whole-rock komatiite samples, the average TAB
220
constituted less than 0.1% for Os, Re, Ir, Ru, and Pd, and less than 1% for Pt of the total amount of element
221
analyzed. For the olivine and chromite separates, the TAB for Os and Ir constituted less than 0.1%, for Ru less
222
than 0.4%, for Re between 0.1 and 3%, for Pt between 14 and 19%, and for Pd less than 1% of the total amount
223
of element analyzed. We, therefore, cite ±0.1% as the uncertainty on the concentrations of Os, ±0.2% for Ir,
224
between 0.3 and 0.4% for Ru, between 0.1 and 1% for Pd, between 0.1 and 3% for Re, and between 1.0 and 19%
225
for Pt, of the total amount of element analyzed. The uncertainty on the Re/Os ratio for each sample was
226
calculated by multiplying the estimated uncertainties on the Re and Os abundances. These uncertainties vary
227
between 0.30 and 3.0% relative.
228
4.3. Pt-Os isotopic data. 229
In order to obtain the amount of Os required for high-precision measurements of 186Os/188Os and 187Os/188Os
230
(~100 ng), ~1.0 g of pure chromite separates from Jeesiörova komatiite samples 12D-PPR and 13-EJH,
231
representing different fractions in terms of magnetic susceptibility and density, were digested in Carius tubes.
232
For the initial unspiked digestions, six ~1 g fractions of chromite separate 12D-PPR and two fractions of 13-EJH
233
were digested. After the digestion was complete, the tubes were chilled, opened, and ~2% of the acid sample
234
solution from each CT were transferred into a 25 mL Pyrex™ CT for precise determination of Pt/Os, Re/Os, and
235
Ir/Os. The spiked aliquots were processed using the same procedure utilized for the Re-Os and HSE analyses.
236
From the remaining part of the unspiked acid sample solutions, Os was extracted and purified using the same
237
protocol utilized for the Re-Os work. The Os cuts from the batch of two CT containing sample 13-EJH were
238
combined into one cut and used for the precise measurements of 186Os/188Os and 187Os/188Os in this sample. For
239
sample 12D-PPR, every Os cut from six individual CT was used for the precise measurements of Os isotopic
240
compositions. For TAB-corrections of the data from the spiked aliquots, since the ID digestion introduced ~98%
241
of the total blank, the TAB of the initial (IC) digestion was considered negligible.
1 2 3 4 5 6 7 8 9 10 11 12 13 14 15 16 17 18 19 20 21 22 23 24 25 26 27 28 29 30 31 32 33 34 35 36 37 38 39 40 41 42 43 44 45 46 47 48 49 50 51 52 53 54 55 56 57 58 59 60 61
The high-precision measurements of the 186Os/188Os and 187Os/188Os ratios were performed by N-TIMS in
243
static mode on a ThermoFisher Triton® mass spectrometer at the IGL. During each run, between 1200 and 2400
244
ratios were collected for each sample load; the in-run uncertainties on the measured 186Os/188Os and 187Os/188Os
245
ratios are quoted as 2SE. The possible isobaric interference of 186W16O3- on 186Os16O3- was monitored and
246
corrected for by measuring masses 184OsO3- and 183W16O3- using the electron multiplier.
247
The mean of the Johnson-Matthey Os standard runs during the period of data collection was 0.001302±2 for
248
184Os/188Os, 0.1198432±18 (±15 ppm) for 186Os/188Os, and 0.1137950±18 (16 ppm) for 187Os/188Os (2SD, N =
249
14); these long-term reproducibilities were used to assess the true uncertainty on the measured 186Os/188Os and
250
187Os/188Os ratios for individual samples.
251
4.4. Tungsten isotopic compositions and abundances 252
The W isotope analyses were carried out at the IGL. For each sample, approximately 100 grams of powder
253
were processed to obtain the ~1 g of W necessary for high-precision W isotope measurements. The sample
254
powders for each sample were digested in four 300 mL Savillex Teflon screw-cap vials using a 5:1 mixture of
255
double-distilled concentrated HF and HNO3 on a hot plate at 150°C for one week. Tungsten was separated and
256
purified using the four-stage ion-exchange chromatography protocol described in Peters et al. (2019), with minor
257
modifications. The third stage involving a 1.5 mL anion-exchange column was repeated to improve the
258
separation of Ti from W, and this step significantly increased W ionization efficiency. Tungsten recovery using
259
this procedure was better than 90%.
260
Tungsten isotopic compositions were measured by N-TIMS on a ThermoFisher Triton mass spectrometer at
261
the IGL using a 2-line multi-static acquisition protocol and following a slightly modified technique described by
262
Archer et al. (2017). All data are reported as µ182W and µ183W, which are the part per million (ppm) deviations
263
of 182W/184W and 183W/184W, respectively, in a given sample from those of the in-house Alfa Aesar laboratory W
264
standard. Uncertainties on 182W, based on the long-term 2SD of our Alfa Aesar laboratory standard, were ±4.5
265
ppm. The measured 183W/184W ratios were identical within uncertainties (±6 183W units) to those in the average
266
Alfa Aesar standard data. 267
Tungsten abundances were determined by isotope dilution ICP-MS. Tungsten was purified using a
268
previously established anion-exchange chromatography technique (e.g., Kleine et al., 2004). Concentrations
269
were measured using the Element 2 single-collector ICP-MS at the PL. Typical uncertainties were ~5% relative.
270
4.5. Sm-Nd isotopic compositions and abundances 271
The Sm-Nd isotopic data were collected at the IGL. Approximately 300 mg of whole-rock komatiite sample
272
powder, or between 300 and 400 mg of pure clinopyroxene separates, were digested. Measurements of the Nd
273
isotopic compositions were performed on Faraday cups of the ThermoFisher Neptune Plus ICP-MS at the PL in
274
static mode followed by off-line correction for spike contributions. For each sample, 200 to 300 ratios were
275
collected with 8 s integration times in blocks of 100 ratios each. For every block of data collected, the peaks
276
were centered, and a 30 s baseline measurement was performed for each Faraday cup/amplifier pair by beam
277
deflection. The effects of instrumental mass fractionation were corrected for relative to 146Nd/144Nd = 0.7219
278
using an exponential law. A total of five to six 60 ppb AMES Nd standard solutions were run at the beginning
279
and end of the analytical session, with 200 to 300 ratios collected during each measurement. The in-run precision
1 2 3 4 5 6 7 8 9 10 11 12 13 14 15 16 17 18 19 20 21 22 23 24 25 26 27 28 29 30 31 32 33 34 35 36 37 38 39 40 41 42 43 44 45 46 47 48 49 50 51 52 53 54 55 56 57 58 59 60 61
of the measured 143Nd/144Nd ratio for both samples and standards was between 5 and 7 ppm (2SE). During the
281
course of the present analytical campaign, the external reproducibility of the 60 ppb AMES Nd standard solution
282
measurements for 143Nd/144Nd was ±7.0 ppm (2SD). The average 143Nd/144Nd measured for the AMES Nd
283
standard during each analytical session was used to calculate the instrumental mass bias coefficient for
284
correction of the measured 143Nd/144Nd in the samples using the long-term average 143Nd/144Nd value measured
285
precisely for the AMES Nd standard on the IGL ThermoFisher Triton (0.512152±2; Puchtel et al., 2018).
286
In order to assess the accuracy of the analyses, several separate powder aliquots of USGS GRM BIR-1 and
287
BCR-1 were processed and analyzed using the same analytical protocol. The measured 143Nd/144Nd ratios for
288
both GRM are identical, within their respective uncertainties, to the GeoRem preferred values (Supplementary
289
Table A2), as well as to the average high-precision value for BCR-1 obtained on the IGL ThermoFisher Triton
290
(0.512645±1; Puchtel et al., 2018).
291
Measurements of the Sm isotopic compositions were also performed on Faraday cups of the ThermoFisher
292
Neptune Plus ICP-MS at the PL in static mode. For each sample, 20 ratios were collected with 8 s integration 293
times in blocks of 10 ratios each. The effects of instrumental mass fractionation were corrected for relative to
294
147Sm/152Sm = 0.56081 using an exponential law. The uncertainty on the Sm/Nd ratio in the samples analyzed
295
was estimated on the basis of replicate analyses of the USGS GRM BCR-1 (147Sm/144Nd = 0.13941±0.00014) to
296
be 0.10% relative (2SD).
297
4.6. Lu-Hf isotopic compositions and abundances 298
The Hf isotopic compositions and Lu and Hf concentrations in the Jeesiörova komatiites were determined at
299
the IGL and the Department of Terrestrial Magnatism (DTM), Carnegie Institution for Science. At the IGL,
300
approximately 500 mg of the whole-rock sample powder and pure clinopyroxene separate were weighted out in
301
15 mL Teflon inserts of Parr bombs with 7 mL double-distilled concentrated HF, 1.5 mL HNO3, and an
302
appropriate amount of mixed 176Lu-178Hf spike, sealed in stainless steel jackets and digested in an oven at 170°C
303
for one week. The solutions were dried down, 0.7 mL of concentrated SeaStar HClO4 added to the residue, the
304
inserts re-sealed and kept on a hotplate at 180°C for 24 hours. The solutions were then dried down at ~230°C,
305
and the residues converted into the chloride form using 6M HCl. This step was repeated several times until clear
306
solutions were obtained, and then dried down.
307
At DTM, the residue was re-dissolved in 5 ml of a 1M HCl – 0.1M HF mixture, and loaded onto a 0.6×20
308
cm column filled with AG50W-X8 200-400 mesh cation-exchange resin. High field strength elements, including
309
Hf, were eluted in the loading solution and an additional 5 mL of 1M HCl – 0.1M HF. After eluting 44 ml of
310
2.5M HCl, heavy REE, including Lu, were eluted in 12 mL of 4M HCl (Blichert-Toft, 2001). Hafnium was
311
purified on a 0.6×10 cm column of Eichrom LN resin (100-150 m bead size) by loading the sample in 5 mL of
312
2.5N HCl, followed by washes of 10 mL 2.5M HCl, 10 mL 6M HCl, 4 mL H2O, 40 mL of a mixture consisting
313
of 0.09M Citric acid – 0.45M HNO3 – 1% H2O2, 5 mL of the same solution without H2O2, and, finally, 20 mL of
314
6M HCl – 0.06N HF. Hafnium was then eluted in 8 mL of 6M HCl – 0.4M HF. Lutetium was purified using
315
Eichrom LN resin (50-100 m bead size) on a 0.4×7 cm column. The HREE fraction from the first column was
316
loaded in 2.5M HCl, followed by a wash of 30 mL 2.5M HCl to remove much of the other HREE, then Lu was
317
collected in 10 mL 6M HCl. The resultant Hf and Lu cuts were used for the measurements of the Hf and Lu
318
isotopic compositions.
1 2 3 4 5 6 7 8 9 10 11 12 13 14 15 16 17 18 19 20 21 22 23 24 25 26 27 28 29 30 31 32 33 34 35 36 37 38 39 40 41 42 43 44 45 46 47 48 49 50 51 52 53 54 55 56 57 58 59 60 61
Measurements of the Hf isotopic compositions were performed on the Faraday cups of the ThermoFisher
320
Neptune Plus ICP-MS at the PL in static mode followed by off-line correction for spike contributions. For each 321
sample, 200 to 300 ratios were collected with 8 s integration time in blocks of 100 ratios each. Before each
322
sample measurement, a 60 s baseline measurement was performed for each Faraday cup/amplifier pair without
323
beam deflection, and this baseline was then automatically subtracted from the sample beam. Instrumental mass
324
fractionation was corrected for relative to 179Hf/177Hf = 0.7325 using an exponential law. The Yb, Lu, Ta, and W
325
isobaric interferences were corrected for using 173Yb/176Yb = 1.256, 175Lu/176Lu = 37.70, 181Ta/180Ta = 8129, and
326
183W/180W = 109.0. A total of five 30 ppb JMC-475 Hf standard solutions were run at the beginning and end of
327
the analytical session, with 200 ratios collected during each measurement. During the measurements, the signal
328
intensities for both the standard and the samples were kept at constant levels, between 1.8 and 2.6 V on the 178Hf
329
mass; the in-run precision of the measured 176Hf/177Hf ratio for both samples and standards was between 11 and
330
13 ppm (2SE). During the course of the present analytical campaign, the external reproducibility of the 30 ppb
331
JMC-475 Hf standard solution measurements for 176Hf/177Hf was ±14 ppm (2SD); this value was used to
332
estimate the true uncertainty on the Hf isotopic analyses. The average 176Hf/177Hf ratio measured for the
JMC-333
475 Hf standard solution during the analytical session was used to calculate the instrumental mass bias
334
coefficient for correction of the measured 176Hf/177Hf ratio in the samples using the true value of 176Hf/177Hf =
335
0.282163±0.000009 as determined by a multiple dynamic analysis protocol of Blichert-Toft et al. (1997).
336
In order to assess the accuracy of the analyses, an aliquot of USGS GRM BCR-1 was processed and
337
analyzed using the same protocol as that used for the samples. The measured 176Hf/177Hf ratio of BCR-1 is
338
identical, within the uncertainty, to the GeoRem preferred value.
339
Measurements of the Lu isotopic compositions were also performed on the Faraday cups of the
340
ThermoFisher Neptune Plus ICP-MS at the PL in static mode. For each sample, 40 ratios were collected with 4 s 341
integration time in blocks of 20 ratios each. Before each sample measurement, a 60 s baseline measurement was
342
performed for each Faraday cup/amplifier pair without beam deflection, and this baseline was then automatically
343
subtracted from the sample beam. Instrumental mass fractionation was corrected for by analysis of a 10 ppb Lu
344
standard solution before and after every 4 samples. The Yb and Hf isobaric interferences were corrected for
on-345
line using 176Yb/173Yb = 0.7962 and 176Hf/177Hf = 0.2822. The Lu concentration obtained for the SRM BCR-1 in
346
this study was identical, within the uncertainty, to the GeoRem recommended value. The propagated uncertainty
347
on the Lu/Hf ratio in the samples analyzed is estimated to be 0.5%. The total analytical blanks were 70 pg for Hf
348
and 2 pg for Lu.
349 350
5. Results
351
5.1. Petrography of the komatiites
352
The studied samples of the Jeesiörova komatiites are massive rocks with up to 1 mm-sized 353
euhedral, completely serpentinized olivine phenocrysts in a groundmass of prismatic or 354
needle-like clinopyroxene crystals and devitrified glass (Fig. 2a in Hanski and Kamenetsky, 355
2003). The rocks also contain euhedral chromite grains up to 0.3 mm in size, often containing 356
melt inclusions (Figs. 2b and 2d in Hanski and Kamenetsky, 2003). 357
1 2 3 4 5 6 7 8 9 10 11 12 13 14 15 16 17 18 19 20 21 22 23 24 25 26 27 28 29 30 31 32 33 34 35 36 37 38 39 40 41 42 43 44 45 46 47 48 49 50 51 52 53 54 55 56 57 58 59 60 61
Compared to the Jeesiörova rocks, the Kevitsa komatiites analyzed in this study are 358
characterized by a much better preserved magmatic mineralogy. The rocks are olivine-359
porphyritic, with the most coarse-grained varieties found in dike centers, due to the presence 360
of olivine phenocrysts (Fig. 2A, B, E). The size of the phenocrysts is commonly less than 6 361
mm in the center of the dikes, decreasing gradually to 0.1-0.2 mm near the dike margins. 362
Occasionally, large amoeboid and embayed megacrysts are observed, with a maximum grain 363
size of ~2 cm (Fig. 3). Olivine phenocrysts show various morphologies; they are usually 364
euhedral to subhedral, but sometimes have irregular shapes with ragged outlines (Fig. 2D). 365
The latter are interpreted to be broken pieces of larger phenocrysts. Also observed are 366
elongated olivine bars up to 1 cm in length, with an aspect ratio of up to 20 (Fig. 2B). 367
Although olivine phenocrysts contain ubiquitous chrome spinel inclusions 0.1-0.3 mm in size, 368
some of the largest phenocrysts are nearly devoid of them; in these cases, chrome spinel 369
grains are concentrated along the olivine grain boundaries. 370
The holocrystalline groundmass is composed of clinopyroxene, orthopyroxene, olivine, 371
plagioclase, brown amphibole, and opaque minerals, including two kinds of spinels, chrome 372
spinel, and lamellar ilmenomagnetite (Fig. 2C). These oxides occur as individual or 373
composite grains, in which chrome spinel is partly surrounded by ilmenomagnetite. 374
Plagioclase forms lath-like grains up to 1 cm in length, but other silicates are anhedral or 375
equant, with their grain size ranging commonly between 0.1 and 0.5 mm. 376
The chilled margins of the dikes contain olivine microphenocrysts (<0.5 mm in size) and 377
some chrome spinel grains in a fine-grained to cryptocrystalline groundmass composed 378
mostly of clinopyroxene and plagioclase. It is noteworthy that no vesicles are found in the 379
contact zones, indicating that either the pressure of emplacement was too high for volatiles to 380
form a gas phase, or the volatile content was very low. 381
382
5.2. Mineral chemistry
383
Representative electron probe analyses of igneous minerals from the Kevitsa komatiites 384
are listed in the Supplementary Table A3. 385
5.2.1. Olivine. Olivine exhibits a continuous compositional range from Fo94.1 to Fo73.8,
386
with the highest forsterite content reported for large phenocrysts and the lowest for small 387
grains in the groundmass. Microphenocrysts in the chilled margin samples vary from Fo83.5 to
388
Fo93.2. The CaO content of all analyzed olivine grains is 0.20–0.32 wt.%, typical of magmatic
389
olivine. This, together with a negative correlation between MgO and MnO, indicates the 390
1 2 3 4 5 6 7 8 9 10 11 12 13 14 15 16 17 18 19 20 21 22 23 24 25 26 27 28 29 30 31 32 33 34 35 36 37 38 39 40 41 42 43 44 45 46 47 48 49 50 51 52 53 54 55 56 57 58 59 60 61
absence of xenocrystic mantle olivine among the grains analyzed. Instead, all olivine grains 391
are considered to be cognate phases crystallized from the same komatiitic parental magma. 392
5.2.2. Pyroxenes and plagioclase. Groundmass clinopyroxene has an augitic average
393
composition of En49Fs10Wo41 with Al2O3 ranging from 2.4 to 5.8 wt.% and TiO2 from 0.12 to
394
0.71 wt.%. Orthopyroxene grains average En71Fs25Wo4 and have 3.4–4.5 wt.% Al2O3 and
395
0.40–0.57 wt.% TiO2. The anorthite content of the analyzed plagioclase grains in the
396
groundmass ranges from 57.7 to 72.1 mol.%. 397
5.2.3. Chrome spinel. The most primitive chrome spinel grains have MgO contents of
398
around 15–16 wt.% and corresponding Mg# of 0.71–0.76, whereas in the most evolved 399
grains, MgO and Mg# drop to 2.7 wt.% and 0.14, respectively. The MgO-rich grains show an 400
average Al2O3 content of 14.7 wt.% and an average TiO2 concentration of 0.38 wt.%, yielding
401
Al2O3/TiO2 typical of well-preserved chrome spinel grains in komatiitic lavas in Central
402
Lapland, but distinct from the more Ti-rich spinels that occur in the associated picrites 403
(Hanski and Kamenetsky, 2013). 404
5.2.4. Amphibole. The compositions of the brown groundmass amphibole (Fig. 2B, C)
405
straddle the boundary between Ti-rich pargasite and Ti-rich magnesio-hastingsite. The TiO2
406
contents fall between 2.9 and 4.0 wt.%, consistent with the magmatic nature of the mineral. 407
Amphibole shows moderate Na2O contents of 2.3–3.0 wt.%, whereas K2O is low, 0.10–0.26
408
wt.%, consistent with the low level of K2O in the parental komatiite magma.
409
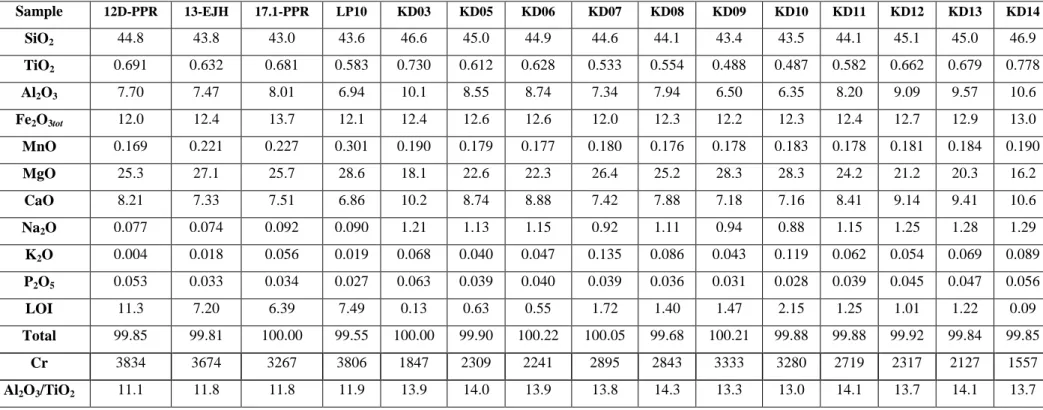
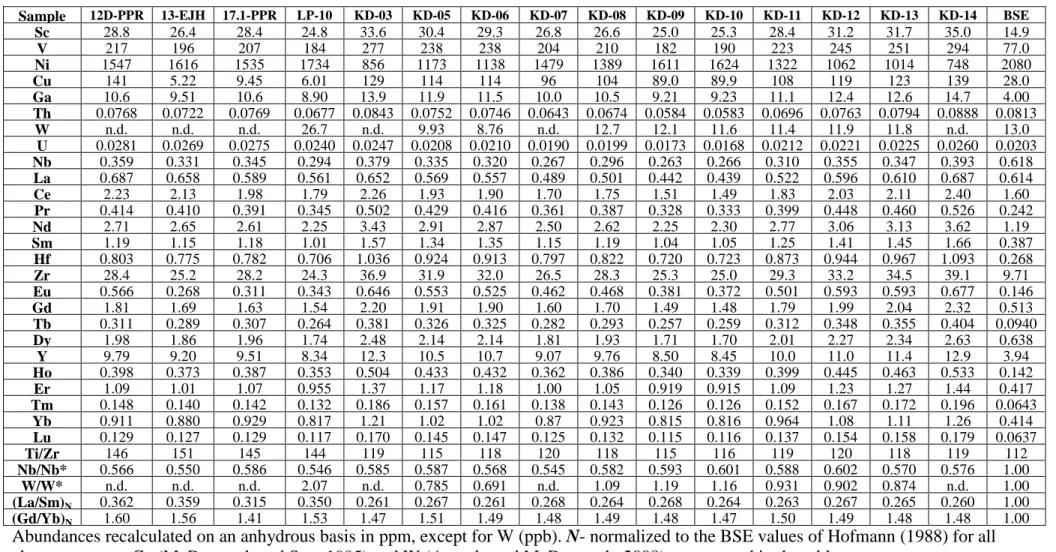
5.3. Major and lithophile trace element abundances
410
The major and trace element concentration data for the Jeesiörova and Kevitsa komatiites 411
are listed in Tables 1 and 2, and selected elements are plotted against MgO contents on 412
variation diagrams in Fig. 4 and as BSE-normalized values in Fig. 5. 413
The MgO abundances range between 25.3 and 28.6 wt.% in the Jeesiörova komatiites and 414
between 16.2 and 28.3 wt.% in the Kevitsa komatiites. In the Kevitsa komatiite dikes, the 415
lowest abundances are observed in the chilled margin samples and the highest abundances in 416
the samples from the central parts. The abundances of TiO2, CaO, Al2O3 and incompatible
417
lithophile trace elements in the dikes plot on well-constrained trends with negative slopes that 418
intersect the MgO axes at ~51 wt.%; these intersections correspond to the composition of 419
liquidus olivine obtained in this study and also reported for the dikes by Nicklas et al. (2019). 420
The abundances of the compatible elements Ni and Cr show positive correlations with MgO 421
1 2 3 4 5 6 7 8 9 10 11 12 13 14 15 16 17 18 19 20 21 22 23 24 25 26 27 28 29 30 31 32 33 34 35 36 37 38 39 40 41 42 43 44 45 46 47 48 49 50 51 52 53 54 55 56 57 58 59 60 61
contents (Fig. 4). These strong correlations reflect olivine and chromite control during 422
magmatic differentiation of the dikes, and also indicate immobile behavior of the elements 423
analyzed during secondary alteration processes. 424
The four samples of the Jeesiörova komatiites analyzed in this study have slightly higher 425
Ti, Cr, La, Ce, Th, and U concentrations compared to the Kevitsa komatiites (Fig. 4), but for 426
the rest of major and trace elements, plot on the same trends. The Jeesiörova and Kevitsa 427
komatiites have Al2O3/TiO2 (11.7±0.3 and 13.9±0.1, respectively, 2SE) that are lower, and
428
(Gd/Yb)N (1.53±0.08 and 1.49±0.01, respectively, 2SE) that are higher, than the BSE values
429
of 22.4 and 1.00, respectively. This is due to enrichment of the parental komatiite magma in 430
Ti and the middle REE, rather than to depletion in Al and the heavy REE, as is evident from 431
comparison with the typical Al-undepleted komatiites from Pyke Hill, Ontario, Canada (Fig. 432
4A). As such, they are classified as the Al-undepleted komatiite type of Nesbitt et al. (1979).
433
The BSE-normalized lithophile trace element abundances (Fig. 5) are characterized by 434
strong depletions in light REE ((La/Sm)N = 0.347±0.022 and 0.264±0.002 in the Jeesiörova
435
and Kevitsa komatiites, respectively; 2SE), sloping HREE ((Gd/Yb)N = 1.53±0.08 and
436
1.49±0.01, respectively; 2SE), and enrichments in Th and U relative to the neighboring 437
element with similar incompatibility, i.e., Nb ((Nb/Th)N = 0.595±0.019 and 0.583±0.011,
438
respectively). 439
440
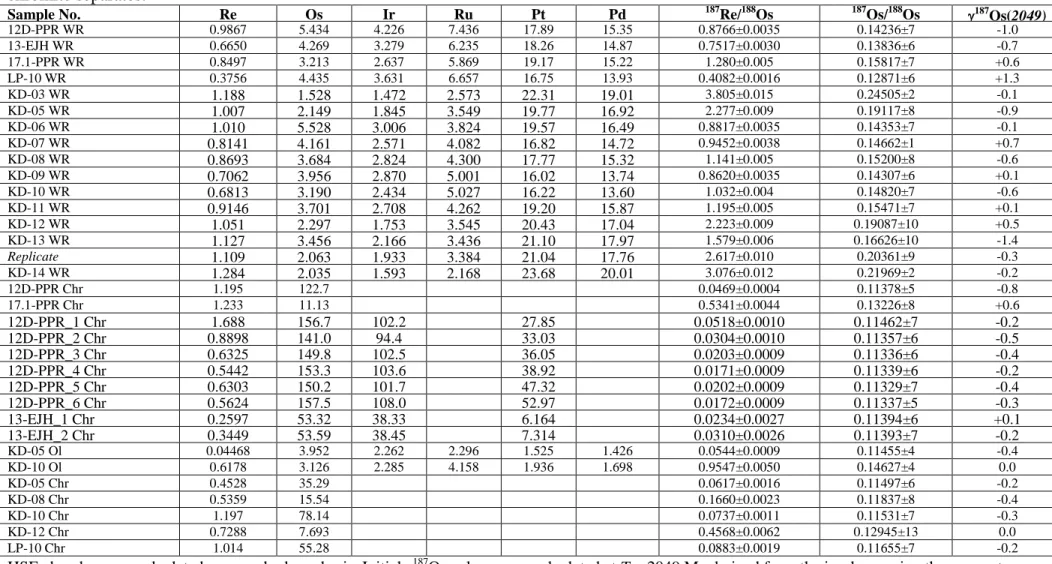
5.4. Re-Os isotopic compositions and HSE abundances
441
The Re-Os isotopic and HSE abundance data for the Jeesiörova and Kevitsa komatiites 442
and olivine and chromite separates are listed in Table 3 and plotted on the 187Re/188Os versus 443
187
Os/188Os diagram in Fig. 6, on a CI chondrite-normalized plot in Fig. 7, and on MgO 444
versus HSE variation diagrams in Fig. 8.
445
Thirty-three whole-rock samples and olivine and chromite separates define a regression 446
line with a slope corresponding to an ISOPLOT Model 3 age of 2049±13 Ma and a chondritic 447
initial 187Os/188Os = 0.11284±28 (187Os = –0.2±0.2). This age is in good agreement with the 448
internal Sm-Nd isochron age of 2056±25 Ma obtained by Hanski et al. (2001) for the 449
Jeesiörova komatiites. The initial 187Os = –0.2±0.2 is identical, within uncertainty, to the less 450
precise average initial 187Os = +0.1±0.6 obtained for chromite separates from the Jeesiörova 451
komatiites by Gangopadhyay et al. (2006). 452
In CI chondrite-normalized HSE diagrams (Fig. 7), the Jeesiörova and Kevitsa komatiite 453
samples display typical komatiitic patterns with moderate enrichments in incompatible Pt, Pd, 454
1 2 3 4 5 6 7 8 9 10 11 12 13 14 15 16 17 18 19 20 21 22 23 24 25 26 27 28 29 30 31 32 33 34 35 36 37 38 39 40 41 42 43 44 45 46 47 48 49 50 51 52 53 54 55 56 57 58 59 60 61
and Re relative to compatible Os, Ir, and Ru ((Pd/Ir)N = 2.84-10.1). By contrast, the two
455
olivine separates analyzed show an inverse relationship, being enriched in compatible relative 456
to incompatible HSE, with the exception of the elevated Re abundance in one of the separates. 457
This elevated Re concentration is, however, supported by the correspondingly more 458
radiogenic Os isotopic composition of this separate, indicating that the olivine likely 459
contained inclusions of interstitial melt enriched in incompatible elements. 460
In the MgO versus HSE diagrams (Fig. 8), variations in the Os and Ir contents show broad 461
positive correlations with the MgO abundances, with the large degree of scatter most likely 462
due to the presence of Os-Ir alloy on the liquidus, along with olivine. The Ru abundances 463
display a more regular behavior and were likely mostly controlled by chromite fractionation 464
during differentiation of the komatiites. 465
The Pt, Pd, and Re abundances show strong negative correlations with MgO contents and, 466
with the exception of some scatter in the Re content, especially among the Jeesiörova 467
komatiites, plot on the trends that pass through the olivine compositions; these variations are 468
consistent with olivine control, indicating both incompatible behavior of these HSE during 469
komatiite differentiation and their immobile behavior during post-magmatic processes. Of 470
note, the Jeesiörova and Kevitsa rocks show a subchondritic (Pt/Pd)N = 0.78±0.01, which is
471
typical of komatiites (e.g., Puchtel et al., 2009b), but is ~20% lower than the near-chondritic 472
ratios in the Ni-Cu-PGE sulfide deposits of Finnish Lapland (Mutanen 1997; Törmänen et al., 473
2016). 474
475
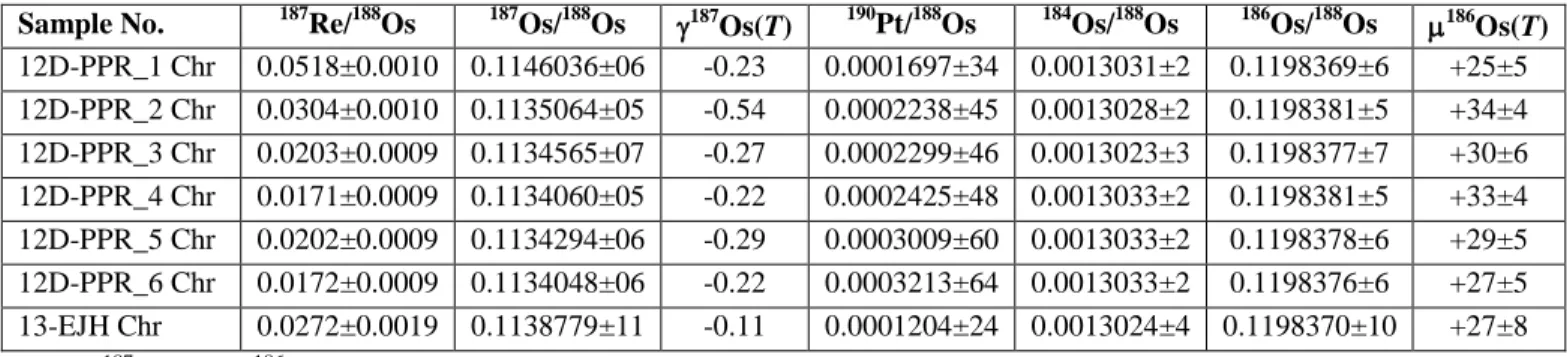
5.5. Pt-Os isotope systematics
476
The high-precision Os isotopic data for the chromite separates from the Jeesiörova 477
komatiite samples 12D-PPR and 13 EJH are presented in Table 4 and plotted on the 478
190
Pt/188Os versus 186Os/188Os diagram in Fig. 6B. The data for the seven chromite separates 479
define a regression line with a slope corresponding to an age of ~2.0 Ga and an average initial 480
186
Os/188Os = 0.1198369±3 (186Os = +29±2, 2SE) calculated for the time of the komatiite 481
emplacement derived from the Re-Os isochron (2049 Ma). 482
483
5.6. W isotopic compositions and abundances
484
The W abundances and isotopic compositions of the Jeesiörova and Kevitsa komatiites are 485
listed in Tables 2 and 5 and plotted in Fig. 4B and as BSE-normalized values in Fig. 5. The 486
W abundances vary between 8.8 and 13 ppb in the Kevitsa komatiites; the only analyzed 487
sample of the Jeesiörova komatiite contains 27 ppb W. In the MgO versus W variation 488
1 2 3 4 5 6 7 8 9 10 11 12 13 14 15 16 17 18 19 20 21 22 23 24 25 26 27 28 29 30 31 32 33 34 35 36 37 38 39 40 41 42 43 44 45 46 47 48 49 50 51 52 53 54 55 56 57 58 59 60 61
diagram (Fig. 4B), the data for the Kevitsa komatiites plot with some scatter around a nearly 489
horizontal trend line, whereas the only data point for the Jeesiörova komatiite plots above the 490
trend line. 491
The BSE-normalized trace element abundances (Fig. 5) for the Kevitsa komatiites are 492
characterized by small negative to positive W abundance offsets relative to neighboring 493
elements (i.e., Th and U) with similar incompatibility during mantle melting (W/W* = 494
0.95±0.13, where W/W* = WN/(√[ThN×UN]) and N are BSE-normalized values from Arevalo
495
and McDonough (2008) and Hofmann (1988)). The W/W* ratio in the only Jeesiörova 496
komatiite sample analyzed (LP10) is 2.1. 497
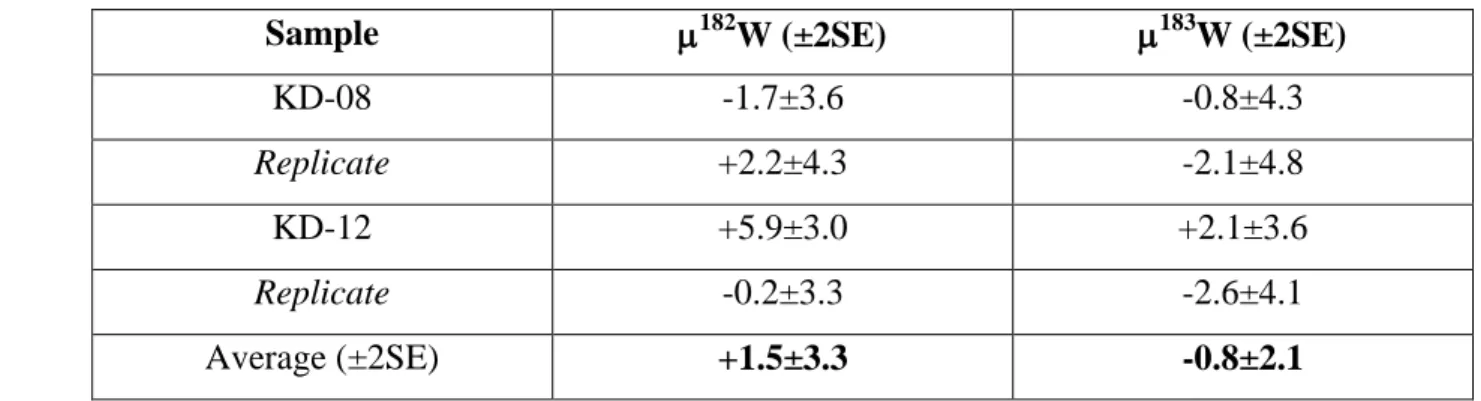
The two Kevitsa komatiite samples and two replicates analyzed in this study for W 498
isotopic composition, are characterized by 182W/184W ratios that are indistinguishable from 499
182
W/184W measured in the laboratory reference material, with an average 182W = +1.5±3.3 500
(2SE, n = 4), where 182W is the parts per million deviation of 182W/184W of a given sample 501
from that of the reference material, which, by definition, is equal to zero (Table 5). 502
503
5.7. Sm-Nd and Lu-Hf isotopic compositions and abundances
504
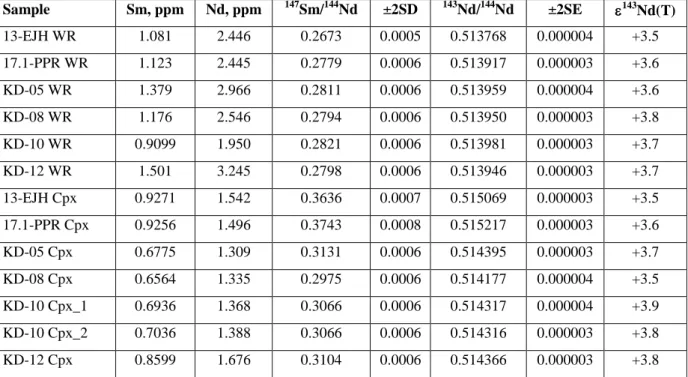
The 147Sm-143Nd isotopic and concentration data for the whole-rock samples and 505
clinopyroxene separates of the Jeesiörova and Kevitsa komatiites are listed in Table 6 and 506
plotted in Fig. 9. Regression of the combined Sm-Nd isotopic data (Fig. 9a) for 13 samples 507
yields a Model 1 ISOPLOT internal isochron age of 2046±22 Ma (MSWD = 2.4), which is 508
identical, within the uncertainty, to the Re-Os isochron age of 2049±13 Ma. The initial 143Nd 509
derived from the isochron is +3.8±0.9. The individual samples have very uniform initial Nd 510
isotopic compositions, with initial 143Nd ranging between +3.5 and +3.9. A more precise 511
initial 143Nd = +3.7±0.3 (2SD, n = 13) is obtained by averaging the initial 143Nd/144Nd ratios 512
calculated for each sample using the measured 147Sm/144Nd and 143Nd/144Nd ratios. Our results 513
are consistent with those obtained earlier for the most LREE-depleted Jeesiörova komatiites 514
(Hanski et al., 2001). 515
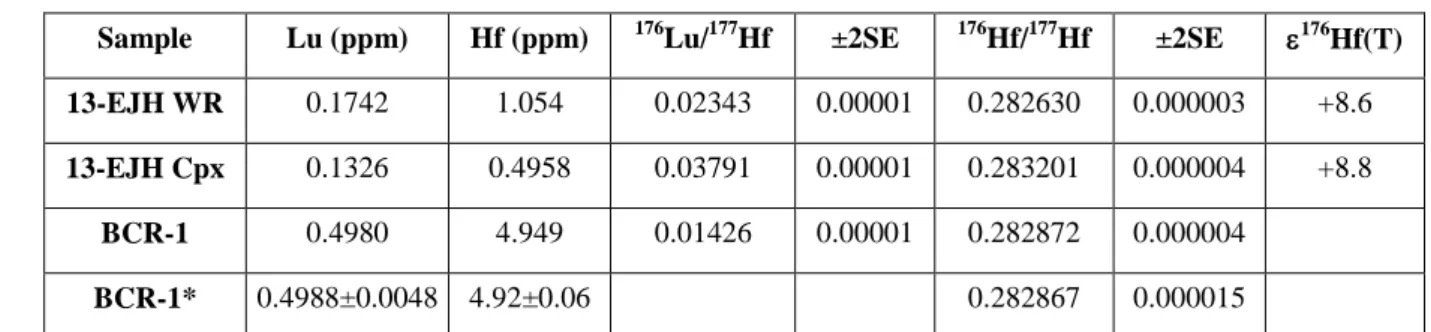
The 176Lu-176Hf data (Fig. 9b) for the Jeesiörova whole-rock komatiite sample 13-EJH 516
and clinopyroxene separate define a regression line in 176Lu/177Hf−176Hf/177Hf space with a 517
slope corresponding to an ISOPLOT Model 1 age of 2072±37 Ma, which also overlaps, 518
within uncertainties, the Re-Os emplacement age of the Jeesiörova and Kevitsa komatiites. 519
The initial 176Hf value derived from the regression is +8.7±0.7. The average initial 176Hf 520
1 2 3 4 5 6 7 8 9 10 11 12 13 14 15 16 17 18 19 20 21 22 23 24 25 26 27 28 29 30 31 32 33 34 35 36 37 38 39 40 41 42 43 44 45 46 47 48 49 50 51 52 53 54 55 56 57 58 59 60 61
value calculated for the two samples analyzed (+8.7±0.3, 2SD, n = 2) is identical to the one 521
derived from the isochron. 522
Plotted in Fig. 9c are the Nd and Hf isotopic data for the Jeesiörova komatiites, together 523
with the Nd-Hf terrestrial array from Blichert-Toft and Puchtel (2010). In contrast to other 524
late Archean and post-Archean komatiite systems (e.g., Kostomuksha: Blichert-Toft and 525
Puchtel, 2010; Abitibi: Puchtel et al., 2018; Vetreny: Puchtel et al., 2016a; Gorgona: 526
Thompson et al., 2003), the calculated initial 143Nd and 176Hf values of the Jeesiörova 527
komatiites (Fig. 9c) do not plot on the terrestrial array of Blichert-Toft and Puchtel (2010). 528
529
6. Discussion
530
6.1. Jeesiörova-Kevitsa emplaced komatiite magma composition
531
Nicklas et al. (2019) reported major and trace element abundance data for olivine 532
phenocrysts and whole-rock samples of the Kevitsa komatiites. Based on the Mg-Fe olivine-533
komatiite melt equilibria, these authors estimated that the parental magma to the Kevitsa 534
komatiites contained 27.4±2.4 wt.% MgO. By comparison for this study, in order to estimate 535
the parental magma composition, we used an approach different from that of Nicklas et al. 536
(2019). We performed mathematical incremental step-wise addition of olivine to a melt 537
composition represented by sample KD-14 (MgO = 16.3 wt.%) until the melt was in 538
equilibrium with olivine Fo94.1, the most MgO-rich olivine population found in the Kevitsa
539
komatiites (Nicklas et al., 2019, and this study). To select appropriate olivine-melt Fe-Mg 540
distribution coefficients (KD), we utilized the results of the isothermal crystallization
541
experiments of komatiitic liquids carried out by Sossi and O’Neill (2016). Using the empirical 542
KD defined as (Fe2+/Mg)ol/(Fe/Mg)melt and the T-MgO-KD-logfO2 relationships from their
543
study, we adjusted the KD values at each step of olivine addition. Because KD defined in this
544
way using bulk Fe in the melt is dependent on the oxygen fugacity, two different redox 545
conditions were considered, FMQ = +0.9 and FMQ = 0.0. The former choice is based on 546
the observed V partitioning between olivine and melt in the Kevitsa komatiites (Nicklas et al., 547
2019) and the latter on the composition of chrome spinel (Fe3+/(Fe3++Al+Cr) = 0.06). The KD
548
values were varied between 0.28–0.26 and 0.29–0.27 in these two cases, respectively, and the 549
required additions of olivine were 34 and 40%. 550
The two resulting major element compositions of the emplaced komatiite melt are similar, 551
with the most important difference being the MgO content. The more oxidized conditions 552
yielded an MgO content of 25.2 wt.%, while the FMQ buffer conditions gave an MgO content 553
1 2 3 4 5 6 7 8 9 10 11 12 13 14 15 16 17 18 19 20 21 22 23 24 25 26 27 28 29 30 31 32 33 34 35 36 37 38 39 40 41 42 43 44 45 46 47 48 49 50 51 52 53 54 55 56 57 58 59 60 61
of 26.3 wt.%. These estimates are identical, within the uncertainties, to those obtained by 554
Nicklas et al. (2019) using an independent technique, and corroborate the komatiitic 555
composition of the emplaced Kevitsa komatiite magma. The results indicate that the parental 556
magmas to the Kevitsa, and, therefore, also Jeesiörova, komatiites approached those of their 557
late Archean counterparts from the Abitibi and Belingwe greenstone belts (Puchtel et al., 558
2009b) in terms of MgO content, and, therefore, their liquidus temperatures. 559
560
6.2. Lithophile trace element and isotope systematics of the komatiites
561
The Jeesiörova and Kevitsa komatiites have low (La/Sm)N (0.347±0.022 and 0.264±0.002,
562
respectively), and high positive initial Nd and Hf (+3.7±0.3 and +8.7±0.3, respectively), 563
indicating derivation from a mantle source that was strongly depleted in highly incompatible, 564
lithophile trace elements. These komatiites are ~2.5 times more strongly depleted in the light 565
REE than, e.g., modern N-MORB (average (La/Sm)N = 0.654: Hofmann, 1988). Yet, the
566
lavas are also characterized by enrichments in Th, U, and W relative to Nb, an element with 567
similar incompatibility during melting of spinel peridotite ((Nb/Th)N = 0.583±0.011), and a
568
negative Nb anomaly (Nb/Nb* = 0.582±0.010, where Nb/Nb* = NbN/√(ThN*LaN)). This is
569
most likely indicative of minor, yet significant crustal contamination. 570
Upper crustal rocks are generally characterized by low (Nb/Th)N and (Nb/La)N ratios and,
571
as a result, display pronounced negative Nb anomalies relative to the elements with similar 572
incompatibility during mantle melting (Th and La) on BSE-normalized trace element 573
diagrams, i.e., their Nb/Nb* <<1.0 (Rudnick and Fountain, 1995; Rudnick and Gao, 2014). 574
By contrast, primary uncontaminated komatiitic magmas commonly do not show a Nb 575
anomaly, i.e., their Nb/Nb* = 1.00 (Jochum et al., 1991; Puchtel et al., 1998). Jochum et al. 576
(1991) noted that the elements most sensitive to crustal contamination in komatiite magmas 577
include Th, U, and light REE and, to a lesser extent, Nb. As a result, the Nb/Nb* ratio can be 578
utilized as a measure of the degree of crustal contamination and, when applied in combination 579
with the lithophile element isotopic systems, to discriminate between contaminated and 580
uncontaminated lavas. Based on these observations, it is likely that the original Jeesiörova-581
Kevitsa komatiite magma was contaminated with upper crustal rocks of the Fennoscandian 582
Shield en route to the surface. 583
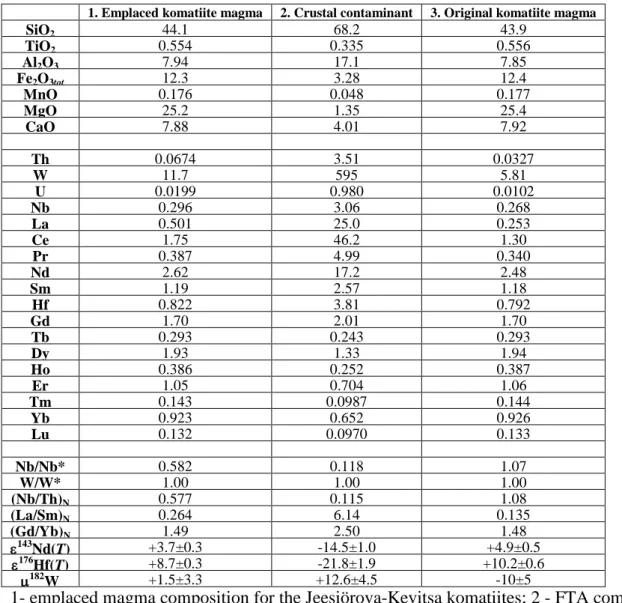
In order to test this hypothesis and calculate the major and trace element and Nd, Hf, and 584
W isotopic compositions of the original Jeesiörova-Kevitsa komatiite magma, we performed 585
model mixing calculations, the results of which are presented in Table 8. For the crustal 586
contaminant endmember, we assumed an average composition of the Vodla Block tonalitic 587
1 2 3 4 5 6 7 8 9 10 11 12 13 14 15 16 17 18 19 20 21 22 23 24 25 26 27 28 29 30 31 32 33 34 35 36 37 38 39 40 41 42 43 44 45 46 47 48 49 50 51 52 53 54 55 56 57 58 59 60 61
gneisses that are the dominant upper crustal rock type within the adjacent Karelian granite-588
greenstone terrane (Puchtel et al., 2016b). These Karelian tonalites are similar in age and 589
major- and trace element composition to their counterparts from Finnish Lapland (e.g., 590
Huhma et al., 2012), but, unlike the latter, have been better characterized in terms of the 591
isotopic systematics of interest (Table 8). This average tonalite composition from Puchtel et 592
al. (2016b) is henceforth referred to as the Fennoscandian Tonalite Average (FTA). In order 593
to calculate the degree of contamination and the trace element abundances and Nd and Hf 594
isotopic compositions of the original, uncontaminated Jeesiörova-Kevitsa komatiite magma, 595
we assumed that it had a Nb/Nb* = 1.00. Calculations show that to produce the emplaced 596
Jeesiörova-Kevitsa komatiite magma with Nb/Nb* = 0.582, the original komatiite magma had 597
to be mixed with ~1% of the average FTA (Nb/Nb* = 0.118). 598
Using 1% contamination and the Nd and Hf abundances and initial Nd and Hf isotopic 599
compositions of the FTA calculated at the time of the Kevitsa komatiite magma emplacement, 600
the original Kevitsa komatiite magma and, thus, its source is calculated to have had initial 601
Nd and Hf values of +4.9 and +10.2, respectively. 602
On the Nd versus Hf evolution diagram in Fig. 9c, the calculated datum for the 603
Jeesiörova-Kevitsa komatiite source plots within uncertainty of the terrestrial evolution curve 604
of Blichert-Toft and Puchtel (2010). This indicates coupled, or congruent, behavior of the two 605
isotope systems in the source of the original komatiite magma. It appears, therefore, that the 606
Nd-Hf isotope decoupling observed in the Jeesiörova-Kevitsa emplaced komatiite magma was 607
caused by contamination with the older tonalitic crust that had isotopically evolved away 608
from the terrestrial evolution curve by the time it was mixed with the original komatiite 609
magma (Table 8). The datum for the Jeesiörova-Kevitsa komatiite source also plots near the 610
Depleted MORB Mantle (DMM) value of Goldstein and Jacobsen (1988) at 2049 Ma (Fig. 611
9c), indicating derivation from a mantle source that was already as long-term depleted in
612
incompatible lithophile trace elements as DMM at 2.05 Ga. 613
614
6.3. Osmium isotope - HSE systematics of the Jeesiörova-Kevitsa komatiite source
615
Although the Os isotopic compositions and absolute and relative HSE abundances in the 616
mantle sources of early and late Archean komatiites have been the subject of numerous 617
studies over nearly four decades (e.g., Brügmann et al., 1987; Walker et al., 1988; Foster et 618
al., 1996; Gangopadhyay and Walker, 2003; Puchtel et al., 2009a; 2014, 2016b; Maier et al., 619
2009), studies of post-Archean komatiites have been rare, in part because the number of 620
Proterozoic and younger komatiites is far more limited. 621
1 2 3 4 5 6 7 8 9 10 11 12 13 14 15 16 17 18 19 20 21 22 23 24 25 26 27 28 29 30 31 32 33 34 35 36 37 38 39 40 41 42 43 44 45 46 47 48 49 50 51 52 53 54 55 56 57 58 59 60 61
In order to characterize the HSE present in the Paleoproterozoic mantle source of the 622
Jeesiörova-Kevitsa komatiites, the effects of crustal contamination must first be evaluated. 623
We again use the average FTA composition from Puchtel et al. (2016b) to assess the effects 624
of 1% contamination of the original Jeesiörova-Kevitsa komatiite magma on its Os isotopic 625
composition and HSE abundances. Because of the very low concentrations of these elements 626
in the FTA, the effects are negligible. Contamination of this magnitude would have increased 627
186
Os and 187Os values by only 0.004 (based on the calculated 186Os/188Os = 0.1198767 at 628
2.05 Ga for the FTA assuming its derivation from a BSE-type mafic source at 3.2 Ga, per 629
Puchtel et al., 2016b) and 0.01 (based on the calculated 187Os/188Os = 1.2091 at 2.05 Ga for 630
the FTA assuming its derivation from a BSE-type mafic source at 3.2 Ga, per Puchtel et al., 631
2016b) units, respectively, which are well within the uncertainties of the current estimates for 632
these values. Similarly, effects on absolute HSE abundances would have been <<1%. 633
Estimation of the HSE abundances in the mantle source of the Jeesiörova-Kevitsa 634
komatiites is achieved by the bootstrap method of Puchtel et al. (2004b) that sequentially 635
combines Os isotopic and HSE concentration data. First, we used the initial 187Os/188Os and 636
186
Os/188Os ratios calculated for the Jeesiörova-Kevitsa komatiites to estimate the time-637
integrated evolution of Re/Os and Pt/Os in their mantle source. In order to place minimum 638
constraints on these long-term source ratios, we calculated the parent/daughter elemental 639
ratios necessary to arrive at the Os isotopic composition at 2049 Ma by assuming generation 640
of this mantle domain soon after Solar System formation. It is estimated that this source 641
evolved from an early Solar System 187Os/188Os = 0.09517 at 4567 Ma (Archer et al., 2014) to 642
the initial 187Os/188Os = 0.11285±23 at 2049 Ma with 187Re/188Os = 0.397±5. This ratio is well 643
within the range of bulk chondritic meteorites. Using the early Solar System 186Os/188Os = 644
0.1198269 at 4567 Ma (Brandon et al., 2006) requires a source with a 190Pt/188Os = 0.00269±8 645
to have evolved to its 186Os/188Os = 0.1198369±3 at 2049 Ma. In contrast to Re/Os, the 646
required minimum 190Pt/188Os ratio is ~50% higher than the average 190Pt/188Os = 0.00180±17 647
(2SD) in bulk chondritic meteorites (as compiled from the data of Horan et al. (2003), 648
Brandon et al. (2005, 2006), Fischer-Gödde et al. (2010), and van Acken et al. (2011)). 649
The calculated initial 187Os of the Jeesiörova-Kevitsa komatiite source is also within the 650
range of those for the majority of Archean and Paleoproterozoic komatiite sources, which 651
were characterized by initial 187Os values between −0.1 and +1.3, also well within the range 652
of 95% of chondritic meteorites (Fig. 10a). The 186Os/188Os isotope data available for 653
Archean and Paleoproterozoic komatiite sources indicate that mantle sources of the 2.7 Ga 654