Publisher’s version / Version de l'éditeur:
Proceedings of SPIE, 8085, 2011
READ THESE TERMS AND CONDITIONS CAREFULLY BEFORE USING THIS WEBSITE. https://nrc-publications.canada.ca/eng/copyright
Vous avez des questions? Nous pouvons vous aider. Pour communiquer directement avec un auteur, consultez la première page de la revue dans laquelle son article a été publié afin de trouver ses coordonnées. Si vous n’arrivez pas à les repérer, communiquez avec nous à [email protected].
Questions? Contact the NRC Publications Archive team at
[email protected]. If you wish to email the authors directly, please see the first page of the publication for their contact information.
NRC Publications Archive
Archives des publications du CNRC
This publication could be one of several versions: author’s original, accepted manuscript or the publisher’s version. / La version de cette publication peut être l’une des suivantes : la version prépublication de l’auteur, la version acceptée du manuscrit ou la version de l’éditeur.
Access and use of this website and the material on it are subject to the Terms and Conditions set forth at
Artefacts for surface measurement
Robson, Stuart; Beraldin, Angelo; Brownhill, Andrew; MacDonald, Lindsay
https://publications-cnrc.canada.ca/fra/droits
L’accès à ce site Web et l’utilisation de son contenu sont assujettis aux conditions présentées dans le site
LISEZ CES CONDITIONS ATTENTIVEMENT AVANT D’UTILISER CE SITE WEB.
NRC Publications Record / Notice d'Archives des publications de CNRC:
https://nrc-publications.canada.ca/eng/view/object/?id=9e97cfa8-2580-442d-b8ce-641f63cb0943
https://publications-cnrc.canada.ca/fra/voir/objet/?id=9e97cfa8-2580-442d-b8ce-641f63cb0943
ARTEFACTS FOR OPTICAL SURFACE MEASUREMENT
Stuart Robson1, Angelo Beraldin2, Andrew Brownhill1 and Lindsay MacDonald11
Department of Civil, Environmental and Geomatic Engineering, UCL 2
Institute for Information Technology, National Research Council, Canada
Commission V, WG V/1 KEY WORDS: Metrology, Artefacts, Freeform Measurement, Best Practice
ABSTRACT:
Flexible manufacturing technologies are supporting the routine production of components with freeform surfaces in a wide variety of materials and surface finishes. Such surfaces may be exploited for both aesthetic and performance criteria for a wide range of industries, for example automotive, aircraft, small consumer goods and medial components. In order to ensure conformance between manufactured part and digital design it is necessary to understand, validate and promote best practice of the available measurement technologies. Similar, but currently less quantifiable, measurement requirements also exist in heritage, museum and fine art recording where objects can be individually hand crafted to extremely fine levels of detail.
Optical 3D measurement systems designed for close range applications are typified by one or more illumination sources projecting a spot, line or structured light pattern onto a surface or surfaces of interest. Reflections from the projected light are detected in one or more imaging devices and measurements made concerning the location, intensity and optionally colour of the image. Coordinates of locations on the surface may be computed either directly from an understanding of the illumination and imaging geometry or indirectly through analysis of the spatial frequencies of the projected pattern. Regardless of sensing configuration some independent means is necessary to ensure that measurement capability will meet the requirements of a given level of object recording and is consistent for variations in surface properties and structure.
As technologies mature, guidelines for best practice are emerging, most prominent at the current time being the German VDI/VDE 2634 and ISO/DIS 10360-8 guidelines. This considers state of the art capabilities for independent validation of optical non-contact measurement systems suited to the close range measurement of tabletop sized manufactured or crafted objects and invites ISPRS participants to become involved with a WG V/1 workplan to explore artefact performance and suitability.
1. METROLOGY AND ARTEFACTS
1.1 The need for artefacts
Optical 3D measurement systems designed for the close range measurement of surfaces deploy one or more illumination sources to project a spot, line or structured light pattern onto the surface of interest. In order to make a measurement reflections from the projected light must be detected in one or more imaging devices. When targets are used, such as in laser tracking and some forms of photogrammetry the optical properties of the surface being measured does not need to be considered. For broader capability it is desirable to measure surfaces directly by analysing the reflected light which implies that the optical characteristics of the surface are either close to lambertian or well undestood to the extent that they can be mathematically modelled. Unfortunately there is currently no general case solution which is applicable to even commonly found surfaces. Whether a given system is fit for purpose can only be fully ascertained by testing on representative surfaces. Where accuracy is of paramount importance it is generally necessary to understand the geometric form of the test surface, ideally to an order of magnitude better than the desired measurement capability.
1.2 Guidelines
Research into the performance of non-contact metrology equipment has been performed by a variety of workers. In the UK, NPL (Rodger et al., 2007) summarise current capabilities, available standards and verification artefacts (Figure 1a) noting that the usage and complexity of non-contact measurement systems in industry is increasing yet ISO specific guidelines are not yet available and that verification tests and artefacts are required. In partial response NPL has set up the National Freeform Measurement Centre which aims to support users and provide evaluation and traceability, standards and best practice (NPL, 2009). Similarly in Canada, NRC, (Beraldin et al., 2007)
note that no internationally-accepted standards currently exist for the evaluation of data collected using non-contact dimensional metrology equipment. In the USA the American Society for Testing and Materials (ASTM) formed committee E57 in 2006 to focus on issues related to 3D imaging systems. Terminology and safety guidelines have been published whilst further work is in progress (ASTM, 2010).
Figure 1 NPL example artefacts (Rodger et al., 2007), a VDI/VDE 2634 Part 2/3 artefact (GOM, 2007).
The most applicable work is the VDI/VDE 2634 Part 3 guideline (Association of German Engineers (VDI), 2008) dealing with multiple view measurement systems based on area-scanning. Even this quideline assumes a surface with properties that are independent from the measurements made. Figure 1b gives an example of an artefact designed to perform a validation that a particular manufacturer‟s equipment is performing to the Guideline. Conformance under Part 3 describes probing error, sphere spacing error and length measurement error.
Whilst Part 3 provides the framework for measurement systems to be compared using a standard set of tests with directly comparable results, these results cannot be used as an indication of performance outside the given tests. More generally it is likely that a single set of tests will not provide suitable information for all projects and that project specific tests will be needed to fully explore surface features with a desired material and finish. This is especially true where freeform surfaces, those
without an underlying geometric surface description, and local detail such as edges and gaps are to be measured.
1.3 Freeform surfaces
The body of work relating to the assessment of non-contact freeform measurement equipment has increased in the last decade in-line with greater use of the technologies. The reader is directed towards a thorough review of industrial freeform metrology by Savio et al. (2007). In addition to covering a range of data collection technologies the work presents freeform test artefacts such as that in Figure 2a. A limiting factor to the use of artefacts is identified as “the relatively high calibration uncertainty and manufacturing costs”. NPL have recently produced a series of artefacts (Figure 2b) which are based on a geometric shapes combined in such a way as to provide a pseudo freeform surface. The use of known geometric surfaces allows a spherical CMM probe to be used to calibrate the artefacts since the point of contact between the surface and the sphere can be readily calculated. These artefacts have been measured with a range of metrology equipment.
Figure 2 (a) General purpose freeform artefact: "Doppelsinusfläche" (Savio et al., 2007) (b) NPL freeform reference (300 mm) (NPL, 2009).
Further examples of artefacts can be found in Van Gestel et al. (2009) who present possible designs for test artefacts for the evaluation of laser line scanners and perform tests using a CMM mounted laser line scanner and flat plate. Luhmann et al. (2008) who have developed a compound curve shaped artefact suited the comparison and verification of deformation measurements.
1.4 Data processing
The design and production of an artefact is only the first stage. As well as measuring the surface it is necessary to evaluate if and how the measurements made differ from the shape. One of the most common methods of evaluation is to exploit the simplicity of planar surfaces by evaluating local plane fits to small discrete surface elements. One recent example from Van Gestel et al. (2009) uses least squares best fit planes, the standard deviation of each being used to assess the random error for the position in which the data were collected. Systematic error is determined against the overall change in position to a reference plane. The parameters used by Van Gestel et al. (2009) to evaluate point cloud quality are a subset of those defined by Lartigue et al. (2002), the four parameters they define are: noise, density, completeness and accuracy. Where errors of a data set compared to a model follow a Gaussian distribution the standard deviation can be taken as an indication of the digitising noise in the data. The density value can be obtained from division of the measurement volume into small cuboids related to the digitising step of the collection device; the method follows one defined by Hoppe et al. (1992). The completeness of a point set is linked to the noise and density values as the gap between two neighbouring points is not a gap unless it is greater than a given threshold, that threshold is defined as an area equal to the density e.g. if the density value is 0.5mm, the completeness threshold would be 0.5mm2. The
accuracy evaluation is used to determine areas of a sensor which yield worse results than other areas, the authors note that for inspection purposes measurements collected from a certain area of the sensor could be excluded or a strategy adopted where data are only collected from the most accurate sensing areas. Although not using custom test artefacts, the work of Teutsch et al. (2005) has used a number of test objects in order to evaluate collected data from laser scanning. The authors developed a method for calculating a quality value for each point in a cloud by analysing the 2D image collected, assessing the thickness of the imaged laser line and contrast values. In 3D space, analysis of the surface normal at each point and comparison to the imaging geometry is performed. The process generates b-spline curves for each scanline where the distribution of points is determined by the previously calculated quality values. The approach removes high frequency noise caused by reflections and reduces the overall number of points in the final cloud by an average of 60%, the authors‟ claim this is achieved without appreciable loss of information.
For complex surfaces, such as those found in the freeform case it is more typical to conduct comparative measurements between a device such as a CMM and the optical instrument under test. Whilst determining the point of contact for a CMM is unreliable for true freeform surfaces, the use of geometrically described sub-components such as those in the NPL freeform reference enable a meaningful comparison to be made. The reader is referred to a review paper by Li and Gu (2004) for a variety of inspection methods.
2. ILLUSTRATIVE EXAMPLES
Whilst it is clear that as yet there is no general case set of tests available to characterise optical freeform surface measurement, the following examples taken from the author‟s recent activities highlight key issues from several current projects.
2.1 EFDA-JET – protective tile characterisation
The first example is taken from a three year assessment of the capability of state of the art optical systems to inspect the steps, gaps and surface form of engineered tiles within an experimental fusion facility. In this case several artefacts (Figure 3) have been designed and manufactured in aluminium with a surface finish as close as possible to the surface of the engineered tiles. Artefacts include steps, gaps and angled planes and are in use to evaluate the performance of a range of different laser line and fringe projection systems that could be deployed for inspection purposes.
Figure 3, Purpose designed artefacts for the UK Atomic Energy Authority testing programme.
Figures 4 and 5 show some representative results of analysis of measurments made with two fringe and two laser line systems. Figure 4 shows a variety of profiles extracted from ASCII point cloud data produced by each system when used to image a 1mm high step. It is clear from the presented graphics that not only are the capabilities of each system different, but that there is also variation within data from each system. Variations depend not only on the physical orientation of the sensing system to the step but also surface reflections, interpolation and filtering built into each system.
Figure 5 shows data collected from the artefact shown in the lower part of Figure 3 where planes have been fitted to each facet of the artefact using only use the central portion of each plane to avoid edge effects. The parallel black bars in the figure denote the direction of the laser lines and fringes of the systems used. RMS residuals of 13-43µm are calculated when data are compared to as-built data obtained from CMM. Data have also been calculated and colour coded according to <3, <5 and >5 standard deviations from the best fit plane of each facet to expose local variations. In last three cases it is evident that sinusoidal patterns are present in the collected data. These patterns are attributable to surface properties and illumination / viewing angles in the case of the fringe system and dominated by the 6 Degrees of Freedom (DoF) tracking capabilities in the laser line scanner cases.
Figure 4, Examples of data sets captured with four different state of the art optical metrology systems against a 1mm step.
Figure 5, Example data captured with the same four metrology systems against discrete planar regions of an angular artefact. Work carried out with these artefacts is succesfully informing the design of tile inspection procedures that will be used for future EFDA-JET operation.
2.2 Artefact related developments at NRC
NRC has recently established a laboratory dedicated to 3D imaging and modelling metrology where amongst other things the development and the evaluation of independently-verifiable metrics and methodologies have started. One sub-project is concerned with artefacts-based acceptance and reverification tests of optical 3D imaging systems. The goal of this sub-project is to 'quantify' the spatial accuracy of short to medium-range 3D optical imaging systems such that users and product developers can 1) Verify the applicability of a given system to the task at hand (fit-for purpose), 2) Compare different instruments using fair and appropriate methodologies and
metrics, 3) Manage instrument warranty issues, and, 4) Reduce costs through effective use of 3D imaging systems (Beraldin et al., 2007).
2.2.1 Core technologies for optical 3D imaging
Figure 6 summarizes the typical depth measurement noise values for each class of optical digitizer technology as a function of the desired depth of field (DOF). The noise figure is an important caracteristic amongst other ones that allow us to define the tolerances for the design and manufacture of artefacts. This artefact needs to match the characteristics of a particular system. 3D artefacts designed for a particular 3D optical digitizer technology may not be suited for another.
Figure 6. Typical noise level in measured depth as a function of depth of field (DOF) for different optical 3D digitizing methods.
2.2.2 Verification tests and properties of artefacts
Artefacts (reference materials) used to evaluate 3D digitizers must have a cooperative (diffusely reflecting) surface, at least for the simplest tests. The light should reflect from the first surface with a minimum of volumetric scattering or specular reflection. Ideally, the reflected light should be similar to light reflected by a Lambertian surface. Metallic surfaces are sometimes treated to make them diffusely reflecting by increasing their surface roughness (parameter Ra around 1m is typical). Some surface treatments, like vapour blasting, light particle blasting, or spray particle coating, are able to change a specular surface into a diffusely-reflecting surface.
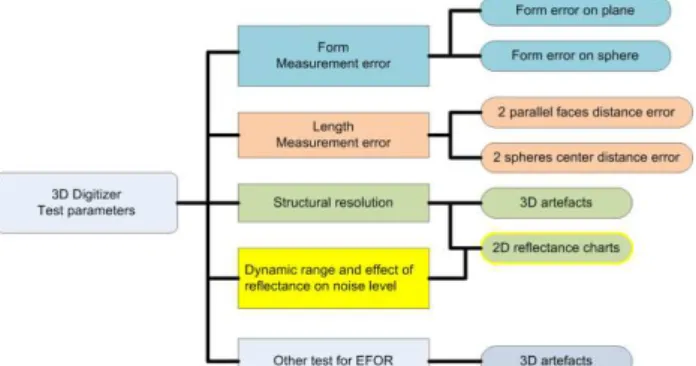
Figure 7: Proposed 3D digitizer test parameters with a list of artefacts.
The form characteristics of the artefact should be known to an uncertainty much smaller than the uncertainty associated with measurement results obtained by the 3D digitizer. Form characteristics are obtained by comparing measurement results obtained from the 3D digitizer under test to an artefact. The artefact must either be accompanied by a certification document indicating the uncertainty associated with the form characteristics, or the form characteristics uncertainty must be
obtained using a certified reference method. It is commonly accepted that the uncertainty value on the form certification for the artefact should be 4 or more times smaller than the measurement uncertainty of the 3D digitizer. Figure 7 lists the different tests and artefacts that are used at NRC Canada. Many of the proposed tests use artefacts available in most dimensional metrology laboratories. These artefacts consist of flat surfaces, gauge blocks and ball bars. The proposed test methods are similar to those already adopted for some categories of scanners (VDI/VDE 2634 and VDI/VDE 2617 in Germany), or are currently under development (ISO 10360-8, ASTM E57). We now present some test parameters.
2.2.3 Form Measurement Error
A. Form error on a plane
To quantify how well a 3D digitizer is able to measure flatness within the measurement volume (DOF), a flat plate is scanned at various combinations of distances and angles. The flat plate can be a machined or lapped plate, a 1-2-3 steel block, a 4-ways parallel block, an optical flat or any flat surface that is certified as having a better flatness characteristic than the digitizer is capable of measuring (see Figure 8a). Ideally, the plate should completely cover the field-of-view (FOV) of the digitizer. B. Form error on a sphere
As an alternative to the plane form error test, a sphere with certified form and diameter values, large enough to cover a significant portion of the field of view, is scanned (see Figure 8b) in various positions within the DOF.
C. Data processing
For each of these scans, a best-fit minimizing orthogonal deviations is generated and the standard error of the estimate (SEE) is calculated. The method used to remove outliers, if any, and the number of outliers removed prior to fitting must be clearly documented. The form error is then estimated from the SEE. For instance, four or six times the SEE can be computed. Furthermore, a colour-coded display can reveal distortions that sometimes remain after the 3D digitizer has been calibrated.
2.2.4 Length Measurement Error
A. Two spheres center distance error
The accuracy of a 3D digitizer is evaluated using a two spheres centers distance test using a ball bar, or simply two spheres that are at a fixed and calibrated distance from each other (see Figure 8c). The separation between the two spheres should be less than the size of the FOV of the digitizer, and the spheres should be scanned at three distances from the digitizer. Three more scans are performed with the vector between the two spheres‟ centers oriented along the principal axis of the measurement volume. For each data set, a best-fit sphere with fixed radius (using the calibrated value) minimizing radial deviations is generated for each sphere. The distance between the two centers is measured and the difference from the calibrated value is calculated. The largest difference from all data sets represents the uncertainty on distance error. This value is sometimes added to SEE of the form error on a sphere to compensate for the fact that errors from all directions are averaged when fitting data to a sphere. The method used to remove outliers, if any, and the number of outliers removed prior to fitting must be clearly documented.
B. Two parallel faces distance error
An alternative to finding the distance error between spheres is to evaluate the distances between two parallel flat surfaces like the two faces of a gauge block (see Figure 9c). Between eight and ten blocks of different lengths are aligned side by side, separated from each other on a flat reference surface. These blocks are then scanned from the top. A plane is best-fit that
minimizes orthogonal deviations is generated for each face and the reference surface beside the blocks. Each distance between the individual planes and the reference plane is measured and the distances are compared with the calibrated height values of the gauge blocks. The maximum deviation represents the length measurement error on gauge blocks. The 8 to 10 blocks should cover most of the DOF of the 3D digitizer.
2.2.5 Structural Resolution Limit
The ability to distinguish two objects or features from each other is fundamental in 3D metrology. This is often called the structural resolution limit of detection. It corresponds to the response time or to the bandwidth of a 3D digitizer, and its ability to react to a sudden change in depth. Several artefacts can be used to perform this test; however, a simple test uses a step height object consisting of two surfaces separated by a known height. If both faces are measured within the same scan, the lateral distance required to transition from one surface to the other is measured. A finite lateral distance is required to completely transition between two surfaces. During this transition the beam footprint is divided between the surfaces so the depth measurement result within the transition region is ambiguous. The lateral resolution quantifies the width of this transition region. There is currently no convention to evaluate the response time in distance so we use the distance in the scanning direction required for the measured height to go from 10% to 90% of the calibrated height, what is referred to as the 10-90% rise time in electronics. The distance between these two values corresponds to the structural resolution limit of the digitizer. A series of step heights along the scanning axis may be used to find the limit at various locations in the field of view. Examples of measurements on a 1 mm step edge are given in figure 9.
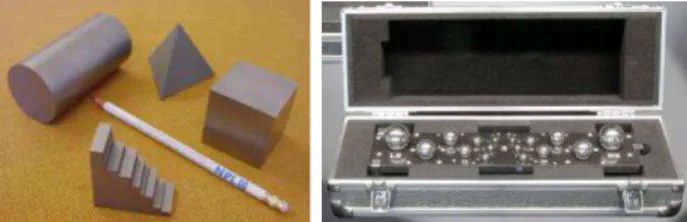
Figure 8. Artefacts proposed to measure form measurement error: a)vapour blasted steel and float glass with coating b) steel spheres and billiard balls, c) Artefacts to evaluate length measurement error: two ball bars,
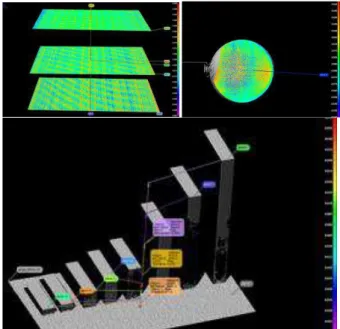
Figure 9. Data analysis: a) Colour coded deviations from planes, b) Colour coded deviations from a sphere, c) Length measurements of gauge blocks.
2.3 Characterisation of spatial resolution and colour recording of a three laser triangulation scanner
Whilst many engineering needs require only geometry, there can be a need, particularly in Heritage Recording to collect colour information. In such cases significant work has been carried out in the photographic and graphics industries using calibrated planar targets incorporating colour patches and cyclic high-contrast stripe patterns, as shown in Figure 10. The latter provides a very effective means of characterising the ability of a digitizer to resolve spatial detail through the „slanted frequency response‟ technique (Burns, 2000), expressed by the device‟s modulation transfer function (MTF) as shown in Figure 11.
Figure 10. Scanned images of colour and spatial resolution charts collected with a three laser colour scanner.
On-going work at UCL seeks to quantify sensor resolution and colour recording capability in two contrasting technologies. The first is a three colour laser scanning system based on laser triangulation but with Red, Green and Blue lasers to record colour response simultaneously with geometry. The second is a digital colour camera mounted in a fixed position relative to the object, recording a series of images illuminated from different coordinate positions in the surrounding hemisphere. Comparison of the images enables the surface normal to be computed at each point and hence a 3D surface to be derived by a suitable „shape from shading‟ algorithm. The advantages of the digital camera are its inherently higher spatial resolution (with a suitable lens) and greater dynamic range. Thus by employing techniques from other disciplines combined with geometric artefacts a wider understanding of system capabilities is obtained. In this case data collection is based on a MacBeth Color Checker chart and an ISO 16067-1 standard, supplied as a photographic test target QA-61 by Applied Image Inc.
Figure 11. Spatial frequency response from the red, green and blue colour channels of a three colour scanner for horizontal (left) and vertical (right) directions.
Analysis of this nature is able to quantify effects such as jitter in sampling positions along a laser scan line, aliasing due to sensor response at spatial frequencies above the Nyquist limit and any misregistration of the colour channels. The reader is directed to MacDonald and Robson (2010) for a detailed study.
3. FACTORS TO BE CONSIDERED WHEN
SPECIFYING AN ARTEFACT
The following series of considerations has been developed through recent work at UCL during a number of industrial collaborations. Whilst not exhaustive it has been found to provide an excellent starting basis when considering the desired capabilites of an artefact.
3.1 What are the purposes of the artefact?
For example instrument comparison; periodic inspection and conformance of measurement systems or metrology enabled production.
What features (manufactured detail) need to be included on the artefact?
How accurate do the features need to be are combinations of features important (e.g. steps and gaps, complex structures?)
3.2 Optical properties of the surfaces to be measured
Optical surface finish - consider microscopic level (local detail) and macro level (consistency of finish over surface) Different optical systems have differing imaging geometries
which will highlight specific surface characteristics and may require different angles and ranges between the part and the optical system for optimum measurement performance. Is the surface opaque to the imaging wavelength(s)?
Consider any surface finish differences in manufacturing processes e.g. at edges, joins and consistency over large surfaces.
Contact measures of surface finish may not be representative of optical methods.
3.3 Local geometric detail
What level of geometric detail is of interest?
Consider spatial resolution and geometric complexity of individual features e.g minimum steps, gaps, required curvatures
Map local detail to spatial resolution of imaging system and processing software, particularly edges and steps
Can one artefact cover all eventualities?
3.4 Surrounding geometric complexity
What combinations of structures need to be considered? Geometry will have particular impact on sensor illumination
and imaging geometries
Consider local shadowing, single and multiple reflections
3.5 Metric nature of the artefact
Does the artefact require traceability?
Over what period of time should the artefact be regarded as dimensionally stable?
Is absolute location / orientation between individual features on the artefact important?
How will the metric properties of artefact features be quantified?
Consider geometric registration of repeated measurements of the same artefact - are additional features required?
Does the temperature of the artefact and its environment need to be monitored?
What systems can be used for independent evaluation?
3.6 Construction material and Portability
Use same material and finish as the production component or is an approximation required - consider surface finish, durability, mechanical stability, weight...?
Will the surface finish of differently manufactured artefact components be consistent with production?
Should the artefact come apart (e.g for direct measurement of individual components?)
Should the artefact be re-mountable in known locations within a production or laboratory space?
Will the artefact be transported?
Where will the artefact be stored, is a consistent environment required?
Consider dimensions, weight, fragility, stability, portability, storage boxes and transportation logistics.
4. AN INVITATION
This paper has presented several examples of the use of artefacts to quantify the capabilities of surface measurement systems. The field is rapidly evolving and as it does so exposes new research challenges to metrology, particularly in terms of our capability to understand and model the interaction between optical systems and both manufactured and natural surfaces. ISPRS WG V/1 is making available a series of data sets that have been carefully extracted from artefact surfaces using a wide variety of non-contact optical systems so that as wide a community as possible can study the data produced and exchange ideas on how the patterns present in the data can be automatically extracted and above all quantified. If you would like to take part in this community please contact the authors at the email address given at the top of this paper.
5. REFERENCES
Beraldin, J., Blais, F., El-Hakim, S., Cournoyer, S., Picard, M. (2007). Traceable 3D Imaging Metrology: Evaluation Of 3D Digitizing Techniques In A Dedicated Metrology Laboratory. Proceedings of the Eighth Conference on Optical 3-D Measurement Techniques. Zurich, Switzerland, 2007. Burns, P.D. (2000). Slanted-Edge MTF for Digital Camera and Scanner Analysis, In Proceedings of the IS&T Conference on Image Processing, Image Quality, Image Capture, and Systems (PICS), Portland, Oregon, 2000. 135-138.
GOM (2007), Verifying the ATOS System according to VDI/VDE 2634. GOM mbH, Mittelweg 7-8 D-38106
Braunschweig, Germany (ATOS VDI Acceptance English Rev A 30th July 2007).
Hoppe, H., DeRose, T., Duchamp, T., McDonald, J., Stuetzl, W. (1992). Surface Reconstruction from Unorganized Points. Proceedings of the 19th Annual Conference on Computer Graphics and Interactive Techniques (SIGGRAPH 92). Chicago, USA, 26-31 July 1992. 71-78.
ISO/CD 10360-8 Geometrical Product Specifications (GPS) -- Acceptance and reverification tests for coordinate measuring machines (CMM) -- Part 8: CMMs with optical distance sensors. Under development. http://www.iso.org, last accessed 21 April 2010.
ISO/CD 10360-9 Geometrical product specifications (GPS) -- Acceptance and reverification tests for coordinate measuring
machines (CMM) -- Part 9: CMMs with multiple probing systems. Under development, http://www.iso.org, last accessed 21 April 2010.
Lartigue, C., Contri, A., Bourdet, P. (2002). Digitised Point Quality in Relation with Point Exploitation. Measurement, (32), 193-202.
Li Y., Gu P. (2004). Free-form surface inspection techniques state of the art review. CAD Computer Aided Design, 36 (13), pp. 1395-1417.
Luhmann, T., Bethmann, F., Herd, B., Ohm, J. (2008). Comparison and Verification of Optical 3-D Surface
Measurement Systems. Proceedings of the International Society of Photogrammetry and Remote Sensing XXXVII. Beijing, China,
MacDonald, L., Robson, S. (2010). Polynomial Texture Mapping and 3D Representations. In Proceedings of ISPRS Commission V Mid-Term Symposium: Close Range Image Measurement Techniques, Newcastle, 22-24 June 2010. NPL. (2009). Freeform Surfaces.
www.npl.co.uk/dimensional/freeform Last accessed 08 March 2010.
Rodger, G., Flack, D., McCarthy, M. (2007). A Review of Industrial Capabilities to Measure Free-Form Surfaces. National Physical Laboratory.
http://publications.npl.co.uk/npl_web/pdf/depc_em14.pdf last accessed 21 April 2010.
Savio, E., De Chiffre, L., Schmitt, R. (2007). Metrology of Freeform Shaped Parts. CIRP Annals - Manufacturing Technology, 56(2), 810-35.
Teutsch, C., Isenberg, T., Trostmann, E., Weber, M., Berndt, D., Strothotte, T. (2005). Evaluation and Correction of Laser-Scanned Point Clouds. In Proc. of Videometrics VIII, SPIE, 5665.
Tuominen, V., Niini, I. (2008). Verification of the Accuracy of a Real-Time Optical 3D-Measuring System on Production Line. In The International Archives of the Photogrammetry, Remote Sensing and Spatial Information Sciences. Beijing, China, 2008. International Society for Photogrammetry and Remote Sensing. Van Gestel, N., Cuypers, S., Bleys, P., Kruth, J. (2009). A performance evaluation test for laser line scanners on CMMs. Optics and Lasers in Engineering (47), 336-342.
Van Gestel, N., Welkenhuyzen, F., Bleys, P., Kruth, J. (2009). Evaluation of Measurement Uncertainty Contributors for Vision CMMs. Proceedings of the 4th International Conference on Optical Measurement Techniques for Structures. Antwerp, Belgium, 25-26 May 2009.
VDI/VDE 2634 Part 1, Optical 3D measuring systems - Imaging systems with point-by-point probing 2002-05, Verein Deutscher Ingenieure. http://www.vdi.de last accessed 21 April 2010.
VDI/VDE 2634 Part 2, Optical 3D-measuring systems - Optical systems based on area scanning 2002-08, Verein Deutscher Ingenieure. http://www.vdi.de last accessed 21 April 2010. VDI/VDE 2634 Part 3Optical 3D-measuring systems - Multiple view systems based on area scanning 2008-12, Verein
Deutscher Ingenieure. http://www.vdi.de last accessed 21 April 2010.
6. ACKNOWLEDGEMENTS
The authors would like to acknowledge the support of the NPL Freeform centre in providing a controlled environment and CMM measurement assistance. Work with EFDA-JET was supported by EPSRC.