An Analysis of the Potential Economic Impact of Natural Gas
Production in Tanzania
MA StTEMASSACHUSETTS INMTMUTE.
by
OF TECHNOLOGYEkenedilinna Umeike
OCT
201
B.Eng., University of Nigeria Nsukka (2008)
Submitted to the Engineering Systems Division
LIBRARE
and
Department of Electrical Engineering and Computer Science
in partial fulfillment of the requirements for the degrees of
Master of Science in Technology and Policy
and
Master of Science in Electrical Engineering and Computer Science
at the
MASSACHUSETTS INSTITUTE OF TECHNOLOGY
September 2014
Massachusetts Institute of Technology 2014. All Rights Reserved.
Signature redacted
A uth or...
Technology and Policy Program, Engineering Systems Division
Department of Electrical Engineering and Computer Science
Signature redacted
July 7, 2014
Certified by ... ...
Robert
J.
Stoner
Deputy Director InitiativeSignature redacted
Certified by ... ... ... .... ... .... ...
... f Vladimir Bulovic
Professor in Emerging Technology Departm t o Electrical Engineering and Computer Science Thesis Reader
Signature redacted
A ccepted by ... ... ... ...
(
Dava j.
Newman
Professor of Aeronautics and Astronautics and Engineering Systems Director, Technology and Policy Program
Signature redacted
A ccepted by ... . . .. ... L... ... ...
/6/(
Leslie A. Kolodziejski
Professor of Electrical Engineering Chair, Committee on Graduate Students Department of Electrical Engineering and Computer ScienceAn Analysis of the Potential Economic Impact of Natural Gas Production in
Tanzania
by
Ekenedilinna Umeike
Submitted to the Engineering Systems Division
and
Department of Electrical Engineering and Computer Science
on July 7 2014, in partial fulfillment of the requirements for the degrees of Master of Science in Technology and Policy
and
Master of Science in Electrical Engineering and Computer Science
Abstract
Following substantial discoveries of natural gas in recent years, Tanzania has new options for economic development. The country's policy makers are faced with having to make decisions about how best to utilize the gas in order to drive economic development The options before the government are whether to export the gas or to use it domestically. Exporting natural gas can be a very lucrative source of government revenues which can in turn be invested in improving education, access to healthcare or other areas to improve the general and economic well-being of the populace. Encouraging domestic use on the other hand may not be as lucrative in terms of government revenues, but is necessary for increasing participation along the gas value chain in particular and stimulating in other sectors of the economy that benefit from easy access to gas or its downstream products. In this study, I considered the options of using the gas in the production of liquefied natural
gas (LNG) intended for export, as well the domestic manufacture of urea and electricity.
I used a scenario analysis model to investigate and assess these options according to their direct
economic value as well as their revenue generating potential. These two parameters were chosen as proxies for and economic growth and government ability to invest in public goods respectively. As part of the assessments carried out, special attention was paid to the different scenarios associated with meeting the government's national electrification plans as determined by their electricity demand forecasts.
The results show that among the options considered, domestic utilization of the gas for power production will have greatest economic value while LNG exports hold the highest revenue potential. Furthermore, they demonstrate that even though using the natural gas for electricity production would be the most valuable option for the Tanzanian economy per unit of gas, allowing new generating capacity to be dominated by gas plants as has been done in some other gas rich countries would not be economically prudent. Instead a mix of technologies will provide the best balance between stimulating domestic gas consumption and providing cost effective electricity to consumers. Importantly, I find that future policy must ensure that domestic utilization of gas is not sacrificed in favor of exports even if it means reduced government revenues.
Thesis Supervisor: Robert
J.
StonerAcknowledgement
I am grateful to all of the people I have been fortunate enough to meet during my time at MIT. I
will forever treasure and hold fond memories of the past two years. I am particularly indebted to my thesis supervisor Dr. Robert Stoner for the guidance, patience and support that have helped me through to this point A special thanks also to Prof. Channing Arndt and Dr. Kenneth Strzepek for the advice on how to approach the issues explored in this study.
I am grateful to Dr. Stoner and Dr. Melanie Kenderdine for helping me to find a place at the MIT
Energy Initiative to pursue my interests. The opportunity to work and learn in the midst of like-minded and unbelievably supportive people created a wonderful working environment that I will miss.
I would also like to say thank you to my cousin Chidube, who has very kindly and skilfully played
the roles of friend, study partner, and sounding board since we were undergraduates. Thanks also to Ed Ballo and Barbara DeLaBarre from TPP for helping me through administrative challenges, for casual conversation, and for all the kindness shown to me.
Finally, I would like to thank my parents and siblings for not allowing the little matter of an ocean separating us create any distance between us or prevent them from providing the support I have come to count on all of my life.
Contents
1
Introduction ... 151.1 M otivation ... 15
1.2 T rends from O ther Countries ... 16
1.2.1 Q atar ... 17
1.2.2 T rinidad and T obago ... 18
1.2.3 A ngola ... 19
1.2.4 N igeria ... 20
1.3 O rganization ... 21
2 Gas M onetization ... 23
2.1 Liquefied N atural Gas (LN G) ... 23
2.2 U rea Production ... 25
2.3 Electricity Production ... 26
3 T anzania's Electricity Sector ... 29
3.1 O verview of the T anzanian Electricity Sector ... 29
3.2 B ridging Electricity D eficit ... 30
3.2.1 Pow er Generating Technologies ... 31
4 T he M odel ... 33
4.1 Scenario A nalysis M odels ... 33
4.2.1 LN G Exports Sub-m odel... 34
4.2.2 U rea Production Sub-m odel... 38
4.2.3 Electricity Production Sub-m odel... 40
4.3 Shortcom ings of the M odel ... 44
5 Presentation and D iscussion of Results... 45
5.1 Results...45
5.1.1 Revenues ... 45
5.1.2 Value A dded ... 48
5.2 Effects of Global Com petition... 51
5.3 Costs A ssociated w ith Generating Electricity ... 54
5.4 Gas D em and across M onetization O ptions ... 56
6 Policy Recom m endations & Conclusions ... 57
6.1 Sum m ary of Key Findings...57
6.2 Recom m endations... 58
6.3 Future W ork...60
List of Figures
Figure 2-1: Stranded Gas Reserves/High Price Import Markets... 24
Figure 2-2: Typical Gas Monetization Value Chain ... 25
Figure 2-3: The Urea Production Process. Adapted from:... 25
Figure 2-4: Conversion of gas to power ... 26
Figure 3-1: Electrification Rates around Tanzania... 30
Figure 4-1: N atural Gas Price Forecast... 35
Figure 4-2: LN G R evenue Flow s ... 38
Figure 4-3: Fuels for Electricity Generation ... 41
Figure 5-1: Plot of Cumulative Revenues from LNG Export... 46
Figure 5-2: Plot of Cumulative Government Income from Urea... 47
Figure 5-3: Plot of Cumulative Government Income from Electricity... 48
Figure 5-4: Government Revenue across the Monetization Options... 49
Figure 5-5: Value Added per unit volume of gas used... 51
Figure 5-6: Investor Earnings under Mozambican and Tanzanian Fiscal Conditions... 52
Figure 5-7: Estimated Breakeven Gas Prices for Set of Major Contemporary LNG Projects ... 53
Figure 5-8: Selected Costs over the Operational Lives of Power Plants... 55
Figure 5-9: Weighted Average Levelized Costs of Electricity across the Different Electricity S c e n a rio s ... 5 5 Figure 5-10: Gas Consumption in Selected Scenarios... 56
List of Tables
Table 4-1: Summary of Production Sharing Formula... 36
Table 4-2: Selected LNG Exports Sub-model Assumptions ... 38
Table 4-3: Selected Urea Sub-m odel Assum ptions ... 39
Table 4-4: Selected Electricity Production Sub-model Assumptions... 43
List of Acronyms
CCGT - Combined Cycle Gas Turbines
CNG -Compressed Natural Gas
EWURA - Energy and Water Utilities Regulatory Authority
GTL - Gas to Liquids
LCOE - Levelized Cost of Electricity
LNG - liquefied natural gas
MMTPA - Million metric tons per annum
TANESCO - Tanzania Electric Supply Company Tcf - trillion cubic feet
TPDC - Tanzania Petroleum Development Corporation WAGP - West Africa Gas Pipeline
Chapter 1
Introduction
I explore monetization options available to the Tanzanian government as they seek to develop
recently discovered natural gas reserves. My objective is to compare these options quantitatively in terms of revenue generating potential and relative economic value as a guide to policy makers.
My approach is to evaluate export and domestic consumption scenarios by measuring their
revenue generating and value adding potentials. I also specifically focus on the Tanzanian government's plans to increase the domestic electrification rate and the role that natural gas may play in meeting these objectives.
1.1 Motivation
The discovery of large deposits of natural resources creates game changing economic opportunities for any nation. The extent of its impact depends to a large extent on the situation in the country at the time the discovery is made. So if well managed, a low-income country in the midst of a natural resource boom has the potential to record more dramatic changes to the overall standard of living than an already industrialized, high-income counterpart experiencing the same boom. These issues are increasingly relevant in Tanzania where natural
gas discoveries of up to 40tcf have been reported by (Simbakalia 2013). These issues and the factors policy makers need to consider in addressing them are the motivation behind this study.
In deciding how best to utilize a natural resource such as natural gas, the overriding objective of most governments would be to maximize economic benefits to the country. Economic impact from exploiting natural gas may come directly through increased economic activity arising from the domestic utilization of the gas as feedstock in associated downstream industries and as a result of increased activity in other sectors such as agriculture and manufacturing that use the products of these downstream industries. Alternatively, the government may choose to export the gas and influence economic development through the investment of export revenues in social projects such as improved infrastructure and education.
The government must make difficult choices that will have long term consequences for the country's future economy. Broadly speaking the choices are whether to export the gas or use it domestically. Important factors that will influence the government's path are the status of the domestic market, the level of domestic industrialization as well as the level of available know-how (Simbakalia 2013). By adopting value added and revenue generated as metrics for assessing the monetization options, this study lays the ground work for considering these two possible paths for economic impact of the Tanzanian gas.
1.2 Trends from Other Countries
Tanzania is a new entrant to an industry that has existed for over century and though the particular context of its new energy sector are unique, the experiences of other developing countries that have undergone resource booms is instructive. In this section, I briefly examine energy sector development in Qatar, Trinidad and Tobago, Angola and Nigeria.
Some common trends among these older oil and gas producers are evident in the discussions that follow.
1.2.1
Qatar
The discovery in 1971 of the massive North Field gas reservoir, which has now been proven to have up to 900 tcf of non-associated gas, marked the beginning of a new era Qatar. However, for reasons including technical difficulties and challenges attracting funding, it took about two decades for proper exploitation of the reserves to begin. Part of the reason for the delay was that the value of natural gas as a fuel was not as widely appreciated as it is today and in fact the government of Qatar was more interested in oil production since it was already a significant source of national income. But as oil revenues declined, the Qatari government became increasingly interested in pursuing the development of its gas resources [ (Ibrahim and Harrigan 2012) and (Hashimoto, Elass and Eller 2004)].
According to (Hashimoto, Elass and Eller 2004) by the time gas production from the North Field began, Qatar had a three phase plan to:
1. Develop gas production for domestic consumption (in power, desalination, fertilizer and
petrochemicals).
2. Build an export pipeline to deliver gas to neighbors.
3. Build a liquefaction facility for export of LNG.
The first phase went as planned with the vast majority of the produced gas going to local power and industrial plants (Hashimoto, Elass and Eller 2004) and the effects of this policy remain today with virtually all of the electricity produced in the country coming from gas fired power plants (mecometer n.d.).
For political reasons ambitious plans for a pipeline system across Gulf countries never really took off and so that portion of Qatari strategy did not quite work out as planned. However, a smaller project connecting Qatar, Oman and the UAE was successfully built and is now a big part of intra-Arab gas trade [ (Hashimoto, Elass and Eller 2004) and (Fattouh and El-Katiri 2012)].
Today Qatar, with its 225,000 citizens, is the world's leading exporter of LNG and in 2012 had a
GDP of $185 billion (Rivin 2013). Furthermore, for years after the turn of the century its economy
Spending fueled by proceeds from the energy sector also spurred growth in the non-oil sector with an average growth of 20% from 2004 to 2011 (Ibrahim and Harrigan 2012).
1.2.2 Trinidad and Tobago
Trinidad and Tobago has an oil and gas industry dating back to 1866 when deposits were initially discovered. In the time since then, the sector has grown to become an important contributor foreign exchange incomes and GDP growth (Sergeant, Racha and John 2003). The performance of the sector is such that the economy sometimes appears to be split into an energy economy and a non-energy economy, with the energy economy being largely self sufficient (Artana, et al.
2007).
The country has about 27 tcf of natural gas reserves which it has been able to exploit to develop a thriving gas sector (Kin n.d.). Just like in Qatar, the economy of Trinidad and Tobago was primarily dependent on crude oil and the associated gas was mostly burned off. But as oil production and prices fell, natural gas became of more interest to the government and policy focused on diversifying away from oil and towards gas. The initial focus was on setting up domestic petrochemical industries that would use the gas as feedstock and this eventually expanded to include LNG exports (Racha 2001).
In addition to providing for the needs of the local petrochemical industry, early policy required that gas producers reserve a portion of their product for use by the Trinidad and Tobago Electricity Commission (T&TEC). Domestic demand was also further encouraged through tax incentives and subsidies. These policies played an important role in the emergence of the country as a major producer of ammonia and methanol [ (Sergeant, Racha and John 2003) and (Racha
2001)].
According to (Kin n.d.), the country's geographical constraints made pipelined gas deliveries to neighboring countries infeasible. As a result this option was never pursued as a means of monetizing Trinidadian gas.
After several attempts, the country's first LNG plant was finally commissioned in 1999 marking the country's entry into large-scale gas exports. As of 2002, the LNG industry was already the
biggest user of Trinidadian gas, exporting almost half of all the gas produced in the country. The country has since become a major player in the international LNG market [ (Sergeant, Racha and John 2003) and (Racha 2001)].
1.2.3 Angola
Offshore oil production began in Angola began in 1968 (Hodges 2001), and though the country was adversely affected by a civil war, offshore oil production was able to thrive between 1990 and 2003. Onshore production however was completely suspended between 1993 and 1996 (World Bank 2007). Today offshore sources still account for the majority of oil production in the country (EIA 2014) and oil is the most important source of revenues to the Angolan government
(IEA 2006).
Similar to Trinidad and Tobago, the Angolan energy sector is almost an economy onto itself. The linkages to other sectors of the economy are inadequate and as such they struggle to keep pace (Ramos n.d.).
Unlike Trinidad and Tobago and Qatar that have already incorporated gas into their economies, Angola remains a small player in the natural gas arena. The civil war hampered industrial development in the country and so for a long time it has been unable to attract the kind of large customers that can support the establishment of a domestic gas market. Most of the associated gas produced has for a long time been either burned off or re-injected into oil wells. However the transition towards gas utilization and the building a gas economy has begun but unlike in the other countries considered previously, it started out with an export driven focus [ (EIA 2014)
and (TEA 2006)].
(EIA 2014) predicts that for the future, expanding LNG and building a domestic gas market will
be a big part of the Angola's gas policy. According to (TEA 2006), some of the options being considered to form the basis for a new domestic market for gas are the power sector, an aluminum smelter, an ammonia/urea plant as well as a cement plant.
1.2.4 Nigeria
Like all of the other countries considered in this sub-section, Nigeria started out primarily as an oil producer following the discovery of crude oil in 1956. In the early days of the energy industry, the simultaneous exploitation of the associated gas was not considered to be worth pursuing because of oil was such a good source of revenues (Nwokeji 2007). Ironically, today Nigeria is sometimes described as a gas rich country which just happens to produce some crude oil (Okenabirhie n.d.).
Unfortunately Nigeria is often cited as an example of how not to develop a natural resource. As with some other oil rich countries, Nigeria's economic development has been concentrated largely on the oil industry to the neglect of other sectors (Ramos n.d.) and detriment of the economy at large.
As far back as the 1960s, there were efforts to utilize Nigerian gas domestically but infrastructural difficulties hampered these efforts. Around the same time negotiations for the export of LNG from Nigeria to the United Kingdom were delayed because of disagreements over price. Before any agreements could be reached, the North Sea discoveries were made and the British demand for Nigerian gas faded away (Pearson 1970). However, after a few decades of mostly flaring gas, the Nigeria LNG company became operational in 1999 as part of export focused attempts to reduce the environmental impacts of flaring and to monetize Nigeria's gas deposits [ (Okenabirhie n.d.) and (NLNG n.d.)]. In 2011 the commissioning of the West Africa Gas Pipeline (WAGP) followed. With this pipeline Nigeria began exporting gas to nearby neighbors Ghana with plans to extend delivery to neighbors Benin and Togo as well (Shell 2011).
Though some gas was already used domestically for power generation for example, the early emphasis on exports resulted in inadequate attention being given to developing domestic consumption. To address this shortcoming, the Nigerian government instituted a domestic supply obligation (DSO) to guarantee availability of gas for local use as part of its plan to deepen the domestic gas market and support industrialization (Okenabirhie n.d.).
(Okenabirhie n.d.) identified fertilizer, aluminum, methanol as well as additional power plants are among the options proposed for deepening domestic gas market In addition to guaranteeing domestic gas supply, a new pricing policy was adopted to encourage domestic gas demand. The
Nigerian government created the strategic domestic sector, strategic industrial sector as well as
the strategic commercial sector as categories into which industries will be classified. The price to
be paid for gas depends on which category the customer falls under (Omisakin n.d.).
A couple of things are evident from the foregoing discussions. There appear to be three phases
that major oil and gas producers may pass through as their industries develop. The phases are -the development of a domestic market, exports to neighboring countries, as well as exports to the wider international community. The order in which they may occur appears to depend to some degree on prevailing conditions within the producing countries when production ensues.
In addition, the economies of developing countries in the midst of oil and gas booms have exhibited a tendency to become dominated by the industry. Some sectors of the economy such as energy intensive sectors and others that provide services to the energy sector benefit from linkages. One downside to the disproportionate dependency on one sector is that in the event that the sector suffers, it can drag down the dependent sectors and possibly the entire economy as well.
Furthermore, the circumstances affecting a government's choices are not entirely within its control. For example, just as Nigeria had no control over the effects of discoveries in the North Sea on demand for its gas in the United Kingdom, Tanzania's gas industry is emerging at a time when shale gas developments in the United States and China appear likely to permanently change the international gas market (EIU 2014). This will inevitably factor into long term thinking about Tanzania's natural gas.
1.3 Organization
The rest of the thesis is organized as follows:
Chapter two describes the gas monetization options that this paper focuses on, that is, the export of LNG, urea production and the use of gas in generating electricity. Naturally, attention is focused on the role of gas.
In line with the added focus on Tanzania's electricity sector, the third chapter provides a brief overview of the country's electricity system and the plans to improve performance - a driver for the scenarios considered in the model.
The fourth chapter is an account of the scenario analysis model on which the findings of this paper are based. There is a discussion about scenario analysis models and their applicability to the issues addressed in this paper. Following this discussion are descriptions of the different sub-models in the model.
Chapter five presents and discusses the results and is followed by a final chapter in which key results are summarized and policy recommendations are presented.
Chapter 2
Gas Monetization
Though numerous monetization options including CNG for domestic transportation, as well as
GTL production exist, I evaluate three that are significant for Tanzania -LNG, urea and electricity
generation. The choice of these options are informed by the experiences in other countries as discussed previously. They also feed into the broader developmental objectives and commitments of the government Domestic urea manufacture for instance could support the Tanzanian government's commitment to the Abuja declaration for increasing fertilizer use
(NEPAD 2011), while the gas to power option is consistent with the objectives outlined in (TZ
MEM 2013) to improve access to electricity. Further justification for evaluating these options lies in the fact that actual proposals to pursue options in these areas already exist [ (2b1st Consulting 2012)and (Daly 2014)] increasing the likelihood that they will be pursued.
2.1 Liquefied Natural Gas (LNG)
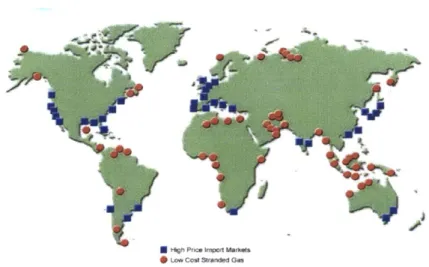
Figure 2-1 shows some locations of low cost stranded gas and gas markets around the world that they are typically transported to. With its increasingly improving technology and declining costs,
LNG offers a means by which natural gas producers can transport gas to distant customers via
sizable domestic or regional market that they can service as is the case with many developing countries including Tanzania. The marketfor LNG has evolved from a 3 MMTPA industry globally in the 1970s to 106 MMTPA in 2001 and is expected to continue growing, doubling between
1999 and 2020 (Coyle, Durr and Shah 2003).
High PYc0 kPor Markftt
* Low Cost Strarded Gas
Figure 2-1: Stranded Gas Reserves/High Price Import Markets
LNG is produced by cooling natural gas to -161 degrees Celsius. In its liquefied form, the gas fills
approximately 1/600th of the space it occupies in gaseous form. This fact makes it economical to develop gas reserves that would otherwise have been too expensive to explore (Coyle, Durr and Shah 2003). Components of the LNG value chain include - gas production and field
processing, onshore gas treatment, and gas conversion via liquefaction. Others are LNG shipping,
receiving terminal and end use as a fuel (Coyle, Durr and Shah 2003).
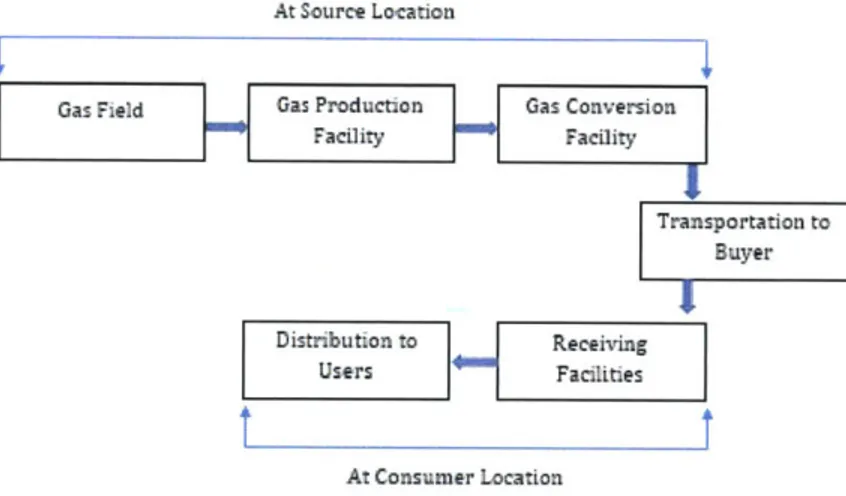
Gas is sourced from nearby gas fields and piped to production and conversion facilities where processing and liquefaction take place. The liquefied gas is transported in specialized vessels that keep their cargo at very low temperatures during transport to buyers. At the buyer's end,
regasification is carried out at receiving facilities from where it can be distributed locally via pipeline to end users. On the supply and demand sides of this value chain, significant investments
in infrastructure are required and will often result in job creation.
At Source Location
Gas Field Gas Production Gas Conversion
m
Facility Facility Transportation to Buyer Distribution to Receiving Users Facilities At Consumer LocationFigure 2-2: Typical Gas Monetization Value Chain (Coyle, Durr and Shah 2003)
As a result of the dominance of long-term supply contracts, breaking into the LNG market is not straightforward even if a new producer's gas is cheaper than competing gas. Timing of projects are important as it can allow new projects to compete for opportunities that open up as pre-existing long-term contracts reach expiry (Paltsev, et al. 2013).
2.2 Urea Production
Global demand for urea is approximately 165 million tons annually and up to 90 percent of that is used as fertilizer. It is the most commonly used fertilizer (Zwart 2013). Besides its use as a fertilizer, urea is used in the production of urea-formaldehyde (UF) resins, melamine, and potassium cyanate as well as urea nitrate. Further demand growth is expected to come with the
growing demand for biofuels (MEEA 2010).
Regions with large natural gas endowments tend to be home to large urea exporters reflecting the importance of natural gas to the manufacturing process (Yara 2012). The largest consumers and manufacturers of urea are in Asia and there is a thriving international trade between countries with excess production and those with unmet demand (FactFish 2014). Twenty-seven percent of urea manufactured in 2010 was traded internationally (Yara 2012) demonstrating its viability as a trade commodity.
2.3 Electricity Production
Burning gas to generate electricity is an increasingly popular choice, especially given the relatively low carbon emissions levels and the trend towards limiting emissions. Gas can either be delivered to distant power stations where electricity is produced or used in nearby power stations to generate electricity which can then be transmitted by wire to consumers. The decision about how to proceed will usually depend on economic and technical factors such as location of demand centers, and transmission losses that affect financial viability and technical feasibility.
Consumers Gas Field Power Plant Transmission & Distribution
Figure 2-4: Conversion of gas to power
Gas power plants are able to serve base load and peaking functions in a power system. They have
short lead times and are flexible and generally quite reliable. Monetization by electrification offers two immediate benefits -it is usually a reliable gas consumer, thus deepening the domestic market for gas and given the widely recognized links between electricity use and economic
output, its increased availability could trigger or at the very least support further economic development
Chapter 3
Tanzania's Electricity Sector
Despite the fact that Tanzania's economy has managed an impressive growth rate of 6 - 7 percent in recent years, popular opinion holds that economic growth is hampered by the crisis in the country's power sector (Norton Rose Fulbright 2013). As such improving access to electricity is a priority issue for the country's government To this end, an official government electricity demand forecast and plans for how to meet it was drawn up and articulated in the Power Sector Master Plan that was produced by the Tanzanian Ministry of Energy and Minerals.
3.1 Overview of the Tanzanian Electricity Sector
The electric power system in Tanzania is operated by the state owned, vertically integrated monopoly Tanzania Electric Supply Company (TANESCO). TANESCO has an installed capacity of
1028 MW serving a population of approximately forty-four million people. Fifty-five percent of
the existing capacity is hydro with the balance made up of thermal capacity. A far cry from Sweden's 17,000 kWh for instance, the per capita electricity consumption in Tanzania is less than
with less than a fifth of the country's population having access to electricity and unsurprisingly the situation is particularly severe in rural areas (Norton Rose Fulbright 2013).
Electricity demand is forecasted to grow at over 10 percent annually thus necessitating significant investment in capacity expansion. Fortunately Tanzania has untapped hydro, coal and natural gas resources that could allow it meet its future electricity needs (Larsson 2007) if
properly deployed.
One challenge facing the power sector in Tanzania is that electricity has been artificially cheap. The low prices impose financial pressure on TANESCO, ultimately resulting in operating losses for the company and affecting the financial viability of the power system as currently operated (Norton Rose Fulbright 2013). Fortunately, TANESCO was recently able to secure approval to raise tariffs and so could be on the way to financial stability (EWURA 2013).
Ruaw. 4% 4 1.4 it1 4 - V, i
Figure 3-1: Electrification Rates around Tanzania (Larsson 2007)
3.2 Bridging Electricity Deficit
The Tanzanian government set itself a target to increase per capita consumption of electricity from 81 kWh to 200 kWh between 2011 and 2016. In addition to increasing electricity consumption per individual, the government also intends to increase the electrification rate to
Uir I:% Sai'mal
75 percent by 2035 (TZ MEM 2013) from under 20 percent. If the government plan is followed
faithfully, then capacity additions will be rapid in the early years followed by a more moderate pace in the later years. The plan requires almost non-stop investment in new electricity and related infrastructure over about two decades. The largest capacity additions occur between 2014 and 2023, and are only a fraction of overall investments as transmission and distribution will have to grow as well to keep pace with expected electricity supply.
3.2.1 Power Generating Technologies
According to details provided in (TZ MEM 2013), the government expects future electricity capacity additions to come from fuel resources that are domestically available and so to be predominantly from new coal, hydro and gas power plants. These choices are intended to take advantage of domestically available resources. They come with different environmental implications, associated costs and construction lead times.
Coal is the most widely available fossil fuel in the world and coal fired power plants provide for over 40% of global electricity needs. However, it is considered to be a dirty fuel, with over a hundred pollutants released into the atmosphere when coal is burned. It is a major source of the world's carbon dioxide emissions and though technology for limiting emissions exist, they come at a very high cost [ (Schissel, Smith and Wilson 2008), (Freese, Clemmer and Nogee 2008) and
(IEA-CIAB 2010)].
Hydropower is a zero-emission resource that takes advantage of the "natural energy of flowing water to provide clean, fast, flexible electricity generation" (DOE 2004). According to (IRENA 2012), it"is the most mature, reliable and cost-effective renewable power generation technology available" and 16% of the world's electricity and 80% of the renewable electricity are produced from hydro power sources. By controlling the flow of water, hydropower plants are very flexible, able to respond quickly peak demand and unexpected events in the power system and as a result can play an important role system stability (DOE 2004).
Natural gas power plants on the other hand have low carbon emissions levels and capital costs when compared to other fossil fuel based power generation technologies. They also have the
added benefit of short construction lead times when compared to coal plants for example which can take more than twice as long to construct Gas fired power plants are uniquely able to meet baseload requirements while also being able to respond flexibly to fluctuating demand from consumers and supply from renewable sources. Gas fired power plants are either combined
cycle, steam turbine or gas turbine plants [ (AEP n.d.) and (MITEI 2011)]. CCGT plants are
currently the most popular kind of gas fired power plants. They generate electricity in the same way as regular gas based plants but also make use of the waste heat to generate some more electricity as well. As a result, they are significantly more efficient than older technologies
(Alawode and Omisakin 2011).
The ability of the Tanzanian government to faithfully follow its ambitious electrification plan and either pay for or attract the required private investments remains to be seen. The capital costs of setting up the different power generating technologies and the construction lead times will be big factors in determining how successful the plans will be. With that in mind, the lower capital costs per kilowatt, shorter construction lead times and the domestic abundance of natural gas could all work together to make gas power plants an increasingly attractive option in the country. In fact, given these relative advantages, investing in gas power plants could prove to be the only way that Tanzania is able to meet the financial requirements of its ambitious electrification targets.
Chapter 4
The Model
Given the scant information on decisions made by the Tanzanian government with regards to developing the gas sector, I have developed a model that enables analyses of a range of possible future scenarios. The model is split into sub-models for LNG export, electricity production and urea manufacture - the three monetization options considered. The model was implemented entirely in Microsoft Excel.
4.1 Scenario Analysis Models
Scenario analysis is well suited for considering long term issues. It is used in the corporate world and the public sector as a tool for formulating strategies for future business and social development efforts. By examining possible future outcomes, it serves an important role in the mitigation of risks (Maack 2001).
Scenarios describe possible versions of the future and the elements that lead to those outcomes. The degree of detail associated with each scenario depends on what it is intended to describe (Kosow and Gabner 2008). They are particularly useful at times when there is uncertainty about what will happen (Postma and Liebl 2005) as is the case in Tanzania. Qualitatively, good scenarios are plausible, consistent as well as distinct and relevant to the issue at hand (Maack
2001). Several different kinds of scenarios are used depending on what the objective of the analysis is. (IAA 2013) identified a couple of them including:
" Historical scenarios
* Synthetic scenarios
" Single-event scenarios and " Multi-event scenarios
Various approaches are followed to carry out scenario analysis and as such there are no rigid implementation rules. The approaches generally tend to involve an iterative process that includes preparations, scenario building, writing scenarios and then using the results of analysis to plan, implement and then improve strategy (Maack 2001).
Synthetic scenarios were developed for this study. They consider events that could play out in the future. They tend to be very dependent on assumptions (IAA 2013) and as such for correctness, assumptions have to be carefully made. The scenarios developed for this study are discussed shortly.
4.2 Implementation
4.2.1 LNG Exports Sub-model
The LNG sub-model tracks exploration costs, capital investments as well as the revenue flows to be earned by participating parties if the LNG option is pursued. In this thesis the focus is on government revenues so private sector revenues are not reported on.
Perhaps the most important assumption in this sub-model is the capacity of the proposed LNG trains. It is important because together with the price of the gas it has the most direct effect on the amount of revenue that can be earned. Consistent with the assumptions made by (Castelo
2013) in the DNEAP model for neighboring Mozambique, this sub-model of my model assumes
that each of the LNG trains to be built will have a capacity of 5mmtpa. Also based on the DNEAP model, I assumed that each LNG train will cost about $6 billion and take six years to build. There
are three scenarios with four, six and eight LNG trains respectively. Construction work on new trains is assumed to commence in two year intervals. Such a speedy of expansion is not unprecedented as is evident from the pace at which the Nigeria LNG company was able to expand its production capacity (NLNG n.d.).
The facilities are assumed to operate at full capacity over the duration of time considered in the model. In reality, actual production levels will probably be driven by a combination of long term supply contracts as well as the less predictable opportunities for gas sales on the spot market (Hartley 2013) and so will not always result in full capacity utilization. This assumption is a useful way to determine the absolute maximum gas production and revenue generation levels possible in each of the scenarios in this sub-model.
The gas prices used in the model are those forecasted for Japan as reported by (Medlock III 2014) less $4 to account to for the cost of liquefaction and transportation. Asian prices are used because like Mozambique which has already secured long term supply deals with Asian buyers (Team 2014), Tanzanian LNG exports will probably find a market in Asia. The forecasted prices as illustrated below in figure 4-1 reflect the expectation that prices in Japan will decline from the highs triggered by the 2011 Fukushima nuclear disaster and the consequent shutting down of all Japan's nuclear power stations. According to (Medlock III 2014), the price decline is expected to come about as a result of increased global gas supply as new producers like Tanzania join the market, gradual restoration of the nuclear capacity or a combination of both factors.
Natural Gas Price Forecast ($/MMBtu)
12 10 8 6 4 2 0 -t -n kD - F W -: - G Pr4c F cas tn m r W M 0 M L -4j v-1 -1J -4 r- 4 r4 N r q r4j N' N
The sources of government income from LNG depend on the specific rules in the country and the nature of government participation in the industry. In Tanzania, the rules as described in (TPDC
2013) suggest that the government reserves the right to participate directly in the industry
through joint ventures in which the state owned TPDC and private investors both hold equity in developing the gas. However, for simplicity the scenarios considered in this paper do not explore joint ventures. The model uses the rules in (TPDC 2013) as assumptions for determining revenue flows between government and private investors.
The first source of government revenue is royalty payments. Royalty payments are a percentage of the value of the gross gas production from a contract area and are made before any recovery costs are deducted. In the case of Tanzania it is 7.5 percent. Furthermore, from the net production investors are entitled to some of the gas produced up to a 50 percent limit to recover qualifying expenses incurred up that time. Any unrecovered expenses are rolled over to the
following year (TPDC 2013).
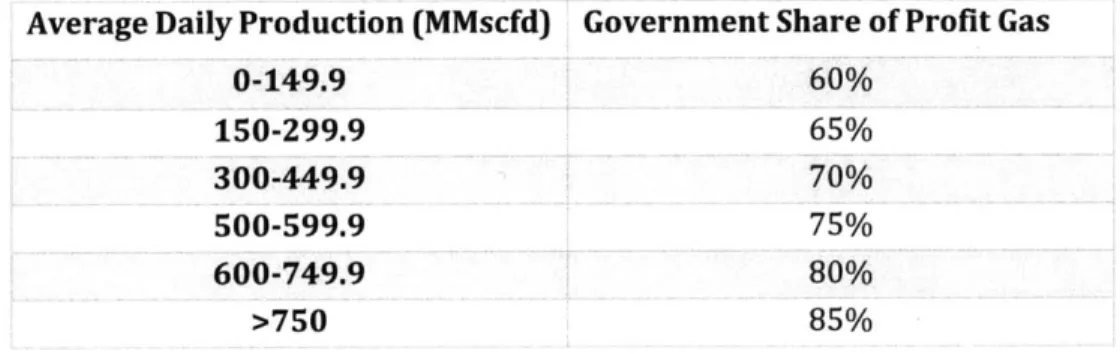
The gas left after allowed cost recoveries have been deducted is called profit gas. The profit gas is split between the government and the operators of the gas field according to a pre-agreed sharing formula. The sharing formula from (TPDC 2013) is used in the model. It is shown in table
4-1 below.
Average Daily Production (MMscfd) Government Share of Profit Gas
0-149.9 60% 150-299.9 65% 300-449.9 70% 500-599.9 75% 600-749.9 80% >750 85%
Table 4-1: Summary of Production Sharing Formula
The government earns additional revenue from the corporate income tax that the gas companies are required to pay. The 30% rate used in the model is as specified in the Tanzanian Income Tax
Taxable income is the sum of a company's revenues from gas sales and recovery gas less exploration costs, operations and maintenance costs, depreciation, and royalties. As per usual the model is designed such that if investors make losses, such as in the years before gas production starts and revenues are earned, tax paid is zero. The algorithm for determining tax paid in a particular year is of the form:
If Ti x TR <0 then CIT =0
Else CIT = TI x TR.
Where CIT = Corporate Income Tax, TR = Tax Rate, and
TI = Taxable Income.
In accordance with methods adopted by (Castelo 2013), the pre-production cumulative CAPEX is depreciated at 20% annually. After production begins, depreciation for a particular year is calculated by applying the depreciation rate to the difference between the cumulative CAPEX for that year and that from four years earlier.
Pre - production Depreciation (in yr X) = 20% x CC(in yr X)
Post production Depreciation (in yr K) = 20% x [CC (in yr K) - CC (in yr K - 4)]
Where CC = Cumulative CAPEX
Figure 3-2 illustrates the various paths through which revenues from Tanzanian gas production will flow for both investors and government.
Total Government Revenue
= Royalties + Govt. Share of Profit Gas + Corporate Income Tax
Gross Production
Net Production
Cost Gas
Royalties
Profit Gas
Company Profit Gas Government Profit Gas
Corporate Income Tax
Company Revenue Tanzania Government
Revenue
Figure 4-2: LNG Revenue Flows [Adapted from (Castelo 2013)]
Some of the other assumptions used in this sub-model are:
Royalties 7.5%
Corporate Income Tax 30%
Cost Recovery Limit 50%
Table 4-2: Selected LNG Exports Sub-model Assumptions
4.2.2 Urea Production Sub-model
Just like the LNG sub-model, the urea sub-model tracks capital investments and revenue flows if urea production is pursued as a monetization option.
As in the other sub-models of the model, three scenarios were modeled for this sub-model as well. The scenarios explore outcomes that may arise in the event that one, two or three urea
]
plants are constructed respectively. Consistent with other plants being built on the continent, each plant in this sub-model is assumed to have an annual urea production capacity of 1.3 million tons and to cost about $2 billion to construct. Similarly the model assumes that construction time is three years and that construction of each new plant commences two years after the previous one was completed (IFC 2012). Though 1.3 million tons of urea is roughly twice the estimated 2011 urea consumption in East Africa (FactFish 2014), it is reasonable to expect that exports to the wider international market would be part of any plans for urea production in Tanzania and so there would be a market for all of the output. As in the previous sub-model, as a simplification capacity utilization in all of the scenarios is assumed to be 100 percent.
Total gas required was computed as the sum of the gas required to produce the ammonia input as well as to produce the urea itself. As in the LNG sub-model, taxable income was computed as company revenue less qualifying expenses. The depreciation method applied in the LNG sub-model was also adopted in this sub-sub-model as well.
The urea plants are assumed to be owned by private investors with no direct equity participation
by the government or its agencies. Also, it is assumed that the plant operators will purchase gas
as feedstock at the international gas price and pay taxes. As a result, government revenues stemming from investments in urea plants are expected to come directly from gas sales and the resulting corporate income taxes.
Some other assumptions used in this sub-model are:
Volume of natural gas required per ton of ammonia 32.37 MMBtu
Gas required per ton of urea produced 28.13 MMBtu
OPEX $40/ton
Table 4-3: Selected Urea Sub-model Assumptions
The model also assumes that current urea prices in Tanzania represent competitive international prices since there is no local manufacturing capacity and the country's urea supply is met by imports. Then starting with the Tanzania urea price (converted to 2010 dollars) for January 2014 as reported by AMITSA, the Regional Agricultural Input Market Information and Transparency System, the model computes future urea prices. For the calculation, the model
assumes that urea prices will change at the same rate as the LNG price since natural gas is the most expensive input in the manufacture of nitrogen based fertilizers (US GAO 2003). This means that a plot of the urea price forecast would be have the shape as that for gas price forecasts.
4.2.3 Electricity Production Sub-model
The electricity sub-model tracks capital investments and revenue flows and related costs while also considering the different roles natural gas could play in bridging the electricity deficit in Tanzania. Consistent with a more specific focus on Tanzania's electricity sector, this sub-model also considers carbon emissions as well as spending on fuel over the economic lifespan of each new power plant. The nameplate capacities of the plants in the individual scenarios differ but, consistent with assumed capacity factors, the total energy output across each of them is equal to
that projected in (TZ MEM 2013).
The first scenario is based on the government plan detailed in (TZ MEM 2013). In this scenario, natural gas power plants have the smallest share of planned new generating capacity compared to either coal or hydro.
The second scenario is one that may be considered somewhat unusual at first glance. Following the same timetable proposed in (TZ MEM 2013), only gas fired power plants are built. In other words, instead of the mix of technologies and fuels proposed in the original government plan, this scenario considers outcomes that could arise from building only CCGT plants instead.
The domination of a power system by a single technology and fuel is not unprecedented. It has happened in several countries around the world as demonstrated in figure 4-3 below. Though this scenario may never actually play out, it is a useful extreme to investigate because it allows us to consider an upper limit for gas use in addressing Tanzania's electricity needs as specified
in the government's own plans.
The final scenario is a low carbon scenario in which no coal plants are built. Instead only natural gas and hydro plants are built. Tanzania may want to start early to avoid carbon emissions for reasons ranging from wanting to avoid possible future carbon taxes, future international conventions to simply doing its part to be environmentally responsible.
The model assumes that the operational lives of gas, coal and hydro plants are twenty, twenty-five and fifty years respectively. However, as before, these simplifying assumptions once again make the computation of an absolute upper limit of possible fuel requirements and levels of carbon emissions more straight forward.
Fuels for Electricity 100.00% 90.00% 80.00% 70.00% 60.00% 50.00% 40.00% 30.00% 20.00% 10.00% 0.00%
U N. Gas U Oil U Coal E Hydro
Figure 4-3: Fuelsfor Electricity Generation (data gatheredfrom Macro Economy Meter -http://mecometer.com/)
Currently, electricity prices in Tanzania are proposed by TANESCO, the state owned power utility, and are subject to approval by EWURA, the regulatory authority. In late 2013, TANESCO proposed a tariff increase that would have approximately doubled the price of electricity between late 2013 and 2015, including an initial 67.87 percent increase. Instead EWURA approved a 39.19 percent increase effective from January 2014 until 2016 unless a cost of service study to be carried out in 2015 finds that an earlier increase is justified (EWURA 2013). The energy prices used in the model begin at the level approved by EWURA for the energy charge and then assumes that prices increase between 2016 and 2019 to the levels in TANESCO's original application. Afterwards they remain constant.
The model uses energy prices, thus excluding any charges associated transmission and distribution. In this way power generation is considered as an economically distinct activity and
the model focuses on the electricity related activity that can most directly be associated with natural gas use.
As per the norm in Tanzania, the model's energy prices are differentiated across the three tariff categories - general usage, low voltage and high voltage. Electricity consumption across the three tariff groups in the model follows ratios forecasted in (TZ MEM 2013).
Even though domestic Tanzania gas prices may eventually be lower than export prices, the international gas price used in the LNG and urea models is also used in the electricity sub-model as well since it represents the competitive value of the gas to Tanzania. In this sub-sub-model, it also assumed that new investments in new generating capacity will be private sector driven. Consequently, similar to the case in the urea sub-model, government revenues that flow directly from the use of gas for electricity will comprise of revenues from the domestic sale of government's share of profit gas and taxes paid by the generating companies.
Unlike in the other sub-models, depreciation of the generating plants is computed using the straight line method. Straight line method of depreciation is the method generally adopted for depreciation under cost of service regulation of the electricity sector (Gomez 2013). The model assumes that the salvage value of generating plants is a quarter of its original value. The annual depreciation was computed using the formula:
Cost of Fixed Asset - Salvage Value
Annual Depreciation Expense =
Economic Life of Asset (Years)
The Levelized Cost of Energy (LCOE) is a useful means of distinguishing the relative cost of electricity produced by power plants (Kost, et al. 2013) and is a useful means of comparing the three scenarios considered in this sub-model. The levelized cost of producing electricity at each plant, in each scenario was computed using:
I + = (1 +r)t
X(1 + t
En E
Where,
I = Investment Expenditure At = Annual Total Costs in year t
Et= Produced quantity of electricity in the respective year in GWh
r = real interest rate
n = operational lifetime in years
t = year of lifetime
Some other assumptions made in this sub-model are summarized in table 3 below:
Natural Gas Heat Rate 8,513.82 Btu/KWh
Thermal Plant Capacity Factors 0.75
Fixed O&M Coal Steam Thermal 70.33 USD/KW/yr
Fixed O&M Gas Turbine 9 USD/KW/yr
Fixed O&M CCGT 7 USD/KW/yr
Fixed O&M Hydro 16 USD/KW/yr
Variable O&M Coal Steam Thermal 0.0075 USD/KWh
Variable O&M Gas Turbine 0.0056 USD/KWh
Variable O&M CCGT 0.003 USD/KWh
Table 4-4: Selected Electricity Production Sub-model Assumptions
With the results obtained for each plant, the average LCOE in each scenario weighted by the capacity of each of the power plants in the respective scenarios was computed to get three weighted average LCOEs.
Furthermore, in order to compare the various costs associated with each of the scenarios in this sub-model, a discounted cash flow analysis of projected fixed O&M costs, variable O&M costs and fuel costs were computed for the assumed economic lifespans of each power plant. For simplicity the capital cost associated with the construction of each plant was assumed to be an overnight cost and so unlike the other costs was not discounted.
Discounted cash flow (DCF) analysis is a method by which investment opportunities are assessed in so as to determine the present value of future cash flows (Investopedia n.d.). It makes it possible to compare projects on an even basis regardless of differences in "capital scales, risk characteristics, and timelines to delivery" (Paltsev, et al. 2013).
Discounted cash flows were computed using:
Cash Flow
Discounted Cash Flow = (1 + r
Where,
r = discount rate n = year of operation
4.3 Shortcomings of the Model
As is the case with all models, the one developed for this paper is imperfect. Generally speaking, a shortcoming of scenarios analysis is that there are inevitably unknown and sometimes unknowable variables (Postma and Liebl, How to improve scenario analysis as a strategic management tool? 2005). As a consequence, assumptions simply have to be made.
My model for Tanzania included many simplifying assumptions such as that of non-stop
production at the various plants considered and overnight costs for power plants. There is also the fact that since there are no confirmed plans about things like the capacities of future LNG and urea plants, the scenarios modelled are largely hypothetical and so may never happen as assumed. That said, it also important to note that even confirmed plans can often change and so even when they exist, there will always be a degree of uncertainty about future outcomes.
The scenarios model for Tanzania remains useful because it achieves its objective of providing a relative measure of the usefulness and economic impact of each monetization option considered.
Chapter
5
Presentation and Discussion of Results
Government revenues are a measure of what the government can do domestically for development through public investments in infrastructure for instance. And even though revenue maximization would be a legitimate goal for the Tanzanian government to pursue, the results discussed in this chapter demonstrate that larger revenues do not necessarily translate into higher economic value for the country. The results show that though the government will in the long term earn the most revenue from exporting LNG, among the options considered actual maximum direct value to the Tanzanian economy for each unit volume of gas will come from generating electricity.
5.1 Results
5.1.1 Revenues
In the model the Tanzanian government either exports gas or is able to sell it domestically at the same price as it would obtain in the international market. The reason for this, as indicated earlier, is that international prices are usually the most competitive and so reflect the actual value of the
Based on the sharing formula and associated payments to the government proposed in (TPDC
2013), the model projects very significant government income in all of the three LNG export
scenarios. Consistent with expectations, figure 5-1 shows that by 2035 annual revenues are highest in the scenario with 8 LNG trains. The results demonstrate that even with investors deducting cost gas for cost recovery, the government can expect to begin earning steadily rising revenue right from the year exports begin. Starting with a revenue of about half a billion dollars in the first year of operation in all of the scenarios, fifteen years later annual revenues will range from just over $6 billion with four LNG trains to approximately $9 billion with eight LNG trains.
The results also show that cumulative government income after fifteen years of operation could be almost $66 billion with eight trains, a figure that is only marginally higher than revenue from six trains. Annual government revenue with eight trains only surpasses revenue in the case of four trains after about eight years of production in 2028 and at about the same time in the case of six trains. These results reflect the effect of the additional investment on the rate at which government revenues grow since investors have more costs to recover. Greater costs to be recovered by investors result in delayed returns for government but ultimately, the government will eventually earn more with higher production volumes
Cumulative Government Revenue (LNG)
70000 60000 C 0 50000 40000 w 30000 U 20000 CC 10000 0 2020 2021 2022 2023 2024 2025 2026 2027 2028 2029 2030 2031 2032 2033 2034 2035
-4trains - 6trains - 8trains
Figure S-1: Plot of Cumulative Revenues from LNG Export
The results show no surprises in outcomes for the manufacture of urea in Tanzania. Projected government incomes from urea are significantly smaller than those that it can expect to earn over a similar period from exporting LNG. This outcome is not unexpected given the vastly smaller amounts of gas involved and the fact that the government is less economically involved in the in the industry. The more urea plants there are, the more revenue the government will earn but as with everything there is a limit to how much production capacity the market can support.
After seventeen years of operation, annual revenues vary between $540 million in the one plant scenario to $1,571 million three plant scenario. Similarly the cumulative government revenues earned from a urea industry will range from approximately $8 billion to $17 billion for the production scenarios considered.
Cumulative Government Income (Urea)
20000 18000 16000 14000 12000 10000 ) ' 8000 6000 c: 4000 2000 0 2018 2019 2020 2021 2022 2023 2024 2025 2026 2027 2028 2029 2030 2031 2032 2033 2034 2035 - 3 Urea Plant - 2 Urea Plants - 1 Urea Plant
Figure 5-2: Plot of Cumulative Government Incomefrom Urea
Electricity capacity in all three scenarios is intended to meet the same demand projections and so the same amount of electrical energy is produced and sold at the tariff approved by the regulator. As a result, the same gross revenue is earned for the generation of electricity regardless of the scenario. However, government revenues vary from one scenario to another because of the differences in revenues generated from fuel sales and in the taxes collected.
The results demonstrate that at assumed prices, the government will earn a lot more revenue from selling gas for electricity production than for urea production.
Cumulative Government Revenue (Electricity)
80000 70000 60000 50000 0 40000 30000 20000 10000 0
- PSMP - Gas Only - Low Carbon
Figure 5-3: Plot of Cumulative Government Income from Electricity
Bringing the results from the different sub-models together, figure 5-4 shows plots of the annual and cumulative revenues that will be earned by the government from the different monetization options based on the assumptions made in the model. The plots show how the three LNG scenarios fare against the most gas intensive scenarios from the other sub-models. They illustrate just how significantly urea lags behind the other two options as a source of public revenues and how rapidly LNG exports can rise to close the revenue gap with electricity production despite the gap in start times.
5.1.2 Value Added
Although the cumulative revenues earned by the government are an important component of factors to be considered in decision making, considered in isolation they may give a biased measure of the potential economic value of the gas produced and used in the different options. It is vulnerable to the effects introduced by the different market sizes for different options.
Annual Government Revenue Across Monetization Options (6 trains)
s02 cn 02622 9/22 09200n 0 0 nco ice
Cumulative Government Revenue Across Monetization Options (4 trains!
2v- i.Oiv,
-((Sc 9 i..w
" * JV 10 1 X- 'W A141 XM ?'70 x n
Cumulative Government Revenue Across Monetizatonr Options 16 trains!
1,2 o2012,RV Z,'). 7002 'L2. 20v '12S -cO to Loe t 0500 !0-000
7 Lf- s iO - Dveosoj 1-sso - -n
Cmu ative Govemment Revenue Across Monetizat-on Options iS train s
...
Figure 5-4: Government Revenue across the Monetization Options
Annual Govemnmeot Revenue Across Monetization Options (4 tiamns) Annual Government Revenue


![Figure 4-2: LNG Revenue Flows [Adapted from (Castelo 2013)]](https://thumb-eu.123doks.com/thumbv2/123doknet/14177114.475532/38.918.233.634.251.546/figure-lng-revenue-flows-adapted-castelo.webp)


