Assembly Cell Layout and Kanban System Design
for an Oilfield Services Company
by
Junying LIU
Bachelor of Engineering in Industrial Engineering
Shanghai Jiao Tong University, 2009
SUBMITTED TO THE DEPARTMENT OF MECHANICAL ENGINEERING IN PARTIAL FULFILLMENT OF THE REQUIREMENTS FOR THE DEGREE OF
MASTER OF ENGINEERING IN MANUFACTURING AT THE
MASSACHUSETTS INSTITUTE OF TECHNOLOGY
AUGUST 2010
C 2010 Massachusetts Institute of Technology. All rights reserved.
ARCHIVES
MASSACHUSETTS INSTiTUTE OF TECHNOLOGYNOV 0
4
2010
LIBRARIES
NSignature of Author:
Certified by:
Accepted by:
Department of Mechanical Engineering
August 17, 2010
Kamal Youcef-Toumi
Professor of Mechanical Engineering
Thesis Supervisor
/
David E. Hardt
Ralph E. and Eloise F. Cross Professor of Mechanical Engineering
Chairman, Department Committee on Graduate Students
Assembly Cell Layout and Kanban System Design
for an Oilfield Services Company
by
Junying LIU
Submitted to the Department of Mechanical Engineering
on August 17, 2010 in Partial Fulfillment of the Requirements
for the Degree of Master of Engineering in Manufacturing
ABSTRACT
The thesis describes the layout design of new gauge assembly lab for an oilfield
services company. A relationship diagram was created to categorize all the
workstations and activities in the assembly line. Three layouts were proposed
based on the categorization. One layout that facilitated the assembly flow best
and met the requirement of human factors was selected. This new layout enables
the company to meet the increased demand in 2011. In addition, Kanban system
was also introduced to this assembly line to reduce lead time to one month and
to reduce inventory by 40%, respectively.
Key words: layout design, relationship diagram, Kanban, lead time reduction,
inventory reduction.
Disclaimer: The content of the thesis is modified to protect the real identity of
the attachment company. Company name and confidential information are
disguised.
Thesis Supervisor: Kamal Youcef-Toumi
Acknowledgement
First of all, I want to give my thanks to Singapore-MIT Alliance and REDA for providing me the valuable opportunity to do my internship in the company. I also would like to thank my supervisors in the company, Mr. Francis Maissant and Mr. Li Wu. They are always willing to share their industrial experiences and innovative ideas with me. At the same time, they also provide me with enough freedom to find my own way to define problems and then solve them. Their guidance and enthusiasm significantly inspire me during the internship.
Next, I would like to convey my unreserved gratitude to Professor Kamal Youcef-Toumi and Dr. Brian W. Anthony for their time and valuable suggestions on critical problems in my project, and to Ms. Jennifer Craig for her lectures on English writing skills and advice on improving the structure and wording of my thesis.
Thanks are also given to Mr. Jason Toh, Mr. Tiang Chai, Mr. Te Xiang Chong, Mr. Chen Hai Min, Mr. Krishnamoorthy Adimoolam, Ms. Siti H.B. Mansol and Ms. Ting Ting Sam for their support and help during my whole internship.
Great thanks to my friends and teammates, Lang Xiaoling and Liu ren. Working with you two during the last six months will definitely be one of the most enjoyable memories in my life. Kind thanks are also given to Shimmer and Chester for their help during my preparation of the thesis.
Special thanks to Emma and Breeze, your unreserved support and companionship is an extraordinary gift for me.
Biggest thanks to my parents, thank you for your support for every single decision I made without questioning me during my whole life.
Table of Contents
A cknow ledgem ent...
Table of Contents...11
Table of figures... iii
List of Tables ... iv
Chapter 1 Introduction... 1
1.1 Com pany background ... 1
1.2 Introduction to m ain products... 1
1.3 Gauge production overview ... 4
1.3.1 Gauge products ... 4
1.3.2 Production process ... 5
1.3.3 Current production ... 7
1 .4 T h e sis o u tlin e ... 7
Chapter 2 Problem Statem ent...9
Chapter 3 Theoretical Background ... 13
Chapter 4 M ethodology ... ... ... 15
4.1 Data Collection...15
4.2 M aterials Handling Analysis...15
4.3 Relationship/Affinity Analysis ... 15
4.4 Calculating Space Requirem ents ... 17
4.5 Design Block Layout and Alternative Layouts... 19
4.6 Detailed Layout Design...19
4.7 Kanban System Design ... 19
Chapter 5 Results and Discussion... 21
5.1 Basic Data Analysis ... 21
5.2 M aterial Handling Analysis...23
5.3 W orkstation Relationship Analysis... 24
5.3.1 Relationship Chart...24
5.3.2 Relationship Diagram m ing...26
5.4 Space Requirem ent Analysis...29
5.5 Block layout design...30
5.6 Kanban design...35
5.6.1 Kanban Loops...35
5.6.2 Determ ine Kanban Quantity ... 40
5.6.3 Kanban system im plem entation...41
Chapter 6 Conclusions and recommendations ... 44
References... 46
Table of figures
Figure 1-1 Schem atic of ESP products... 2
Figure 1-2 Schem atic of G L product... 3
Figure 1-3 Gauge (blue parts) integrated in ESP... 4
Figure 1-4 Schematic of the layout the gauge production cell...5
Figure 1-5 Process flow of gauge production... 6
Figure 2-1 Demand forecast of main products for gauge assembly line...9
Figure 2-2 Space available for the new gauge assembly line... 11
Figure 4-1 Exam ple of relationship diagram ... 17
Figure 5-1 Operation Process Chart (OPC) of the gauge assembly line ... 23
Figure 5-2 Relationship diagram of the gauge assembly line (step 1) ... 27
Figure 5-3 Relationship diagram of the gauge assembly line (step 2)...27
Figure 5-4 Relationship diagram of the gauge assembly line (step 3)...28
Figure 5-5 Initial space allocation for new gauge assembly lab ... 31
Figure 5-6 Workstations layout for new gauge assembly lab ... 34
Figure 5-7 The first block layout design for new gauge assembly lab...32
Figure 5-8 The second layout proposal for the new gauge assembly lab... 33
Figure 5-9 The third layout proposal for the new gauge assembly lab ... 34
Figure 5-10 Finalized block layout design for gauge assembly line ... 35
Figure 5-11 Kanban loop 1: from housing workstation to finish goods... 36
Figure 5-12 Kanban loop 2: from mechanical assembly workstation to curing supermarket.. 37
Figure 5-13 Kanban loop 3: from electronics assembly workstation to PCB supermarket ... 38
Figure 5-14 K anban loop for kits ... 39
Figure 5-15 Overview of Kanban-based pull system in the gauge assembly line...40
Figure 5-16 Kanbans of XT-0 and XT-1 types for Kanban loop 1 and loop 2 ... ... 42
Figure 5-17 Kanban board beside housing workstation... 42
List of Tables
Table 1-1 Demands of main products in year 2008 and 2009...5
Table 4-1 Example of nonflow relationship diagram ... 16
Table 4-2 Data needed for calculating space requirement ... ... ... 18
Table 5-1 Targeted cycle time of each workstation for future state (XTd)...21
Table 5-2 Targeted cycle time of each workstation for future state (Ultralite)...22
Table 5-3 Targeted cycle time of each workstation for future state (Select) ... 22
Table 5-4 Relationship chart for the company's gauge assembly line ... 25
Table 5-5 Ranked workstation relationships for gauge assembly line ... 26
Table 5-6 Space requirement for each workstations and machines ... 29
Table 5-7 Valuation metric for three layout proposals... 34
This page is intentionally left blank
Chapter 1 Introduction
1.1 Company background
The company is the world's leading oilfield services company supplying technology, information solutions and integrated project management for customers in the oil and gas industry to optimize reservoir performance. The company was founded in 1926, and today the company employs more than 79,000 people working in 80 countries. The company supplies a wide range of products and services from formation evaluation, seismic acquisition and processing, well testing and directional drilling to well cementing and stimulation, artificial lift and well completions, and consulting, software, and information management.
Singapore Integration Center is one of the company's largest research, development and manufacturing factory. The company Singapore focuses on Artificial Lift products. The 550,000 square foot plant has a full suite of manufacturing operations, ranging from foundry works producing castings for pumps, a large machine-shop to machine some of the major component parts, to several assembly-shops and full Quality Control testing facilities. SPE employs a make-to-order manufacturing model due to the nature of its products. Most of the orders are sold to internal customers such as Schlumberger's field services and other manufacturing centers [1], [2].
1.2 Introduction to main products
Three main production lines of the company Singapore produces the electric submersible pumps (ESPs), gas lift mandrels (GLMs) and down hole pressure/temperature gauges.
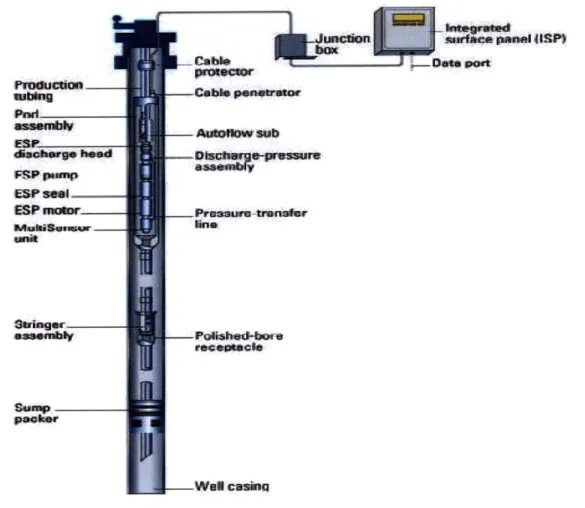
Gas Lift (GL) and Electric Submersible Pumps (ESP) are two major types of Artificial lift (AL), which is to use artificial means to facilitate the flow of oil from a production well. The company Singapore offers AL solutions for applications ranging from simple and economical to complex and high-temperature and high-pressure environments. Strength in AL products is a key component of the company's strategy to grow in the production market. Figure 1-1 and
Figure 1-2 are schematics of ESP and GL products by the company Singapore, respectively. The figures show the structure and complexity of the products.
pSne iSP) FP ESP@ IVea ESP ntr___ MAwase..wer unirt &flwp Presasor-trwnuser rous CIO. re@epacle Was c osing
Figure 1-1 Schematic of ESP products [3]
Page 2
Gas reducing density of fluid column
Side-pocket mandrel with gas-lift valve installed
Packer and tail-pipe
assembly
Figure 1-2 Schematic of GL product [31
ESPs are commonly used in deep wells where environmental conditions are complicated by high temperatures and pressures. To ensure good performance and safe operation of the ESPs, the company also provides monitoring systems, which is downhole monitoring gauge, to ensure the proper functioning of ESP product. The downhole monitoring gauges production line is the focus of this project.
The monitoring system includes the thermocouples, pressure sensors and vibration sensors, which together form the downhole gauge. It is built into the ESP products (Figure 1-2) and provides real-time feedback of the downhole operating environment. The information
obtained by gauge helps engineers to predict potential catastrophic conditions and to prevent ESP failure. By integrating technology and service, the company successfully provides an optimum lift system for the well and optimizes the pump and well performance while reducing costs for the customers.
Page 1 3
Figure 1-3 Gauge (blue parts) integrated in ESP [41
1.3 Gauge production overview 1.3.1 Gauge products
The gauge products consist of three major parts: the gauge electronics which include the pressure and vibration sensors as well as thermocouples, the choke which holds the gauge electronics and the housing which insulates and protects the electronics from outside environment and provides the connections between the gauge and other parts of the ESP.
There are several types of gauges produced in AFT Singapore. Although their functions are similar, their demands, sizes, weights, and prices are different. According to the current situation, XT, Select, Ultralite, and CTS are the most important four types of gauge products. And the demands for each type in year 2008 and 2009 are tabulated in Table 1-1. As shown in the table, due to the economic crisis in 2009, the total sales of gauge products drops from 3069 pieces in 2008 to 2246 pieces in 2009. The drop of the sales is mainly caused by the decrease of demand for XT products, which consist of the majority of the demand in both 2008 and 2009. However, the sales of Select, Ultralite and CTS increase from 2008 to 2009.
Page 1 4
-Table 1-1 Demands of main products in year 2008 and 2009
2008 2009
Types Sales Percentage Sales Percentage XT 2,481 80.84% 1,291 57.48% Select 112 3.65% 336 14.96% Ultralite 204 6.65% 253 11.26% CTS 272 8.86% 366 16.30% Total 3,069 100.00% 2,246 100.00% 1.3.2 Production process
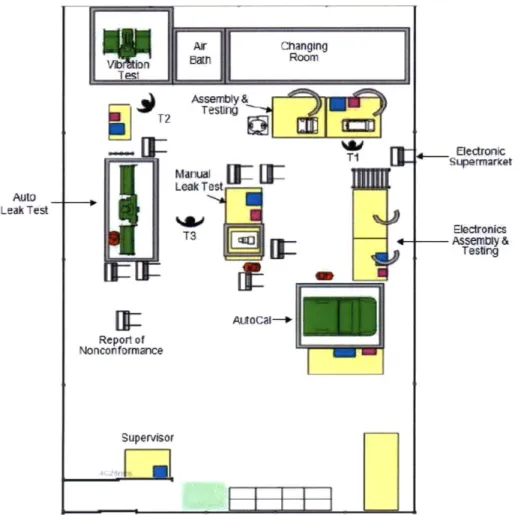
The gauge production is performed in the monitoring lab, an 80-square meter enclosed clean room with controlled indoor environment. The temperature and relative humidity are controlled at 21'C and 50% respectively to protect electronic components. Figure 1-4 is a schematic of the layout of the gauge production cell.
Air changing Bam Room Test U Assembty& JM T2 Testrg Electronic
MauW[7 7Ti suprmarket
Auto Leak Test
-1 Leak Test 1 ,9I
Figure 1-4 Schematic of the layout the gauge production cell
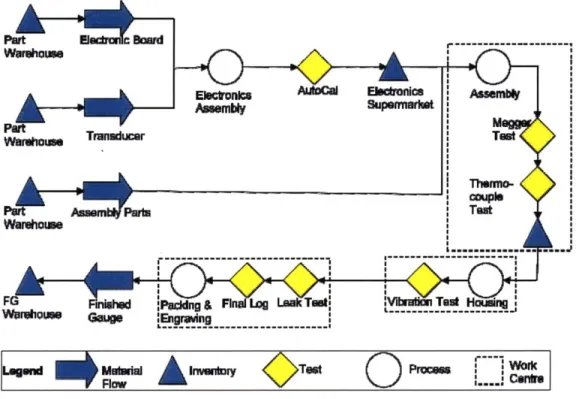
There are two major processes in assembling a gauge: the electronics assembly/auto-calibration and the mechanical assembly/testing. These two activities are initiated by different work orders, but the mechanical assembly activity needs the calibrated electronics as the essential part supply. Figure 1-5 shows the process flow of gauge production.
FG Fonhd :pgdng &Fin~u~Cii
"Mine !Pwg a in am kTod
kqgwid 110181018
A
lnvdury(I)
PTest Prt*No F1o A C>T" n
Figure 1-5 Process flow of gauge production
In the electronics assembly step, the gauge electronics is assembled from transducers and the printed circuit board (PCB) purchased from suppliers. The electronics then undergoes a 16-hour process in the auto-calibration machine in batches of 16, which performs tests with a range of temperatures and pressures to check the sensitivities of the sensors. If the PCB passes the tests on temperature and pressure, each one of them is then placed in a box and stored on the rack called "electronics supermarket". This supermarket is to buffer the mechanical assembly downstream.
In the mechanical assembly step, the calibrated electronics are first fixed into the choke, followed by the Meggar test to check the functionality of the thermocouples. The choke-electronics subassembly is then fixed into the steel housing, before it undergoes the vibration test, where the gauge is placed on a shake table with various acceleration magnitude and
frequency to check the sensitivity of the vibration sensors. The next step is the leak test, where high-pressure water is pumped into the gauge housing to check integrity of the gauge in the high-pressure downhole conditions. Finally the log test is performed to ensure every functional unit is intact. If the gauge passes all the tests, it is engraved with company logo, packaged with all test results in a disc and delivered to the customer. When a part of the gauge does not meet the specifications during a test, the failure is analyzed by the technician, who then decides whether the part will be reworked or reported and returned.
A report of non-conformance (RON) is generated for all parts which eventually fail the tests. These faulty parts are stored in the RON rack for a period of time and sent back to the suppliers if necessary. The figures below summarized the whole gauge assembly flow and current lab layout, respectively.
1.3.3 Current production
The production line operates with a make-to-order policy, or a pull system. After receiving orders from customers, the production planner schedules the production according to current production volume and capacity and assigns the due dates for the orders. Then work orders are released to the warehouse and the production line. Warehouse will help to prepare the kits according to the bill of materials (BOM), and deliver the kits to the gauge production cell for assembly.
The lab is now running 2 shifts per day, 5 days per week. And there are usually two to three operators working in each shift. In the 1" shift, operator A works on the electronics assembly and auto-calibration; operator B works on the mechanical assembly and Megger test; and operator C works on the housing, vibration test, leak test, final log test and packaging. In the
2nd shift, two operators work on mechanical assembly and housing to packaging, respectively.
Currently, the daily total output for this assembly line averages approximately 10 gauges.
1.4 Thesis outline
The thesis will describe the problem in the production line and state the objective in Chapter 2. In Chapter 3, a solid theoretical background will be provided. Then the methodology with preliminary analysis will be illustrated in Chapter 4. Chapter 5 will give, analyze and discuss
the results of each aspect that is covered in this thesis. Finally, Chapter 6 summarizes the thesis, gives recommendations for the company and discusses the future work.
Chapter 2 Problem Statement
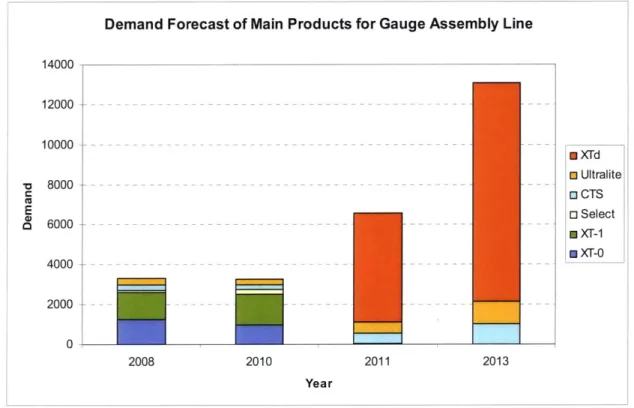
This thesis focuses on the challenge of redesigning the layout of gauge production line in order to increase throughput of the assembly line that will meet increasing customer demand. Figure 2-1 shows customer demands for products XTd, Ultralite, CTS, Select, XT- 1 and XT-0 from year 2008 to year 2013.
Demand Forecast of Main Products for Gauge Assembly Line
14000 12000 10000 ---m Xrd 8 Ultralite 8000 - --o CTS E o Select 6000 --- - --- 0 xr1 * XT-0 4000 --- --- -- - -2000 0 2008 2010 2011 2013 Year
Figure 2-1 Demand forecast of main products for gauge assembly line
As illustrated in Figure 2-1, the customer demand forecast will increase dramatically in the next few years. At first, the demand forecast almost doubles from 3200 pieces in 2010 to 6200 pieces in 2011. Moreover, the forecasting demand rockets to 13,000 pieces in 2013. In terms of daily demand, it is equal to 14 pieces per day in 2010, 28 pieces per day in 2011 and 58 pieces per day in 2013. However, currently, the production line can only build 10 gauges per day on average, which is too slow to fulfill the increasing demand.
Under this circumstance, the company plans to expand the current assembly cell, moving it to a new place whose size is twice as large as the current one. By redesigning the value stream of the assembly line and implementing kaizen events, the company could improve the
Page 9
---throughput of gauge production and meet the demand forecast. In order to achieve this goal, mixed model value stream mapping is employed to create both current and future state value stream map, identify improvement opportunities, balance workload and machine load, and redesign the assembly flow. During this process, several kaizen events will be implemented to eliminate waste, improve production rate and quality, and help to approach the future state value stream map. Finally, the floor layout plan for the new assembly line will be put forward.
This thesis describes the work focusing on the layout design of the new gauge assembly line. The current layout of the assembly line, as is shown in Figure 1-4, generally follows the flow of the assembly process and could meet the targeted takt time. However, there are certain critical problems in the current system and there is still room for improvement.
The current assembly flow might not meet the increasing demand because AutoCal step are processed in batch of 16 in stead of piece by piece while other steps are intended to follow a single piece flow but the technicians in each workstation are also used to assemble in batches. Therefore, the batch production culture makes the lead time much longer and WIP much higher than it could have been. The configuration of demand in 2011 and 2013 is different from that in 2010 as illustrated in Figure 2-1. It shows that type XTd gauge will count for majority of the total demand from 2011 onward. The problem with this is XTd gauge takes longer time in gauge assembly process, compared to the current high-runner XT-0 and XT-1 gauge, due to its new design, which will lead to insufficient capacity in gauge assembly workstation in 2011. In addition, Vibration, Leak Test and Packing workstations are a bit far from each other. The technicians have to spend time on walking among these stations, which is nonvalue-added.
The monitoring lab also needs expansion. Based on the current production rate, the assembly line still cannot meet the almost doubled demands in year 2011 even if it runs at its full capacity. And there is no extra space for new workstations and machines to increase the capacity. Thus, a monitoring lab with larger space is a prerequisite. In the early of 2010, the company has allocated a new room, which is a 19.4mX 18.5m square to gauge assembly for expansion as is shown in Figure 2-2. The layout design of the new lab is a key address of the project.
Figure 2-2 Space available for the new gauge assembly line In the final analysis, the summarized objectives of this thesis include:
* Determine the location and size of each workstation based on the new assembly flow and new plant area.
* Redesign the gauge assembly workstation.
* Physically realize the FIFO lane idea as suggested in value stream map for the future state.
* Propose a detailed design of pull system using Kanban, ranging from the physical Kanban design to the logistic mechanism.
Page | 11
Chapter 3 Theoretical Background
As stated in Chapter 2, a new gauge assembly line layout should be designed for the new plant area. It is an implementation of cellular manufacturing concept. Cellular manufacturing, different from normal "process organization", is oriented toward "product organization" and is well known among most manufacturing professionals. It is an application of Group Technology (GT), which is defined here as: a type of factory organization in which material processing is totally divided between organizational units (groups), each of which completes all the parts or assemblies it makes, through one or more major processing stages, and is equipped with all the machines and other facilities it needs to do so (Burbidge 1988, 1989a,
b)[5]. The goal of cellular manufacturing is to reduce setup times (by using part-family
tooling and sequencing) and flow times (by reducing setup and movement times, waiting times, and using small transfer batches) and, therefore, to reduce inventories and market response time [6]. In addition, it also contributes in promoting team work in the manufacturing plant (Fazakerly 1976)[5]. Therefore, many manufacturing companies incorporate cellular idea into their plant layout design.
The general procedures to design a cell are summarized as below: In the first step, the executive management should communicate the vision and champion the process, followed by developing detailed investigation and action plans by individual teams to prepare all the basic data and information that needed in the design step. Then, the teams should review the products process to identify nonvalue-added operations and develop solutions to eliminate them. After this preliminary work has been done, alternative plans should be developed, then modified and refined. And an optimum plan should be selected by comparing costs and intangibles. By then, the detail layouts, equipment specifications, procedures, people issues and implementation plans could be developed. In real industry practices, computer-aided programs are used to facilitate the cell design process, especially in load/utilization calculations, throughput time estimations and routing analyses [6].
After the paper plan gains consensus, then it can be implemented. In this step, several key points should be taken into consideration. Personnel issues are important for the success of
manufacturing cell formation. Initial resistance from operators is natural, but it is likely to subside after people have become involved with the design and /or operation of the cells. Also, a well-balanced workload among operators in the cell will also help to alleviate the resistance. In addition, volume/capacity imbalance is also a big concern when implementing the cell design. Product mix changes could easily dry up the cell load, which indicate the potential danger of designing cell that dedicated to a narrow range of product configurations. Therefore, mixed model value stream mapping should be deployed in both design and implementation step to solve this problem [7].
When it comes to the future of manufacturing cell design, as suggested by Selim et al., by taking workers and tools utilization issues into consideration, it will help to create more efficient manufacturing cell [8]. Papaioannou et al. pointed out that research focused on developing interactive support software for industrial use would be a trend in the near future
[9].
The plan of this project also follows the generally accepted five major planning phases in floor design: needs analysis, location analysis, block layout, detail layout and installation. The refined cycle time of each workstation and balanced workload, which is necessary information for needs analysis, is suggested by Lang [10]. In addition, the location and shape of the new plant is predetermined by the company. Therefore, location analysis step is not covered in this thesis. All the detailed approaches and methods used in this gauge assembly line layout design are discussed in Chapter 4.
Chapter 4 Methodology
4.1 Data Collection
First, short-term and long-term production quantity / volume projections were obtained from company's MRP system. Then, a Standardized Worksheet for each workstation was created with time study to show labor and equipment cycle time and sequential routings. Also, information on the current material handling methods was collected. Based on this information, the four types of gauges that the project focuses on was categorized into three product families according to the criteria suggested by Duggan, which is that the products that require about 80 percent of the same downstream processing steps are to be grouped into the same product family [7]. The further analysis and decisions are all based on this product family division.
4.2 Materials Handling Analysis
Material handling is the management of the continuous, synchronized flow of products and information through the whole manufacturing process. An effective material handling design will move materials directly to the production operators or make the distance between the operators and the materials as short as possible to eliminate waste.
In order to achieve that goal, the scope of the material handling system and the requirements for handling, storing and controlling material should be defined first. An Operation Process Chart (OPC) was created to graphically show the process flow as well as the material flow for this gauge assembly line. The OPC is used to indicate the affinities or closeness required between activities in terms of process flow, which will help to design the block layout in the next steps.
4.3 Relationship/Affinity Analysis
In the first step of relationship analysis, the workstations needed in the new assembly lab were discussed and determined. Then, the nonflow relationship diagram was created to show the relationship between each workstations or activities. Three workstations are analyzed here to show this idea in Table 4-1.
Table 4-1 Example of nonflow relationship diagram
1 2 3
1 U 0
2 0
3
In this chart, the capital letter assigned to each cross-sectional box shows the importance of this relationship, which are categorized into six types shown as below (in descending order of importance):
A - Absolutely must be placed close together;
E - Essentially beneficial if places close together;
I - Important to be placed close together;
o
- Ordinary closeness is acceptable;U - Locations relative to each other are unimportant;
X - Should never be together.
Therefore, one can easily tell the relationship of each activity to every other activity. Sometimes, the reason for the assigned importance category is also labeled in the lower part of each cross-sectional box. Also note that the number of relationships assigned to each category should be limited. These categories were defined in this thesis as:
A - 2%-5%;
E - 3%-10%;
I - 5%-15%;
o
- 10%-25%;U - the remaining functions.
Then the relationships were listed and ranked in descending order. After that, the relationships were diagramed to show the closeness of each relationship pair (see example in Figure 4-1).
411
1 3
5
2 9
Figure 4-1 Example of relationship diagram
In this diagram, the number of lines between different activities indicates the intensity of flow as well as the closeness between these activities. In this thesis, all the "A" relationship pairs are linked by four lines, "E" relationship pairs are linked by three lines while "I" relationship pairs are linked by two lines. If there is high volume of material flow and close production relationship, higher priority should be given to locate these two activities' stations near to one another.
4.4 Calculating Space Requirements
In order to calculate the space required for this assembly line, the quantities of workstations, machines and inventories that are needed in the new lab were determined first, and then the size for of each item was measured and recorded. The dimension of workstations and machines could be obtained directly from the measurement. As for the inventories and WIP storage, the space they need is estimated by multiplying the volume of each item with the inventory level. The dimension data needed is shown in Table 4-2. Note that additional 20% space was added to each workstation and machine to make sure that sufficient room had been left for technicians to sit and move.
Table 4-2 Data needed for calculating space requirement
Item Quantity Dimension Adjusted Dimension
Shuttle Kitting Station
PCB Pre-Assy Electronics Assembly
Test Jig Storage Vacuum Pump Auto Calibration Manual Calibration E-SuperMarket Mechanical Assembly Housing Curing WIP Vibration Auto Leak Test Manual Leak Test
WiFi Station CTS Station RON Trouble-shooting Trouble-Shoot Inv. Printer + Tel
Also note that there is FIFO lane between several workstations as WIP buffers. The calculation of FIFO lane size is covered in Lang's thesis [10]. Based on that, the FIFO lane structure and mechanism was determined, and the space that each FIFO lane needed was also estimated to see if it violated the restriction of space available.
4.5 Design Block Layout and Alternative Layouts
Based on the relationship analysis and space requirements, a feasible block layout was then proposed. The plant area, workstations, machines and WIP were all drawn to scale. And one to two alternative layout designs were also suggested at this stage for comparison. Then, through group discussion, an optimum layout was chosen. In the process of choosing the winning layout, the following factors were taken into consideration:
* The layout should facilitate the assembly flow and reduce the movement of parts and technicians as much as possible;
* Vibration room needs to remain at the same place;
* There is an electric panel taking part of the new plant's space. This is also an restriction for the design of the new layout;
* Auto-Calibration and Mechanical Assembly stations are likely to expand in order to meet the increasing demand. Therefore, spare room is needed for these changes at these stations;
" The layout should help the delivery of parts to the assembly workstations;
* PCB Calibration and mechanical assembly should be performed in Electrostatic Discharge (ESD) area.
4.6 Detailed Layout Design
At this stage, how to physically approach the optimal layout was determined. The exact location for each workstation and machine, the FIFO lane structure and mechanism, and the detailed workstation design were discussed.
4.7 Kanban System Design
Currently, the assembly line is adopting make-to-stock policy. The company has a lot of backlog orders now, which make the lead time, about 3 to 4 weeks, much longer than it should be. Therefore, the company has to keep a large inventory of raw materials and WIP. In
order to reduce the lead time and inventory level, the company decides to introduce Kanban system into the new assembly line, firstly implementing on the high runners, that is, XT and Select families. The procedures of Kanban design are as follows:
1. Identify the Kanban loops. In this step, the assembly line was divided into small subgroups. In each group, Kanban was flowing with the WIP. When Kanban came to the end of assembly flow in this subgroup and pulled by the downstream workstaion, this Kanban was returned to the beginning of the flow, which represented that another gauge needed to be assembled. In this way, Kanbans are circulated within their corresponding subgroups.
2. Calculate the Kanban quantity. After identifying the Kanban loops, the Kanban quantity needed for each loop was calculated to control the WIP level. The production in each loop will start only when a Kanban is returned to the beginning of the loop due to the pull from downstream workstations. In this way, the problem of over-producing could be eliminated. The formula for calculating Kanban quantity is
lead time x average demand x safety factor # of Kanbans=()
size of the container
3. Implementation of Kanban system. The last step is to physically implement the Kanban system. The physical Kanban was designed and produced. Kanban boards were also set up at designated workstations to visualize the current production of the assembly line.
Chapter
5
Results and Discussion
5.1 Basic Data Analysis
For the three main products in the future: XTd, Select, Ultralite, the cycle time needed in each workstation and process in the future were estimated and tabulated in Table 5-1, 5-2 and 5-3,
respectively. The targeted cycle time for future state is based on real production of current situation and is adjusted according to possible changes and process optimization. Standardized worksheets for each process were also created at the same time.
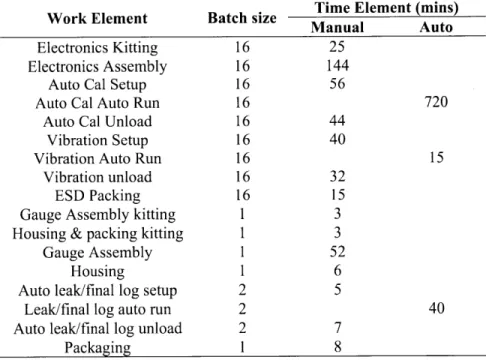
From these data, it is obvious that XTd and Select have similar cycle time in each work element and meet the family categorization criteria that share 80% of the downstream processes and less than 30% cycle time variance in each work element. These two types of gauges could be grouped into the same product family. Since these two types also count for the majority of the demands in 2011 according to the forecast, the layout design is therefore mainly based on the analysis of this product family. However, Ultralite needs less time in electronics and gauge assembly processes. It also have different process flow compared with other low runners such as WiFi and CTS. Therefore, Ultralite itself is considered as a separate product family.
Table 5-1 Targeted cycle time of each workstation for future state (XTd) Work Element Batch size Time Element (mins)
Manual Auto
Electronics Kitting 16 25 Electronics Assembly 16 144
Auto Cal Setup 16 56
Auto Cal Auto Run 16 720
Auto Cal Unload 16 44
Vibration Setup 16 40
Vibration Auto Run 16 15
Vibration unload 16 32
ESD Packing 16 15
Gauge Assembly kitting 1 3
Housing & packing kitting 1 3
Gauge Assembly 1 52
Housing 1 6
Auto leak/final log setup 2 5
Leak/final log auto run 2 40
Auto leak/final log unload 2 7
Packaging 1 8
Table 5-2 Targeted cycle time of each workstation for future state (Ultralite)
Work Element
Electronics Kitting Electronics Assembly
Auto Cal Setup Auto Cal Auto Run
Auto Cal Unload Vibration Setup Vibration Auto Run
Vibration unload ESD Packing Gauge Assembly kitting Housing & packing kitting
Gauge Assembly Housing
Auto leak/final log setup Leak/final log auto run Auto leak/final log unload
Packaging Batch size 16 16 16 16 16 16 16 16 16 1 1 1 1 1 1 1 1 Time Element Manual 25 120 56
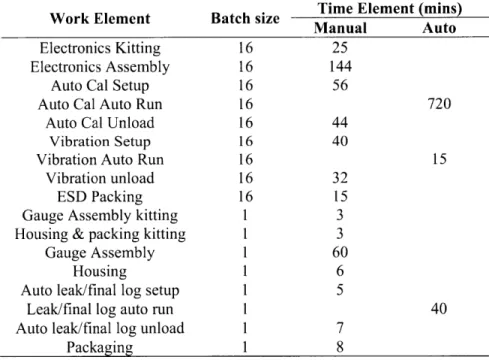
Table 5-3 Targeted cycle time of each workstation for future state (Select)
Work Element Batch size Time Element (mins)
Manual Auto
Electronics Kitting 16 25
Electronics Assembly 16 144
Auto Cal Setup 16 56
Auto Cal Auto Run 16 720
Auto Cal Unload 16 44
Vibration Setup 16 40
Vibration Auto Run 16 15
Vibration unload 16 32
ESD Packing 16 15
Gauge Assembly kitting 1 3
Housing & packing kitting 1 3
Gauge Assembly 1 60
Housing 1 6
Auto leak/final log setup 1 5
Leak/final log auto run 1 40
Auto leak/final log unload 1 7
Packaging 1 8
Page 22
(mins) Auto
5.2 Material Handling Analysis
Figure 5-1 shows the Operation Process Chart (OPC)
PCB r
Electronics
Assembly
(batch of 1(
Gauge
of the gauge assembly line.
RON Gauge Assembly Ma~ggr Test Housing Vibration Test
Leak Test Packing Finish Goods
Figure 5-1 Operation Process Chart (OPC) of the gauge assembly line
The material flows before gauge assembly process are PCBs in batch, which are light and easy to carry. But since these parts are vulnerable to unexpected electronic shocks, they should be stored and transported in ESD boxes. The material flow after the gauge assembly
Page
I
23 Legends:O
Assembly
Station
Testing
Material FlowA
Inventory
process are heavy, about 25kg each for XT type gauge. Currently, the technicians are dealing with the gauges in batches. After producing several gauges, the technician uses a big trolley to move them to the next station. In the new design, the production generally follows single piece flow principle. Therefore, several small trolleys, which will only carry one gauge, will be introduced into the plant to help the technicians move the assembled part to the downstream station and prevent them producing in batches at well.
In the new process, two kits, including gauge assembly kit and packing kit are transported from warehouse to the assembly line. One operator will replenish the kit inventories which are right beside the assembly station at a fixed interval. The traffic caused by kit replenishment would be taken into consideration in the relationship analysis and space calculation section. For the detailed mechanism of kit replenishment, please refer to Lang's thesis [10].
5.3 Workstation Relationship Analysis
5.3.1 Relationship Chart
After analyzing the assembly flow and determining the workstations needed in the new assembly lab, it is necessary to diagram the relationships between each workstations. The results are tabulated in Table 5-4, which are based on the survey of engineers and technicians in the assembly plant on one hand, and the understanding and requirement of the assembly flow on the other hand. As discussed in Chapter 4, the capital letter assigned to each pair stands for the importance and closeness of their relationship.
A - Absolutely must be placed close together;
E - Essentially beneficial if places close together;
I - Important to be placed close together;
o
- Ordinary closeness is acceptable;U - Locations relative to each other are unimportant;
X - Should never be together.
Also note the table is symmetric itself. Therefore, only half of the table is needed.
Table 5-4 Relationship chart for the company's gauge assembly line
1 2 3 4 5 6 7 8 9 10 11 12 13 14 15 16 17 18 19 20 1 U O U U U U U U U U U U U U U O U U U 2 O U U U U U U O U OO O U U O U U O 3 E U I O U U U U U U U U U O U U X 4 U E OO U U U U U U U U O U U X 5 E I U U U U U U U U U O U U X 6 I I U U U U U U U U O U U X 7 I U U U U U U U U O U U X 8 A O U U U U U U O U U X 9 OE U U U U U O U U X 10 I E U U U U O U U U 11 A U U U U O U U U 12 A A U U O U U U 13 O U U O U U U 14 U U O U U U 15 U O U U U 16 O U U U 17 OO U 18 A U 19 U 20
Legend: 1. Shuttle; 2. Kitting Station; 3.PCB Pre-Assembly 4. Electronics Assembly; 5. Vacuum Pump; 6. Auto Calibration; 7. Manual Calibration; 8. E-Supermarket; 9. Mechanical Assembly; 10. Housing; 11. Curing WIP; 12. Vibration; 13. Auto Leak Test; 14. Manual Leak Test; 15. WiFi Station; 16. CTS Station; 17. RON; 18. Trouble Shooting; 19. Trouble Shooting Inventory 20. Packing
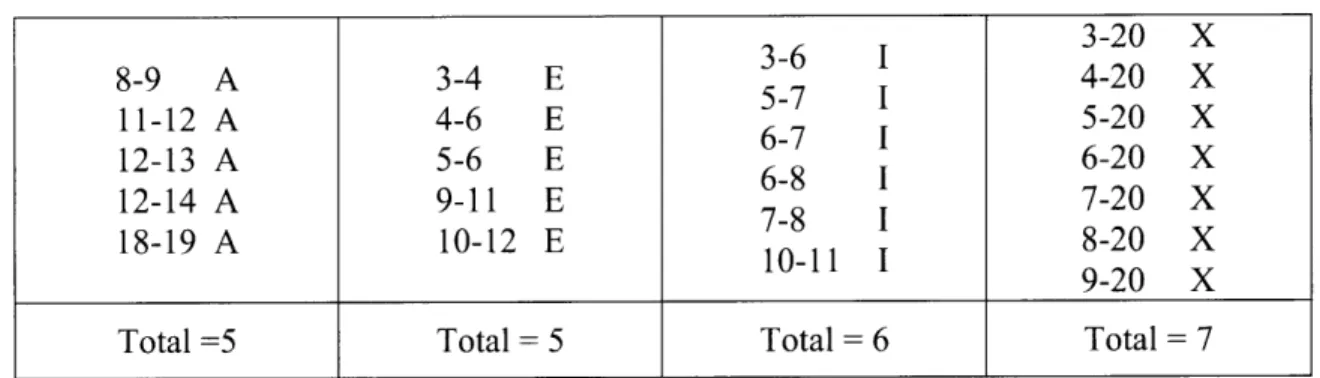
Based on the analysis, the relationship is ranked, listing in descending order of importance as is shown in Table 5-5, which facilitates constructing the block layout for this assembly line. Note that "0" and "U" relationships are not counted here since they do not have much priority in the layout design process.
Table 5-5 Ranked workstation relationships for gauge assembly line 3-6 I 3-20 X 8-9 A 3-4 E 5-7 I 4-20 X 11-12 A 4-6 E 6 5-20 X 12-13 A 5-6 E 6-8 1 6-20 X 12-14 A 9-11 E 7-8 I 7-20 X 18-19 A 10-12 E 10-11 I 8-20 X 9-20 X
Total =5 Total =5 Total =6 Total= 7
Then, the validity of the relationship classification is tested. Since there are altogether 20 workstations and activities, there should be a potential of 190 relationship pairs.
n(n -1) 20 x (20 -1) =190 (2)
2 2
,where n is the quantity of the workstations and activities.
For relationship category A, it counts for
5
- x 100% = 2.6% (3)
190
of the total relationship pairs, which conforms to the 2%-5% criteria. So it is with relationship category E, I, 0 and U, which count for 3%, 5%, 15% and 60% of the total relationship pairs, respectively. All of them meet the percentage requirement suggested in Chapter 4.
5.3.2 Relationship Diagramming
After the relationship chart is finalized, the next step is to diagram the relationship, which is also the basis for block layout design. In this project, the diagramming process is following the importance of relationships in the descending order. Firstly, the 5 category A relationships are diagrammed. Four lines are used to link these workstations to indicate the strong relationship between them. (The number in this section represents the same workstation or activity as in Section 5.3.1. Circle represents assembly workstation while triangle represents inventory in the following diagrams.)
Figure 5-2 Relationship diagram of the gauge assembly line (step 1)
Then, 5 category E relationships are added into the diagram. These relationships are linked by 3 longer lines, indicating the also strong relationships but not so close as the category A ones.
Diagram Step: 2
5 As (4 lines) 10
5 Es (3 lines)
Figure 5-3 Relationship diagram of the gauge assembly line (step 2)
Finally, 6 category I relationships are added into the diagram using 2 lines. However, the 0 relationships and U relationships are not included in the figure because their locations do not influence the effectiveness of the final layout. The location of these workstations are mainly
Page |27 Diagram Step: 1 5 As (4 lines) 8 _9 2 13 18 19 &18 1
determined by the availability of space after A, E and I relationship-involved workstations are allocated. Diagram Step: 3 5 As (4 lines) 5 Es (3 lines) 10 6 Is (2 lines)
Figure 5-4 Relationship diagram of the gauge assembly line (step 3)
From these diagrams, it is obvious that the workstations could be generally divided into three groups: electronic assembly group, mechanical assembly group and trouble shooting group. This division is also consistent with the three major functions in this assembly line.
As for those workstations and activities that are not included in the diagram because of their lower priorities, it could also be divided into three categories. Shuttle and kitting station form the first group, the main responsibility of this group is to prepare the parts needed in the assembly process and to help to present the parts to the workstations at the right time as well as at the right quantity. CTS workstation and WiFi workstation, respectively, are dedicated to the production of a specific gauge. The demands of these two gauges are not as large as the
Page 128
&18
XT and Select families and their operation processes are relatively independent from XT's. Thus, it is feasible to assign space for them after other stations' locations are determined. The last group includes the packing station and inventories. These stations are either storing dusty parts or packing the assembled gauge that could not meet the ESD standard. Therefore, it is necessary to assign separate space for these two stations.
5.4 Space Requirement Analysis
Before designing the block layout of the gauge assembly line, the dimension of each workstations and facilities were measured and determined according to the current situation. In this stage, only the workstation tables and machines were measured. Then, the results were multiplied by adjusted factor, 20% for this project, to leave enough space for technicians to sit and move. This adjustment is also necessary for the transportation and storage of parts and WIP. The results are tabulated in Table 5-6.
Recall that the total space available is 19.4m X 18.5m and the total space needed by the workstations listed above is only about 10mX 10m. Therefore, there is enough room left for inventory of parts and inspection.
Table 5-6 Space requirement for each workstations and machines
Item Quantity Dimension Adjusted Dimension
Shuttle 1 1.9 X 3 2.3 X 3.2
Kitting Station 1 0.8 X 1.1 1.1 X 1.4
PCB Pre-Assy 1 1.3 X 0.4 1.6 X 0.5
Electronics Assembly 1 2 X 1.3 2.4 X 1.5
Test Jig Storage 1 0.6 X 0.6 0.9X0.8
Vacuum Pump 1 0.6 X 0.6 0.9 X 0.8 Auto Calibration 3 1.5 X 1.8 1.8 X 2.05 Manual Calibration 1 1.3 X 1.4 1.55 X 1.7 E-SuperMarket 1 1.2 X 0.4 1.5 X 0.5 Mechanical Assembly 3 1.2 X 2.1 1.5 X 2.4 Housing 1 1.2 X 1.5 1.5 X 1.8 Curing WIP 1 IX 1.1 1.2 X 1.4 Page 29
(Continued)
Item
Vibration Auto Leak Test Manual Leak Test
WiFi Station CTS Station RON Touble-shooting Trouble-Shoot Inv. Printer + Tel Quantity 1I 1 1 1 1 1 1 1 l1 Dimension 2.5 X 2.2 1.6 X 3.6 1.8 X 1.7 1.2 X 1.7 1.2 X 1.7 0.7 X 0.5 1.8 X 1.2 0.6 X 0.4 1 X0.5 Adjusted Dimension 3.0 X 2.6 1.95 X 4.25 2.1 X 2.0 1.5 X 2.0 1.5 X 2.0 0.9 X 0.7 2.1 X 1.5 0.9 X 0.5 1.2 X 0.6
5.5
Block layout design
According to the analysis in section 5.3, there are three main function groups for this assembly line: electronic assembly group, mechanical assembly group and trouble shooting group. Firstly assign enough space for these three groups and then divide the rest of the room equally for inspection and inventory, respectively. The initial layout plan is roughly shown in Figure 5-5.
Then the workstations and machines are put into the assigned space of corresponding group. These workstations are arranged to follow the assembly sequence as much as possible. The results are shown in Figure 5-6.
Finally, WIP inventory, FIFO lanes and workstations for inspection and packing are added into this design. The parts receiving area and exits are also added. And the complete layout design is illustrated in Figure 5-7.
Figure 5-5 Initial space allocation for new gauge assembly lab
Figure 5-6 Workstations layout for new gauge assembly lab
... ... - ... .. .. ... .. ... ...
Figure 5-7 The first block layout design for new gauge assembly lab
In the same way, two alternative layout designs are put forward for comparison purpose. They are illustrated in Figure 5-5 and Figure 5-6. Since the office and inventory layouts are the same in all these three layout, only the layouts in the assembly lab are displayed for the alternative designs. The advantages and disadvantages for each of the layouts are discussed with the manager and the engineers. The main judging criteria for these layouts are:
" The layout facilitates the flow of the assembly process and does not interfere the transportation and presentation of parts.
e The layout does not cause large changes of the existing vibration room and exits.
" The layout enables the technicians finish their work with minimum movement
between workstations.
" The layout has sufficient space for WIP storage.
" The layout has sufficient space for the transportation of material handling equipment. In this new assembly line, 3 to 5 small trolleys are used to carry the sub-assembled gauge from upstream station to downstream station.
" The layout is robust enough for future expansion.
Figure 5-8 The second layout proposal for the new gauge assembly lab
Figure 5 hi D opos
Figure 5-9 The third layout proposal for the new gauge assembly lab
Based on the criteria listed above, the project team had a meeting and discussed with the engineers about the pros and cons for each of the layout proposal. A valuation metric (see Table 5-7) was created and the first layout became the winning design. Minor changes are made in the first design. And the finalized layout design is shown in Figure 5-10.
Table 5-7 Valuation metric for three layout proposals
Criteria Proposal 1 Proposal 2 Proposal 3
1. Facilitate the assembly flow. 5 3 5
2. Do not cause large changes of Vibration room. 5 5 5
3. Transport and deliver parts easily. 5 3 3
4. Minimize technician's movement. 3 1 3
5. Sufficient WIP storage space. 5 5 5
6. Material handling equipment consideration. 5 3 5
7. Robust for future expansion. 5 5 3
TOTAL 33 25 29
Remark: Each criteria is scored on a 5-3-1 basis. The larger the score, the better the layout performs in this criteria.
Figure 5-10 Finalized block layout design for gauge assembly line
5.6 Kanban design
Kanbans are introduced into the assembly line to make it a pull system, reducing WIP and the lead time. This is quite a new idea for this assembly line. Therefore, it is implemented on XT-0 and XT-1 types at first in order not to bring large changes to the production all at once. The discussions below are all based on the current situation.
5.6.1 Kanban Loops
For this whole assembly line, there are three Kanban loops and a Kanban-kit loop which
Page 135
... ... ... ... ... .... . . ... ... .... .... .
facilitates the assembly flow:
1. From housing workstation to finish goods. When the fully assembled gauge is shipped to the customer, the kanban associated with that gauge is returned to housing workstation to trigge a production order. At the same time, one set of kit which contains all the parts needed for packing process is also delivered to the assembly line.
Vibration
Leak Test and F.L Pull Finished G oods SupermarketPHu
A
I I 1 I I I U I 1 Pulled By CustomersFigure 5-11 Kanban loop 1: from housing workstation to finish goods
2. From mechanical assembly workstation to curing supermarket. This loop is linked to the previous loop. When housing workstation begins processing an order, it will pull one sub-assembled gauge in the curing supermarket. At the same time, a production kanban will be issued from curing supermarket to mechanical assembly workstation to signal a production. The technician in mechanical assembly workstation will pull one PCB from PCB supermarket to start the production
Page 1 36 Pull
I
... IM ... ... ... Gauge Curing SupermarketPull Pull Production I , Curing I Supermarket L Pulled by Housing Station
Figure 5-12 Kanban loop 2: from mechanical assembly workstation to curing supermarket
3. From electronic assembly workstation to PCB supermarket. When one PCB is pulled by mechanical assembly process, the left kanban will be returned to the electronic assembly workstation. Since the Auto-Calibration is running in a batch of 16, the electronic assembly will only start production when the kanban level accumulated to 16. This will slightly increase the safety inventory in PCB supermarket. However, this will enable the Auto-Calibration machine to run in full capacity, which avoids wasting the machine capacity.
Page 1 37
... ... .... . . MERNIMi dMdNIk__ - - - . __ , , - - _ _ __ - - _ _
PCB Supermarket Mechanical
Auto Calibration ESD Packing
-Electronics
Assembly Batch Productkon PCB Supermarket Pulled byMechanical
Assembly Station
Figure 5-13 Kanban loop 3: from electronics assembly workstation to PCB supermarket
4. Kanban-kit loop. This loop helps deliver kits for mechanical assembly and kits for packing to the assembly line. In this loop, mechanical assembly and packing workstations pulled their parts from their own kits inventory, respectively. The used kits are returned to kitting station and on-site kits inventories get replenished at a fix interval. This loops enables the parts present to the workstation at the right time and the right quantity. Therefore, it facilitates the continuous single piece flow from mechanical assembly workstation to packing workstation and reduces the WIP inventory. Page 138 Pull Woft Electronics Raw Material I nve nto ry
/ I
wft
)A6
-
UsIvetror--Pakn / rdcoPull
Pull
nr
Figure 5-14 Kanban loop for kits
Therefore, these three Kanban loops plus Kanban-kit loop are linked together to form the whole pull system. Downstream processes pulled from the upstream processes. Production will only start when Kanbans are issued to the start of the loop. By implementing this pull system, WIP will be better controlled to save the inventory cost.
Page 1 39
Mehanical
Assembly ... Kits Inventory For Mechanical Assembly %#IProduction
-acin
I
Pull Kanban netr Board0
El
00 Pulled By V 00 Material CustomersFigure 5-15 Overview of Kanban-based pull system in the gauge assembly line
I1
5.6.2 Determine Kanban Quantity
The Kanban quantity for each loop is calculated by Equation (1). For housing-to-packing loop, the lead time is 2 days (finish goods shipment cycle is 2 days) and the daily demands are 13 pieces per day for XT-1 type and 6 pieces per day for XT-0. Let the safety factor to be 1.1, therefore, the quantity of Kanbans needed for this loop is
XT-1: 13 x 2 x 1.1= 28 (4)
XT-0: 7x2x1.1=15 (5)
For mechanical assembly loop, the lead time is also 2 days (as described in Chapter 1, the mechanical assembled gauges have to be cured for 2 days) and the daily demands for XT-1 and XT-0 are 13 and 7 pieces per day, respectively. Also set the safety factor to be 1.1, the quantity of Kanbans for mechanical assembly loop is also
Page 1 40
. .... . ... .... .... . ... . .... .. ... ... ...
XT-1: 13x2x1.1=28
XT-0: 7x2x1.1=15 (7)
As for the electronic assembly loop, it is different since in this loop, the PCBs are produced in a batch of 16 instead of single piece flow. The lead time is 12 hours for 16 pieces of PCBs. Also note that there are extra 40 pieces of XT-1 type gauges needed per month for redress purpose. The daily demands for XT-1 PCBs are 15 pieces per day and for XT-0 PCBs remain 7 pieces per day. Therefore, for this loop, PCB supermarket rather than fixed-level Kanbans is used to control the electronic assembly loop. The supermarket inventory adopts a continuous review policy. A minimum inventory level is preset and the electronic assembly will start only when the PCB supermarket level drops to a certain level. The minimum inventory level equals the safety stock that is able to provide calibrated PCBs to downstream process for a period of one day. Therefore, the minimum inventory level for XT- 1 type and XT-0 type is
XT- 1: Daily demand X lead time X safety factor- 15 x 1 x 1.75 26 (6) XT-0: Daily demand X lead time X safety factor =7 x 1 x 1.75 13 (7) The quantity of Kanbans for Kanban-kit loop is discussed in Liu's thesis [11]. According to his calculation, 20 sets of kits are needed for packing and mechanical assembly, respectively.
5.6.3 Kanban system implementation
Based on the design and calculation, physical Kanbans could be developed. The Kanban cards for housing-to-finish goods loop and mechanical assembly loop are shown in Figure 5-16. At the same time, two Kanban boards are set up beside mechanical assembly workstation and housing workstation, respectively (See Figure 5-17).
Figure 5-16 Kanbans of XT-0 and XT-1 types for Kanban loop 1 and loop 2
Figure 5-17 Kanban board beside housing workstation
The turnover rate of the Kanbans is two days. Every morning, the Kanbans are put onto the Kanban board one by one, representing the gauges need to be assembled today and the production schedule as well. Since the width of Kanbans are proportional to their
Page 142