Publisher’s version / Version de l'éditeur:
Plastics, Rubber and Composites, 39, 7, pp. 332-341, 2010-09-01
READ THESE TERMS AND CONDITIONS CAREFULLY BEFORE USING THIS WEBSITE.
https://nrc-publications.canada.ca/eng/copyright
Vous avez des questions? Nous pouvons vous aider. Pour communiquer directement avec un auteur, consultez la
première page de la revue dans laquelle son article a été publié afin de trouver ses coordonnées. Si vous n’arrivez pas à les repérer, communiquez avec nous à [email protected].
Questions? Contact the NRC Publications Archive team at
[email protected]. If you wish to email the authors directly, please see the first page of the publication for their contact information.
Archives des publications du CNRC
This publication could be one of several versions: author’s original, accepted manuscript or the publisher’s version. / La version de cette publication peut être l’une des suivantes : la version prépublication de l’auteur, la version acceptée du manuscrit ou la version de l’éditeur.
For the publisher’s version, please access the DOI link below./ Pour consulter la version de l’éditeur, utilisez le lien DOI ci-dessous.
https://doi.org/10.1179/174328910X12691245470518
Access and use of this website and the material on it are subject to the Terms and Conditions set forth at
Morphology of microinjection moulded polyoxymethylene
Kamal, M. R.; Chu, J.; Derdouri, S.; Hrymak, A.
https://publications-cnrc.canada.ca/fra/droits
L’accès à ce site Web et l’utilisation de son contenu sont assujettis aux conditions présentées dans le site LISEZ CES CONDITIONS ATTENTIVEMENT AVANT D’UTILISER CE SITE WEB.
NRC Publications Record / Notice d'Archives des publications de CNRC:
https://nrc-publications.canada.ca/eng/view/object/?id=7120f86a-4db9-4c0d-9e5b-1526d1a5a0c3 https://publications-cnrc.canada.ca/fra/voir/objet/?id=7120f86a-4db9-4c0d-9e5b-1526d1a5a0c3
Morphology of microinjection moulded
polyoxymethylene
M. R. Kamal*
1, J. Chu
1,2, S. Derdouri
3and A. Hrymak
4A microinjection moulding machine was used to obtain micromouldings of polyoxymethylene, in
order to study morphology development during the process. The method of design of
experiments was used to investigate statistically the effects of processing variables on the
microstructural features of the mouldings. The morphological features were identified by
microtoming the samples in both transverse and longitudinal (flow) directions and observing
the microtomed sections under a polarised light microscope. Morphology evolution along the flow
direction was followed by microtoming the specimens along the centre plane longitudinally and
sequentially. A five-layer skin core structure was identified for micromoulded polyoxymethylene.
The development of the structure was explained, based on mechanisms which were similar to
those proposed for conventional injection moulding. Injection speed was found to be the most
significant factor affecting morphological features of the final moulding. Moreover, the average
plunger velocity, which is directly related to the cavity filling flow rate, was found to have good
correlation with skin layer thickness. The distributions of crystalline polymorphs were observed
and explained, in light of the distributions of the flow and thermal patterns in the mould.
Morphology evolution along the flow direction reflected the distribution of pressure, temperature
and velocity of the polymer melt during the microinjection moulding process. The results provided
some indications regarding micromoulding mould design.
Keywords: Microinjection moulding, Morphology, Polarised light microscopy, Polyoxymethylene
This paper is part of a special issue on Microinjection moulding of polymers
Introduction
The use of micromoulding to produce very small plastic parts is growing due to demands by electronics, biomedical and other industries for such parts and for the production of components for complex microelec-tromechanical systems.1 The polymer microinjection moulding (micro-IM) process has the potential to produce repetitively and consistently large numbers of microcomponents with complex shape and high surface quality at low cost. Such parts are essential for the manufacturing of microsystems.
It is generally recognised that the final properties of injection mouldings are strongly dependent on morphol-ogy, orientation and residual stresses.2–5Despite the fast growth of micro-IM manufacturing technology, little effort has been devoted to studies of microstructure development in the micro-IM process and to relate
microstructural characteristics to processing conditions and/or product properties. The microstructural char-acteristics are especially important for micro-IM because of the large ratio of skin layer thickness/total sample thickness, in comparison with this ratio for conventional injection moulding. The characterisation of microstructure and properties of microparts remains difficult because of the small dimensions involved. Thus, it is necessary to develop special experimental devices in order to adapt the commonly used methods of polymer characterisation.6,7For example, great care is required to release the stresses causing microtomed cross-sections to curl during sectioning of micromouldings.
Skin core morphology has been reported by Whiteside et al.,8 Ito et al.9 and Chu et al.6,10 for microinjection moulded high density polyethylene (HDPE), polypro-pylene (PP) and polyoxymethylene (POM). However, detailed studies of microstructure development under the extreme shear rates and thermal gradients prevailing during micro-IM and the relationships between mor-phology and processing conditions have not been reported. Therefore, in the following paragraph, the authors highlight some of the results reported in the literature relating to morphology development in con-ventional injection moulding for similar semicrystalline materials.
1Department of Chemical Engineering and CREPEC, McGill University,
Montreal, QC, Canada
2Micromolding Solutions Inc., Boucherville, QC, Canada
3Industrial Materials Institute, National Research Council, Bouchrville, QC,
Canada
4Department of Chemical Engineering, McMaster University, Hamilton,
ON, Canada
*Corresponding author, email [email protected]
332
ßInstitute of Materials, Minerals and Mining 2010 Published by Maney on behalf of the Institute Received 7 December 2009; accepted 25 June 2010
Clark11–13studied the development of morphology for injection moulded tensile test bars of POM (Delrin 500 NC-10 acetal resin). He proposed a three-zone model. A well defined skin layer occurs at the surface, within which lamellae are oriented perpendicular to both the surface and to the flow direction. In the next layer, termed ‘transcrystalline layer’, a distinct change in morphology is observed. The lamellae remain perpendi-cular to the surface of the bar but lose their preferred orientation with respect to the flow direction. Farther away from the surface, a second, diffuse boundary is found, which results from the development of a spherulitic core having no preferred orientation of the lamellae. An extensive study was carried out by Tan and Kamal14to characterise the morphology and orientation in injection moulded HDPE. Four distinct morphologi-cal zones were observed in these cross-sections. Type I is a non-spherulitic structure, which does not exhibit the Maltese cross-pattern. It forms at the surface or close to the surface of the moulding in the zone commonly referred to as the skin of the moulding. Type II contains very fine asymmetric spherulites of almost uniform size. These are spherulites that are formed under large thermal gradients. Under these conditions, the nuclea-tion rate is very fast, thus limiting the size of the spherulites. Type III contains asymmetric oblate spher-ulites with axis of symmetry in the depth direction (i.e. in the direction of the thermal gradient). These spherulites have a higher growth potential. Type IV contains randomly nucleated spherulites that grow in all direc-tions, until impingement halts growth.
In the present work, a micro-IM machine was used to obtain micromouldings of POM, in order to study morphology development in the micro-IM process. The method of design of experiments (DOEs) was used to investigate statistically the effects of machine settings on the microstructural features of the mouldings. The morphological features were identified by microtoming the samples in both transverse and longitudinal (injection flow) directions and observing the microtomed sections under a polarised light microscope. Morphology evolu-tion along the flow direcevolu-tion was followed by microtom-ing the whole specimen along the centre plane longitudinally and sequentially. The commercial software Moldflow was used to estimate the distribution of temperature during the micro-IM process.
Experimental
A Battenfeld Microsystems 50 (Battenfeld Technologies, Kottingbrunn, Austria) all-electric moulding machine was used for the micromoulding process. The machine features a plunger injection system, which consisted of a screw plasticising unit, an injection unit and a metering unit. The machine maximum clamping force, injection speed and injection volume were 50 kN, 760 mm s21
and 1100 mm3respectively.
The material selected for the present study was POM homopolymer (Delrin 900P; melt flow index (MFI), 11 g min21; E. I. DuPont, Wilmington, DE, USA). Other
details regarding machine instrumentation for process monitoring and data acquisition, mould design and experimental design have been reported elsewhere.6,10
The DOE method was employed in order to investigate the effects of machine variables on the characteristic process parameters. The machine variables
selected, for the system under consideration, were injection speed Vi, packing velocity Vp, mould
tempera-ture Tm and barrel temperature Tb, which are the key
moulding settings for the micro-IM process. The barrel temperature was kept constant for POM, to avoid significant thermal degradation. Therefore, a two-level three-factor full factorial design was chosen. Table 1 displays the DOE experimental matrix for the three materials. Statistical analysis was carried out, using the Design-Expert 6?0 analysis software. The injection speed high limit was used only in additional runs for HDPE and POM due to potential leakage through the back of the plunger at this limit.
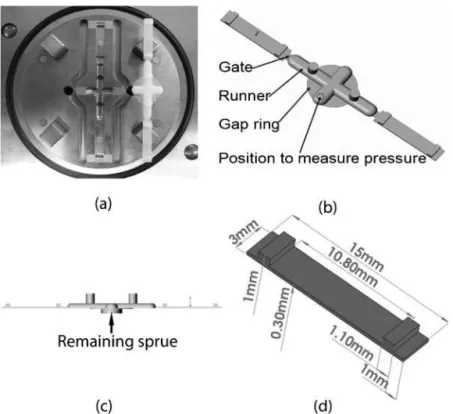
The Battenfeld ‘Master Mold’ concept and a square plate insert of simple geometry were used in the study, as shown in Fig. 1a. Figure 1b displays a three-dimensional view of the final moulding, modelled with computer aided design software. The final moulding consisted of two parts at each end and a runner system, including the remaining sprue, gap ring, two blind runners and two branch runners connected with two gates. Figure 1c displays a side view of the whole moulding.
The thickness of the remaining sprue after moulding depends on the plunger stroke during the packing stage, ranging from 0?1 mm, the minimum allowed to protect the mould insert, to 0?7 mm, when both injection speed and packing velocity were set at low levels. The volume of the whole moulding, including a 0?99 mm thick sprue and 0?11 mm thick gap ring is 148 mm3, based on calculations using modelling software. Figure 1d displays detailed dimensions of a moulded part, which has a volume and surface area of around 18 mm3 and 112 mm2 respec-tively. Thus, the ratio of surface area/volume and the ratio of part weight/whole shot weight (including the runner system) were around 6 and 24% respectively.
The POM micromouldings were first cut into the shape of tensile bar, using a specially designed cutting die for easy accurate positioning.6The tensile bars were then cut into small pieces with a scalpel. The selected small pieces were then sectioned using a Leica Reichert Ultracut microtome (Vienna, Austria). Both longitudi-nal XZ and transverse YZ cross-sections were obtained at the designated positions, as illustrated in Fig. 2. Thin sections, 10 mm thick, were immersed in micros-cope immersion oil [resolve low fluorescence, low viscosity (150 cs), Stephens Scientific, Wayne, NJ, USA] for observation between crossed polarisers, using
Table 1 Experimental matrix for polyoxymethylene microinjection moulding study
Design of experi-ments * Cases Vi, mm s21 Vp, mm s21 T m, uC Tb, uC A B C D Case 1 150 1 70 205 Case 2 150 6 70 205 Case 3 380 6 70 205 Case 4 380 1 70 205 Case 5 380 1 100 205 Case 6 380 6 100 205 Case 7 150 6 100 205 Case 8 150 1 100 205 Case 9 265 3.5 85 205 Case10 650 6 100 205
an Olympus BX50 system microscope. The photomicro-graphs displayed in this paper were taken at 640, 6100 and 6200 magnifications in sequence. Thicknesses of various morphological layers were measured directly from the photomicrographs.
Results and discussion
Skin core morphology
Figure 3 displays the typical skin core morphology obtained with polarised light microscopy for a POM moulding (case 5). The image was taken at position F for a transverse cross-section at 640 magnification. It has been reported that, in conventional injection moulding of POM (Delrin 500 NC-10), the twisted lamellae structure occupied more than half of the cross-section.11 Figure 3 shows that this layer has been replaced by fine spherulites and oblates, in microinjection moulded POM (Delrin 900P).
Figure 4 shows the same morphology at a higher magnification of 6200, for the region from the surface
to approximately two-thirds of the total thickness (212 mm from the top surface). The direction of view is along the X axis of the plate, and the cold temperature surface of the plate appears at the top. In contrast with the three-layer structure reported for conventional injection moulded Delrin 500 NC-10 (Dupont acetal homopolymer),11–13 the following five distinct poly-morphs can be identified for the micromoulded Delrin 900P, as shown in Fig. 4:
(i) a non-spherulitic skin layer, having a high degree of chain orientation parallel to the injection direction (type I)
(ii) a twisted lamellae layer, which has a clear boundary with the skin (type II)
(iii) a fine asymmetric spherulitic layer (type III) (iv) an oblate spherulitic layer with axis of
symme-try in the depth direction, i.e. the direction of the thermal gradient (type IV)
(v) a random spherulitic core (type V).
The formation of these zones from the surface to the central core followed the sequence from type I to V.
1 a image of mould insert and final moulding, b three-dimensional view of whole moulding, c side view of whole mould-ing and d dimensions of three-dimensional moulded part
2 Designated positions for microstructural studies in POM (Delrin 900P) mouldings
Kamal et al. Morphology of microinjection moulded polyoxymethylene
However, the relative thicknesses of the five morpholo-gical layers varied with the processing conditions and with their positions along the flow direction. It was also observed that a type III structure appeared occasionally within the matrix of the type II structure. At the vent end of the flow, only types III, IV and V morphologies appeared within the cross-section. The development of the five-zone structure may be explained by the effects of the flow, pressure and stress fields on crystallisation behaviour, as reported for conventional injection moulding of POM and HDPE.12–14
The non-spherulitic skin layer crystallises during the mould filling stage. When the hot melt is forced under pressure into the cooled cavity of the mould, some entangled molecules will stick to the cold wall and crystallise, while others will flow by. This condition provides a mechanism for extension of connecting groups of molecules and crystallisation of a complex fibril.12 At high melt stress, the overgrowth of folded chain lamellae will be in a planar manner and the orientation of polymer chains in the lamellae will be parallel to the flow direction.
As in the case of conventional injection moulding of Delrin 500 NC-10, the skin layer of the microinjection moulded Delrin 900P appeared translucent under the white light optical microscope. This is probably because the untwisted lamellar morphology may have structures at a size comparable to the wavelength of visible light. Thus, it does not scatter light. The twisted lamellae layer, fine asymmetric spherulitic layer, oblate and spherulitic zones were opaque because of their larger morphological units. This similarity confirms that the mechanism of the development of the skin layer in micro-IM is similar to that of conventional injection moulding.
Upon completion of mould filling, the shear and extensional stresses decrease suddenly to a level deter-mined by the amount of additional melt packed into the mould, to compensate for shrinkage due to cooling and crystallisation. A discontinuity arises in the microstruc-ture, as the highly oriented skin morphology transits to the less oriented layers. Below this discontinuity, stress is insufficient for creation of fibril nuclei. Two competing mechanisms could exist for crystallisation below the skin:12 the continued growth of twisted lamellae from the skin layer and the creation of new (non-fibril) nuclei and the formation of spherulites.
In contrast to the case of conventional injection moulding, the formation of fine spherulites dominates in the micromoulding process due to very large thermal gradients in micro-IM. The twisted lamella region, which represents a wide region between the skin and spherulitic core in conventional injection moulding of POM, is very narrow or sometime absent in micro-IM, as shown in Figs. 4 and 5. Fine spherulites are formed under large thermal gradients because the nucleation rate is very high, thus limiting the size of the
spherulites.14 The competing mechanisms often result in a mixture of twisted lamellae with fine asymmetric spherulites near the skin interior boundary. The spherulitic size increases slightly towards the oblate layer.
Further towards the mid-thickness of the moulding, the temperature of the melt is so high that spontaneous nucleation cannot occur. This results in the second discontinuity in morphology, where the fine asymmetric spherulitic morphology changes to oblates of much larger size. The oblate layer is a product of the interplay between nucleation rate and growth rate, as influenced by the temperature distribution. The outside undergoes faster cooling than the interior, and the nucleation rate decreases sharply with increasing temperature upon proceeding inwards from the outside.15 This causes more growth to occur on the high temperature side of the nucleus.
A clearly defined spherulitic core appeared only in cases 5 and 6, as shown in Fig. 5. Here, the oblates start to grow earlier from a position closer to the upper and lower surfaces of the part. Thus, both time and space are available for random nucleation and subsequent growth in the core region, in the absence of large temperature gradients.
The skin layers are probably formed during the filling stage, which provides the orientation for structure development. The twisted lamella structure, fine asym-metric spherulites, oblates and spherulitic core are probably developed in the subsequent packing and cooling stages under low melt stress. Their relative volumes are determined, at least in part, by the rate of heat transfer to the mould wall.
It is worth noting that the morphology on the two sides of the spherulitic core is not symmetrical or
3 Microphotograph of cross-section 640
4 Five morphological zones in microinjection moulded POM part, viewed in transverse cross-section at
identical, especially in the skin layer and its neighbour-ing region. The morphology on the fixed plate side has more apparent twisted lamellae, a slightly brighter and thinner skin layer and larger spherulites in the fine asymmetric spherulite layer than in the corresponding zones on the moving plate side, which has better temperature control. Careful examination of the experi-mental set-up suggests that the non-symmetry in morphology is most likely due to the temperature imbalance between the moving plate and the fixed plate. The latter is in direct contact with the injection nozzle. Because the nozzle has a temperature close to the melt temperature of the material, the average temperature of the fixed plate is actually higher than that of the moving plate, which has better temperature control. This observation agrees with the report of Whiteside et al.,8 in which a thermal gradient in the fixed plate was measured, starting from the nozzle centre towards the vent end of the cavity. With a higher mould wall temperature, longer time is needed to reach the freezing point. Thus, less material crystallises during the filling stage and more spherulitic material is formed. Subsequently, the large surface of the moulding formed
on the fixed plate side will be referred to as the high temperature surface, while that formed on the moving plate side will be referred to as the low temperature surface.
Morphology variation with process conditions
Figure 5 shows the morphological zones across the whole thickness observed for the eight designed proces-sing conditions. The micrographs are taken in the middle of the transverse cross-section at position F, using the polarised light microscope at 6100 magnifica-tion. The direction of view is along the X axis of the plate, and the low temperature surface appears at the top. The narrowest spherulitic cores were found in cases 1 and 2, which involved the lowest injection speed and mould temperature. The packing velocity did not seem to be a significant factor in affecting the morphology. Increasing the injection speed from 150 mm s21in cases
1 and 2 to 380 mm s21in cases 3 and 4, while keeping
mould temperature constant, resulted in a significantly thicker oblate layer, a narrower skin layer and more frequent appearance of random spherulites among the oblates. Increasing the mould temperature from 70uC in
5 Morphology micrographs of microinjection moulded POM at position F for eight designed process conditions: numbers above each micrograph denote machine setting variables of injection speed (mm s21), packing velocity (mm s21) and
mould temperature (uC) respectively 6100
Kamal et al. Morphology of microinjection moulded polyoxymethylene
cases 1 and 2 to 100uC in cases 7 and 8, while keeping injection speed constant, resulted in slightly increased thickness of the oblate and spherulitic zones and an increased average spherulite size. In addition, the oblates were mixed with a number of small uniform spherulites. The effect of increasing both injection speed and mould temperature in cases 5 and 6 produced the combined effects of increasing them individually. The oblate layers started to grow from positions very close to the upper or lower surface, and a clearly defined random spherulitic core appeared between the two oblate layers.
In order to evaluate the effect of processing conditions on morphology quantitatively and statistically, the cross-section was divided into three morphological evaluation zones. The evaluation zone boundaries and the thicknesses of the three zones were roughly estimated from the photomicrographs of the transverse cross-sections. The skin layer thickness, denoted as Ts, was
defined as the sum of the skin thicknesses near both surfaces. Because fine spherulites appeared occasionally in the matrix of the narrow twisted lamellar layer, the combined thickness of the two layers was measured and denoted as Tft. The symmetric oblate layers and
spherulitic core were measured together and denoted as Tos, since a clearly defined random spherulitic core
does not always appear. In order to take into account thickness variation in the same specimen and among different specimens, three positions were selected from the microphotographs of the transverse cross-section for each specimen, and five specimens were selected for each processing condition.
The average values and standard deviations of measured thicknesses of the above three morphological evaluation zones are shown in Fig. 6. The skin layer thickness Ts, fine spherulite and twisted lamella layers
Tftand their sum TszTftapproximately follow a similar
pattern, while the combined thickness of the oblate and spherulitic layers Tos follows the opposite pattern, as
expected. The Tsranged from ,45 mm in cases 5 and 6
to 85 mm in cases 1 and 2, which accounted for 15–28% of the total thickness. The Tftranged from 82 to 133 mm,
which accounted for 27–44% of total thickness. The total percentage of the skin and fine spherulites and twisted lamella layers accounted for 42–72% of the total thickness. Compared to conventional injection
moulding, the optimisation of processing conditions in IM could be more critical for tuning the micro-structure needed to achieve the desired product proper-ties because of the larger fraction of the skin layer in micro-IM.
Figure 7 shows that injection speed was the most significant factor that affected the thicknesses of the morphological evaluation zones. Increases in injection speed resulted in a thinner skin layer, a thinner fine spherulite and twisted lamellae zone and, accordingly, a thicker oblate and spherulitic core. The mould tempera-ture had a similar effect, but to a lower extent. The injection speed/mould temperature interaction might also have noticeable effect on the microstructure development, as shown in Fig. 6. The above analysis highlights the importance of thermomechanical history in determining the size distribution of morphological zones in micro-IM.
The effect of mould temperature here agrees well with findings for conventional injection moulding of POM,12 polyethylene (PE),14PE/PP copolymer16and polybuty-lene terephthalate.17 Lower mould wall temperature and, thus, a higher temperature difference between the wall and the crystallisation temperature produce a greater depth of oriented structures because a thicker layer of melt reaches the crystallisation temperature during the filling and packing stages.
Few reports could be found regarding the effect of injection speed on morphology for conventional injec-tion moulding, since injecinjec-tion pressure is the primary process control variable for conventional injection moulding machines. The high injection speed setting in micro-IM results in high melt temperature due to shear heating at very high shear rate and requires high injection and cavity pressures.
In conventional injection moulding, the area fractions of the skin and shear zones for PE and PP homopolymer decrease linearly with melt temperature.4,14,18At higher melt temperature, less material is crystallised during the filling and packing stages, and more spherulitic material is present. The injection/cavity pressure will affect the microstructure, depending on the sensitivity of the freezing point to pressure. As the melt pressure increases by increasing the injection speed, the crystallisation temperature of the polyacetal melt increases by ,2uC/ 1000 psi increase in pressure.11Therefore, the greater is
6 Average thicknesses of three defined morphological evaluation zones for each process condition of POM experiments
7 Standardised effects of machine settings on defined morphological evaluation zones
the injection/cavity pressure, the greater is the tempera-ture difference between the crystallisation temperatempera-ture and the constant mould wall temperature, and hence, the thicker is the surface layer of preferred orientation. Since injection speed appears to be the most significant negative factor in affecting thickness of the skin layer and the most significant positive factor in affecting the oblate and spherulitic core layers, it is reasonable to suggest that shear heating plays a dominant role in the micro-IM process over high pressure during the filling and packing stages.
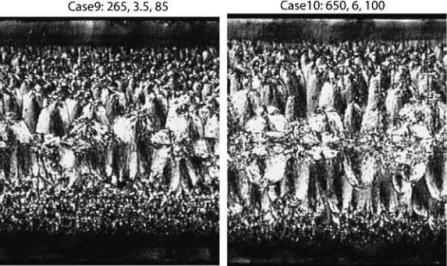
Figure 8 displays the morphology micrographs taken for case 9 (a centre point case) and case 10 (an extreme high injection speed case), in order to validate the above analysis. The morphological evaluation zones for the centre point case seem to conform to the above analysis. However, the morphology for the extreme high injec-tion speed case appears to be similar to those of cases 5 and 6, which have high injection speed and mould temperature.
Figure 9 displays the variation of the thicknesses of the defined morphological evaluation zones with injec-tion speed. Upon increasing the injecinjec-tion speed from 150 to 380 mm s21, the skin layer thickness and the
thickness of the fine spherulites and twisted lamella zone decreased significantly with increasing injection speed. Upon increasing injection speed further from 380
to 650 mm s21, the skin layer thickness decreased
slightly, while the thickness of fine spherulites and twisted lamellae remained almost constant. Accordingly, the thickness of the oblate and spherulitic core increased significantly with increasing injection speed from 150 to 380 mm s21 and then increased slightly when injection
speed increased from 380 to 650 mm s21. Since the
statistical analysis does not seem to be applicable for injection speeds exceeding 380 mm s21, it is reasonable
to speculate that the conventional viscosity model may not be applicable in the microscale cavity at high injection speed, possibly due to the slip occurring at polymer–mould, melt solidified polymer and melt–melt interfaces.
Because machine settings do not reflect the exact conditions to which the material is exposed, the variation in skin layer thickness with process conditions was compared to the variation with process conditions of the actual average plunger velocity and metering size, as shown in Fig. 10. The average plunger velocity is directly related to the cavity filling flowrate. The metering size is the optimised dosage for each set of machine variables, in order to have a uniform switch-over position (start of the packing stage) for each process condition. It is interesting to note that the variations of skin layer thickness and metering size followed a similar pattern, which was the inverse of the pattern of variation of the average plunger velocity.
8 Morphology microphotographs of microinjection moulded POM at position F for cases 9 and 10: numbers above each micrograph denote machine variables of injection speed (mm s21), packing velocity (mm s21) and mould temperature
(uC) respectively 6100
9 Morphology variation with injection speed
10 Relations between skin layer thickness and process conditions
Kamal et al. Morphology of microinjection moulded polyoxymethylene
These variation patterns reflect the effective thermo-mechanical history that the materials experience during the process. For example, although cases 5 and 6 have the same machine setting of injection speed as cases 3 and 4, the average plunger velocities of cases 5 and 6 were significantly higher than in cases 3 and 4 due to higher mould temperature. This resulted in significantly lower skin layer thickness and metering size in cases 5 and 6 due to increased melt temperature caused by combined shear heating and heat transfer.
Figure 11 shows the evolution of spherulite size with depth from positions D to F for both cases 2 and 5, where the injection speed and mould temperature were set to low levels in case 2 and high levels in case 5. In all four positions selected, the spherulite size increased from the interior of the skin layer towards the spherulitic core due to variation of cooling rate. At position F of case 5, the spherulite size decreased towards the spherulitic core. The smaller size of the spherulites in the core region is probably because growth is halted by impinge-ments among the growing spherulites in the core region and with neighbouring oblates. The evolution of spherulite size is a combined effect of pressure, shear stress and temperature distributions in the three-dimen-sional mould.14 First, fast cooling near the skin layer gives rise to small spherulites, while slow cooling close to the spherulitic core gives large ones.15 Second, the spherulites near the skin layer may be formed during the cavity filling and packing stages when the nucleation rate is enhanced by higher pressure and shear stress. Moving towards the core region, the material crystallises at a lower nucleation rate due to higher temperature, lower pressure and lower shear stress, so the spherulites grow to a larger size until impingement.
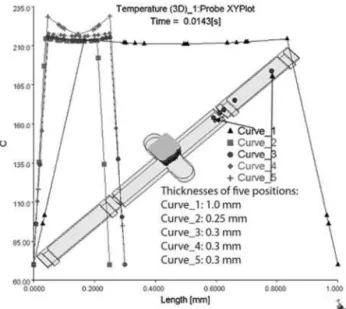
The spherulite size at the central core of position F was larger than that at position D, in both cases 2 and 5. The larger size of spherulites in the core region at position F could be attributed to the high bulk temperature of the material as a result of shear heating. This observation confirms the simulated temperature distribution (using Moldflow), along the flow direction at filling time of 0?0143 s (end of cavity filling), as shown in Fig. 12. The bulk temperature increased significantly from position 1, close to the end of runner, to position 5, close to the cavity end. The increase in material temperature was probably due to shear heating. The
average spherulite size in case 5 was significantly larger than that in case 2. This is probably due to the higher average bulk temperature of the material, as a result of larger shear heating effect at the higher injection speed, and lower heat loss to the mould wall in the case of high mould temperature.
It has been suggested for conventional injection moulding19,20 that polymers which form large spher-ulites upon crystallisation also exhibit higher crystal-linity than those associated with smaller spherulites. However, the former tend to be more brittle due to a greater concentration of defects, including voids, at the edges of the large spherulites, which need more time to reach a high degree of perfection. To avoid the negative effects of these defects, heterogeneous nucleating agents may be used in order to achieve smaller and more uni-form spherulitic structure across the sample thickness.
Morphology evolution along flow direction
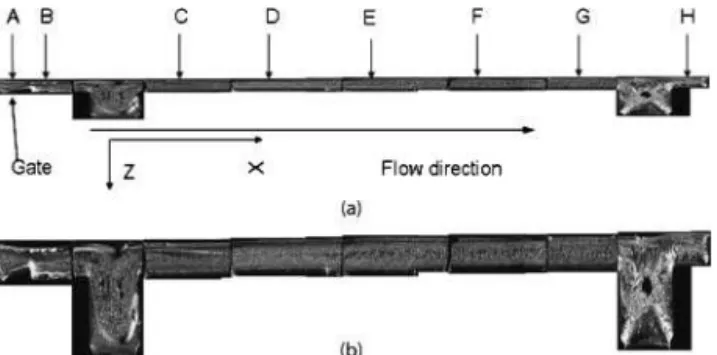
In order to more fully evaluate the effects of flow behaviour and heat transfer in the micro-IM process, the samples were cut first along the YZ plane into 10–12 slices and then cut longitudinally along the centre XZ plane into slices of 10 mm thickness. Microphotographs were taken in the longitudinal cross-section (XZ plane) for each specimen at 640 magnification, and the evolution of morphology was followed by placing the microphoto-graphs sequentially according to their original positions before cutting, as shown in Fig. 13. The development of morphological features along the flow direction, such as skin layer thickness, spherulitic core, voids caused by shrinkage in the rib region and the effects of flow patterns in the gate region could be seen clearly.
Figure 14 shows, at a higher magnification of 6100, morphology evolution in the longitudinal plane along the flow direction at positions B, D and F for POM case. The longitudinal cross-sections (XZ plane) are shown, with increasing distance from the gate, from left to right in the top row. The transverse cross-sections (YZ plane) of these positions are shown in the bottom row. The following observations can be made regarding the evolution of morphological features:
11 Spherulite distribution across moulding thickness for cases 2 and 5
12 Temperature distribution along flow direction at filling time of 0?0143 s (vertical axis units, temperature in uC)
(i) the skin layer morphology of the sample near the gate exhibits a V shape pattern in the interior part of the skin layer
(ii) the spherulitic core becomes thicker with increasing distance from the gate
(iii) at high mould temperature, the skin layers of the XZ cross-section appear to be more distinct and uniform than the corresponding layers in the YZ cross-section
(iv) the skin layer thickness decreases with increas-ing distance from the gate
(v) the cross-section morphology is not symmetric around the centre axis.
Figure 15 provides a quantitative indication of morpho-logical evolution in the flow direction. The thicknesses of the morphological zones were measured from position B to H. The skin layer thickness Ts decreased along the
length of the plate from 120 mm at position B near the gate to position H near the vent end, where no evidence of a skin layer was observed. Near the vent end, only fine spherulites, oblates and spherulitic core were present. In
the uniform thickness section, from position C to G, the thicknesses of the skin Ts and the fine spherulites and
twisted lamellae Tftdecreased almost linearly, except at
position E, where there was a hole ,20 mm deep, reserved for the installation of a pressure sensor. This finding agrees with the skin layer variation reported for conventional injection moulding12for a similar material, where the variation in skin layer thickness was attri-buted to variations in both velocities of the polymer melt during filling and pressure along the flow direction.
The melt velocity is high near the gate close to the mould surface. As a portion of the melt crystallises near the wall, large numbers of fibril nuclei are formed because of the high molecular orientation near the crystallising surface, due to the high velocity and shear rate of the melt. The melt velocity and shear rate decrease as the melt progresses from the gate to the melt front towards the vent end during the filling stage. Furthermore, the crystallisation temperature is high near the gate, and it decreases along the flow direction, reaching the lowest value at the vent end. These factors should contribute to a thinning of the skin layer as the melt progresses from the gate to the vent. The variation in thickness in the oriented skin layer along the flow direction for the microinjection moulded POM, shown in Fig. 15, confirms the above analysis. No mechanism exists at the vent end of the plate for molecular extension and creation of fibril nuclei, with the melt velocity decreasing towards a low value. Nucleation is initiated at random sites, and, in the absence of melt stress, crystallisation proceeds to form oblates near the wall and random spherulites in the core. Similar to the skin layer, the thickness of fine spherulites and twisted lamellae zone also decreases along the flow direction. This is probably due to the increase in bulk temperature of the melt caused by the viscous dissipation.
13 Morphology of XZ cross-sections a of microinjection moulded POM (case 7, 640) and b with tripled scale of width in Z direction
14 Evolution of morphology along flow direction for POM case 7: top row, longitudinal XZ cross-section at positions B, D and F; bottom row, YZ cross-section at the above positions 6100
Kamal et al. Morphology of microinjection moulded polyoxymethylene
The structure distribution along the flow length suggests that, during the mould design stage, it would be advisable to position the part of the moulding requiring high modulus and strength near the gate, where the skin layer thickness is high.
Conclusions
A five-layer skin core morphology was identified for microinjection moulded POM. The development of the structure was explained, based on similar considerations that explain morphology development in POM during conventional injection moulding. Statistical analysis showed that injection speed was the most significant factor influencing morphological features, while mould temperature had a similar but less pronounced effect. The average plunger velocity, which has direct relation with the cavity filling flowrate, was found to correlate well with the skin layer thickness. The effect of processing conditions on the variation in the distribution of spherulite sizes across sample thickness at different positions along the flow direction was qualitatively supported by the simulated temperature distribution. The skin layer thickness decreased along the flow
direction. This was attributed to the combined effects of melt velocity, pressure and temperature. The structure distribution along the flow length suggests that the part of the moulding requiring high modulus and strength should be placed near the gate, where the skin layer is thicker.
References
1. J Zhao, R. H. Mayes, G. Chen, H. Xie and P. S. Chan: Polym. Eng. Sci., 2003, 9, 1542–1554.
2. M. R. Kamal, D. M. Kalyon and J. M. Dealy: Polym. Eng. Sci., 1980, 17, 1117–1125.
3. V. Tan, M. R. Kamal and R. Musa: Proc. ANTEC 1976, Atlantic City, NJ, WI, Society of Plastics Engineers, 1976, 22, 339–343. 4. M. R. Kantz, J. Newman and F. H. Stigale: J. Appl. Polym. Sci.,
1972, 5, 1249–1260.
5. M. R. Kamal, A. I. Isayev and S. J. Liu: ‘Injection molding: technology and fundamentals’; 2009, Cincinnati, OH, Hanser. 6. J. Chu, M. R. Kamal, S. Derdouri and A. Hrymak: Proc. ANTEC
2008; 2008, Milwaukee, WI, Society of Plastics Engineers. 7. J. Chu: ‘Characterization of micro injection molding process and
its products’, PhD thesis, McGill University, Montreal, Canada, 2009.
8. B. R. Whiteside, M. T. Martyn, P. D. Coates, G. Greenway, P. Allen and P. Hornsby: Plast. Rubber Compos., 2004, 33, (1), 11– 17.
9. H. Ito, Y. Yagisawa, T. Saito, T. Yasuhara, T. Kikutani and Y. Yamagiwa,: Proc. ANTEC 2005; Boston, MA, Society of Plastics Engineers, 2005, 63, 693–697.
10. J. Chu, M. R. Kamal and A. N. Hrymak: Proc. ANTEC 2007; Cincinnati, OH, Society of Plastics Engineers, 2007, 65, 1985–1989. 11. E. S. Clark: SPE Journal, 1967, 23, (7), 46–49.
12. E. S. Clark: Appl. Polym. Symp., 1973, 20, 325–332. 13. E. S. Clark: Appl. Polym. Symp., 1974, 24, 45–53.
14. V. Tan and M. R. Kamal: J. Appl. Polym. Sci., 1978, 22, (8), 2341. 15. D. A. Hemsley, D. A. Curson, B. P. Saville, R. Hoffman, P. Calvert and N. C. Billingham: ‘Applied polymer light microscopy’; 1989, London/New York, Elsevier Applied Science.
16. S. J. Henke, C. E. Smith and R. F. Abbott: Polym. Eng. Sci., 1975, 15, (2), 79–82.
17. S. Y. Hobbs and C. F. Pratt: J. Appl. Polym. Sci., 1975, 19, 1701– 1722.
18. J. Bowman, N. Harris and M. Bevis: J. Mater. Sci., 1975, 10, (1), 63–76.
19. L. Barish: J. Appl. Polym. Sci., 1962, 6, (24), 617–623.
20. C. F. Hammer, T. A. Koch and J. F. Whitney: J. Appl. Polym. Sci., 1959, 1, (2), 169–178.
15 Morphology variation along flow direction for POM case 7