EUROPEAN ORGANISATION FOR NUCLEAR RESEARCH (CERN)
CERN-PH-EP-2014-200
Submitted to: Eur. Phys. J. C
A measurement of the ratio of the production cross sections for
W
and Z bosons in association with jets with the ATLAS
detector
The ATLAS Collaboration
Abstract
The ratio of the production cross sections for W and Z bosons in association with jets has been
measured in proton–proton collisions at
√
s = 7 TeV
with the ATLAS experiment at the Large Hadron
Collider. The measurement is based on the entire 2011 dataset, corresponding to an integrated
lumi-nosity of 4.6 fb
−1. Inclusive and differential cross-section ratios for massive vector bosons decaying to
electrons and muons are measured in association with jets with transverse momentum p
T> 30 GeV
and jet rapidity |y| < 4.4. The measurements are compared to next-to-leading-order perturbative QCD
calculations and to predictions from different Monte Carlo generators implementing leading-order
ma-trix elements supplemented by parton showers.
c
2018 CERN for the benefit of the ATLAS Collaboration.
Reproduction of this article or parts of it is allowed as specified in the CC-BY-3.0 license.
Eur. Phys. J. C manuscript No. (will be inserted by the editor)
A measurement of the ratio of the production cross sections
for W and Z bosons in association with jets with the ATLAS
detector
The ATLAS Collaboration
Received: date / Accepted: date
Abstract The ratio of the production cross sections for W and Z bosons in association with jets has been
measured in proton–proton collisions at √s = 7 TeV
with the ATLAS experiment at the Large Hadron Col-lider. The measurement is based on the entire 2011 dataset, corresponding to an integrated luminosity of 4.6 fb−1. Inclusive and differential cross-section ratios for massive vector bosons decaying to electrons and muons are measured in association with jets with
transverse momentum pT > 30 GeV and jet
rapid-ity |y| < 4.4. The measurements are compared to next-to-leading-order perturbative QCD calculations and to predictions from different Monte Carlo gener-ators implementing leading-order matrix elements sup-plemented by parton showers.
1 Introduction
Precise measurements of the production of vector bosons in association with jets are important tests of quantum chromodynamics (QCD) and provide con-straints on background processes to Higgs boson studies and to searches for new physics. The measurement of the ratio of W + jets to Z + jets1 production cross sec-tions, termed Rjets, directly probes the difference
be-tween the kinematic distributions of the jet system re-coiling against the W or Z bosons.
In comparison to separate W + jets and Z + jets cross section measurements, the Rjets measurement is
a more precise test of perturbative QCD (pQCD), since some experimental uncertainties and effects from non-perturbative processes, such as hadronization and CERN, 1211 Geneva 23, Switzerland
1 In this paper , W means a W+ or W−boson and Z is
defined as a Z or γ∗boson.
multi-parton interactions, are greatly reduced in the ra-tio. This allows precise comparisons with state-of-the-art Monte Carlo simulations and next-to-leading-order (NLO) perturbative QCD calculations to be made.
At low energies, the difference in vector-boson masses translates to a change in momentum transfer between incoming partons and thus different hadronic radiation patterns. In addition, the parton distribution functions of the proton (PDFs) imply different quark– gluon and quark–antiquark contributions to W + jets and Z + jets processes.
At very high energies, the vector-boson mass differ-ence is not large relative to the momentum transfer, so differences between W + jets and Z + jets production are expected to decrease, even though some differences in the parton distribution functions remain. A precise measurement of Rjetscan therefore be used, in the
con-text of searches for new particles or interactions beyond the Standard Model, to infer the W + jets contribution, given Z + jets production in the same phase space, or vice versa. The Rjetsmeasurement may also be sensitive
to direct contributions from new particle production, if the new particles decay via W or Z bosons [1]. New physics phenomena are generally expected to appear in various topologies with high-momentum jets or high jet multiplicities, highlighting the importance of studying QCD effects in those regions of phase space.
The ATLAS collaboration performed the first mea-surement of Rjetsas a function of the jet transverse
mo-mentum in events with exactly one jet in proton–proton
collisions at √s = 7 TeV, using a data sample
cor-responding to an integrated luminosity of 33 pb−1 [2]. This result demonstrated that the precision obtained in such a measurement is sufficient to be sensitive to the QCD effects mentioned above. The CMS collaboration performed an Rjets measurement of the jet
multiplic-2 The ATLAS Collaboration ity in vector-boson production with up to four
associ-ated jets, based on a similar dataset corresponding to an integrated luminosity of 36 pb−1 in pp collisions col-lected at √s = 7 TeV [3]. The results reported in this paper are based on a dataset corresponding to an in-tegrated luminosity of 4.6 fb−1, collected with the AT-LAS detector during the 2011 pp collision run of the
LHC at √s = 7 TeV. This dataset is over a hundred
times larger than the one used in previously published results, allowing improved precision over a much larger region of phase space as well as the study of previously inaccessible differential distributions.
The Rjets measurement is done for the electron and
muon decay channels of the W and Z bosons for jets
with transverse momentum pT > 30 GeV and
rapid-ity |y| < 4.4.2 The measurements of the electron and muon channels are performed in slightly different phase spaces and combined in a common phase space defined in terms of the pT and pseudorapidity η of the
lep-tons, the invariant mass of the Z boson, the angular separation between the two leptons3of the Z boson
de-cay, and the transverse mass4 of the W boson, as
pre-sented in Table 1. The W and Z selections are based on the W + jets and Z + jets cross-section measurements detailed in Ref. [4, 5], with a minor update in the Z selection to further reduce the uncertainty on the Rjets
measurement. In the results reported here, Rjetsis
mea-sured as a function of the inclusive and exclusive jet multiplicity (Njets) up to four jets. An extensive set of
differential measurements is also presented, in which Rjets is measured as a function of the transverse
mo-mentum and the rapidity of the leading jet, which is the one with largest transverse momentum, in events with at least one jet. The ratio Rjets is also presented
as a function of the transverse momentum and rapid-ity of the second and third leading jets in events with at least two or three jets respectively. A set of differ-ential measurements as a function of dijet observables in events with at least two jets is presented. The mea-surement of Rjets as a function of the summed scalar
2 ATLAS uses a right-handed coordinate system with its
origin at the nominal interaction point (IP) in the centre of the detector and the z-axis along the beam pipe. The x-axis points from the IP to the centre of the LHC ring, and the y-axis points upward. Cylindrical coordinates (r, φ) are used in the transverse plane, φ being the azimuthal angle around the beam pipe. The pseudorapidity is defined in terms of the polar angle θ as η = − ln tan(θ/2).
3 Angular separations between particles or reconstructed
objects are measured in η–φ space using
∆R ≡p
(∆φ)2+(∆η)2.
4 The transverse mass of the W boson is reconstructed as
mT =
q
2p`
TpνT(1 − cos(φ`− φν)) where p`T and pνTare the
transverse momenta of the charged lepton and the neutrino
respectively and φ` and φν their azimuthal directions.
pTof the jets (ST) for different jet multiplicities is also
reported. The results are compared to several Monte Carlo generators and with next-to-leading-order pQCD predictions corrected for non-perturbative effects.
The paper is organized as follows. The experimental setup is described in Sect. 2. Section 3 provides details on the simulations used in the measurement, and Sect. 4 discusses the event selection. The estimation of back-ground contributions is described in Sect. 5, and the procedure used to correct the measurements for detec-tor effects is described in Sect. 6. The treatment of the systematic uncertainties is described in Sect. 7. Section 8 discusses the combination of the electron and muon results. Section 9 provides details on the NLO pQCD predictions. Finally, Sect. 10 discusses the results, and Sect. 11 presents the conclusions.
2 The ATLAS detector
The ATLAS detector [6] is a multi-purpose detector with a symmetric cylindrical geometry and nearly 4π coverage in solid angle. The collision point is sur-rounded by inner tracking devices followed by a su-perconducting solenoid providing a 2 T magnetic field, a calorimeter system, and a muon spectrometer. The inner tracker provides precision tracking of charged particles for pseudorapidities |η| < 2.5. It consists of silicon pixel and microstrip detectors and a straw-tube transition radiation tracker. The calorimeter sys-tem has liquid argon (LAr) or scintillator tiles as ac-tive media. In the pseudorapidity region |η| < 3.2, high-granularity LAr electromagnetic (EM) sampling calorimeters are used. An iron/scintillator tile calorime-ter provides hadronic coverage for |η| < 1.7. The endcap and forward regions, spanning 1.5 < |η| < 4.9, are in-strumented with LAr calorimeters for both the EM and hadronic measurements. The muon spectrometer con-sists of three large superconducting toroids, each com-prising eight coils, and a system of trigger chambers and precision tracking chambers that provide trigger-ing and tracktrigger-ing capabilities in the ranges |η| < 2.4 and |η| < 2.7 respectively.
The ATLAS trigger system uses three consecutive levels. The Level-1 triggers are hardware-based and use coarse detector information to identify regions of inter-est, whereas the Level-2 triggers are based on fast online data reconstruction algorithms. Finally, the Event Fil-ter triggers use offline data reconstruction algorithms.
Lepton pTand pseudorapidity η pT> 25 GeV, |η| < 2.5
W transverse mass and neutrino pT mT> 40 GeV, pT> 25 GeV
Z invariant mass and lepton–lepton angular separation 66 < m``< 116 GeV, ∆R``> 0.2
Jet pT, rapidity and jet–lepton angular separation pT> 30 GeV, |y| < 4.4, ∆Rj`> 0.5
Table 1 Particle-level phase space of the present Rjetsmeasurement.
3 Monte Carlo simulation
Simulated event samples were used to correct the mea-sured distributions for detector effects and acceptance, to determine some background contributions and to correct theory calculations for non-perturbative effects. Signal samples of W (→ `ν, ` = e, µ)+jets and Z(→ ``, ` = e, µ)+jets events were generated with ALPGEN v2.13 [7], with up to five additional partons in the final state. It was interfaced to HERWIG v6.520 [8] for par-ton showering and fragmentation, with JIMMY v4.31 [9] for contributions from multi-parton interactions and with PHOTOS [10] to calculate final-state QED radi-ation. The CTEQ6L1 [11] PDFs were used with the AUET2-CTEQ6L1 tune [12], a set of specific non-perturbative event generation parameter values. Sim-ilar samples were produced with ALPGEN v2.14 in-terfaced to PYTHIA v6.425 [13] using the PERU-GIA2011C [14] tune and PHOTOS. They were used to estimate the uncertainties on non-perturbative cor-rections for parton-level NLO pQCD predictions. An additional set of signal samples was generated with SHERPA v1.4.1 [15,16] and CT10 PDFs [17]. Top quark pair production (t¯t) was simulated with ALPGEN and HERWIG+JIMMY, in the same configuration as for the signal samples. Additional t¯t samples were generated with the POWHEG-BOX generator v1.0 [18], using the CT10 next-to-leading order (NLO) PDFs and interfaced to PYTHIA v6.425. These additional samples were re-served for the evaluation of the systematic uncertain-ties. Single top-quark production, including W t produc-tion, was modelled with AcerMC 3.8 [19] interfaced to PYTHIA and MRST LO* PDFs [20]. The diboson
pro-duction processes W+W−, W Z, and ZZ were
gener-ated with HERWIG v6.510 and JIMMY v4.3 using the MRST LO* PDFs [20] and the AUET2-LO* tune [12]. The generated Monte Carlo (MC) samples were overlaid with additional inelastic pp scattering events generated with PYTHIA v6.425, following the dis-tribution of the average number of pp interactions in the selected data. The samples were then passed through the simulation of the ATLAS detector based on GEANT4 [21, 22] and through the related trigger simulation.
All samples were normalized to the inclusive cross section calculated at the highest pQCD order available. The W/Z+jets signal samples were normalized to the next-to-next-to-leading-order (NNLO) pQCD inclusive Drell–Yan predictions calculated with the FEWZ [23] program and the MSTW2008 NNLO PDFs [24]. The t¯t samples were normalized to the cross section calcu-lated at NNLO+NNLL in Refs. [25–30], and the dibo-son samples were normalized to cross sections calcu-lated at NLO using MCFM [31] with the MSTW2008 PDF set.
The simulated events were reconstructed and anal-ysed with the same analysis chain as the data. Scale factors were applied to the simulated samples to correct the lepton trigger, reconstruction, and identification ef-ficiencies to match those measured in data.
4 Event selection
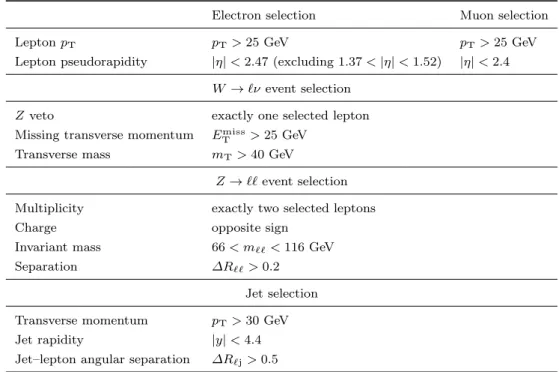
The data samples considered in this paper correspond to a total integrated luminosity of 4.6 fb−1, with an un-certainty of 1.8% [32]. Table 2 summarizes the kine-matic requirements for leptons, W bosons, Z bosons, and jets. The selection criteria for W boson candidates were defined using the largest possible coverage of the ATLAS detector for electrons, muons and jets. The se-lection criteria for Z boson candidates were modified with respect to those in Ref. [5], to be as similar as pos-sible to the W boson selection in order to maximize the cancellation of uncertainties in the Rjets measurement:
triggers requiring at least one lepton were employed, the minimum lepton transverse momentum was raised from 20 GeV to 25 GeV, tighter criteria were used to identify electrons and slightly looser requirements were placed on the second leading lepton with respect to the leading one.
The data were collected using single-electron or single-muon triggers, employing the same requirements for the W and Z data selections. Electron-channel events were selected using a trigger that required the presence of at least one electron candidate, formed by an energy cluster consistent with an electromagnetic shower in the calorimeter and associated to an inner detector track. Electron candidates were required to have a reconstructed transverse energy above 20 GeV
4 The ATLAS Collaboration
Electron selection Muon selection
Lepton pT pT> 25 GeV pT> 25 GeV
Lepton pseudorapidity |η| < 2.47 (excluding 1.37 < |η| < 1.52) |η| < 2.4
W → `ν event selection
Z veto exactly one selected lepton
Missing transverse momentum Emiss
T > 25 GeV
Transverse mass mT> 40 GeV
Z → `` event selection
Multiplicity exactly two selected leptons
Charge opposite sign
Invariant mass 66 < m``< 116 GeV
Separation ∆R``> 0.2
Jet selection
Transverse momentum pT> 30 GeV
Jet rapidity |y| < 4.4
Jet–lepton angular separation ∆R`j> 0.5
Table 2 Kinematic event selection criteria for W (→ `ν) + jets and Z (→ ``) + jets event samples.
or 22 GeV, depending on the trigger configuration of the different data periods. Muon-channel events were recorded using a trigger that required the presence of at least one muon candidate with transverse momen-tum above 18 GeV. Lepton trigger thresholds were low enough to ensure that leptons with pT> 25 GeV lie on
the trigger efficiency plateau.
Events were required to have a primary vertex, defined as the vertex in the event with the highest
summed p2
Tof all associated tracks, among vertices with
at least three tracks.
Electrons were reconstructed by matching clusters of energy found in the electromagnetic calorimeter to tracks reconstructed in the inner detector. Candidate electrons had to satisfy the “tight” quality requirements defined in Ref. [33], which include requirements on the calorimeter shower shape, track quality, and associa-tion of the track with the energy cluster found in the calorimeter. Electron candidates had to have pT >
25 GeV and |η| < 2.47, where the transition region be-tween barrel and endcap electromagnetic calorimeter sections at 1.37 < |η| < 1.52 was excluded.
Muons were reconstructed from track segments in the muon spectrometer that were matched with tracks in the inner detector [34], and were required to have pT> 25 GeV and |η| < 2.4. To suppress particles from
hadron decays, the leading muon had to be consistent with originating from the primary vertex by requiring |d0/σ(d0)| < 3.0, where d0 is the transverse impact
pa-rameter of the muon and σ(d0) is its uncertainty.
In order to suppress background from multi-jet events where a jet is misidentified as a lepton, the lead-ing lepton was required to be isolated. An additional pT- and η-dependent requirement on a combination of
calorimeter and track isolation variables was applied to the leading electron, in order to yield a constant effi-ciency across different momentum ranges and detector regions, as detailed in Ref. [35]. The track-based isola-tion uses a cone size of ∆R = 0.4 and the calorimeter-based isolation uses a cone size of ∆R = 0.2. The ac-tual isolation requirements range between 2.5 GeV and 4.5 GeV for the calorimeter-based isolation and between 2.0 GeV and 3.0 GeV for the track-based isolation. For muon candidates, the scalar sum of the transverse mo-menta of tracks within a cone of size ∆R = 0.2 around the leading muon had to be less than 10% of its trans-verse momentum.
Reconstructed W candidates were required to have exactly one selected lepton. The missing transverse mo-mentum in the event had to have a magnitude EmissT greater than 25 GeV, and the transverse mass mT had
to be greater than 40 GeV. The magnitude and az-imuthal direction of the missing transverse momentum are measured from the vector sum of the transverse mo-menta of calibrated physics objects and additional soft calorimeter deposits [36]. Reconstructed Z candidates were required to have exactly two selected leptons of the same flavour with opposite charge. Their invariant mass m`` had to be in the range 66 ≤ m`` ≤ 116 GeV
Jets were reconstructed using the anti-ktalgorithm
[37] with a distance parameter R = 0.4 on topological clusters of energy in the calorimeters [38]. Jets were re-quired to have a transverse momentum above 30 GeV and a rapidity of |y| < 4.4. Jets within ∆R = 0.5 of a selected lepton were removed. The energy and the di-rection of reconstructed jets were corrected to account for the point of origin, assumed to be the primary ver-tex, and for the bias introduced by the presence of addi-tional pp interactions in the same bunch crossing (“pile-up”). The jet energy was then calibrated to account for the different response of the calorimeters to electrons and hadrons and for energy losses in un-instrumented regions by applying correction factors derived from sim-ulations. A final calibration, derived from in-situ tech-niques using Z+jet balance, γ+jet balance and multi-jet balance, was applied to the data to reduce residual differences between data and simulations [39].
In order to reject jets from pile-up, a jet selection was applied based on the ratio of the summed scalar pT of tracks originating from the primary vertex and
associated with the jet to the summed pT of all tracks
associated with the jet. Jets were selected if this ratio was above 0.75. This criterion was applied to jets within |η| < 2.4, so that they are inside the inner tracker ac-ceptance. Comparison between data and simulation for various data periods confirmed that the residual impact of pile-up on the distribution of the jet observables in this analysis is well modelled by the simulation.
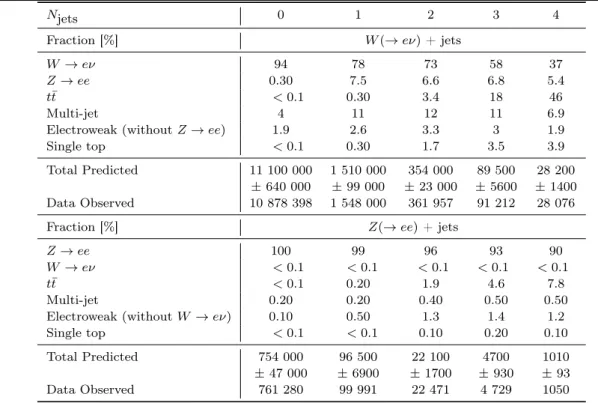
The numbers of W + jets and Z + jets candidate events in the electron and muon channels for each jet multiplicity are shown in Tables 3 and 4, together with the corresponding numbers of predicted events. The ex-pected fraction of predicted events from signal and each background source, determined as described in the next section, is also shown.
5 Background estimation
Background processes to W and Z boson production as-sociated with jets can be classified into three categories. The first category, referred to as electroweak back-ground, consists of diboson production, vector-boson production with subsequent decay to τ -leptons, and “cross-talk” background, in which the signal W + jets (Z + jets) production appears as background in the Z + jets (W + jets) sample. These background contribu-tions are relatively small (about 10% in the W + jets electron channel, about 6% in the W + jets muon chan-nel, and about 1% in Z + jets, as shown in Tables 3 and 4) and were thus estimated using simulated event sam-ples.
The second category consists of events where the leptons are produced in decays of top quarks. The t¯t component completely dominates the background con-tribution to W + jets events at high jet multiplicities, amounting to approximately 20% of the sample with W + ≥ 3 jets and increasing to approximately 45% for events with four selected jets. The effect is less dramatic in Z + jets events, where the t¯t background contributes about 5% to the sample of events with Z+ ≥ 3 jets and about 10% to the sample with four jets. The back-ground contribution from single top-quark production is about 4% of the sample in W + jets events for events with three or four jets, and smaller at lower jet mul-tiplicities. This contribution is even smaller in Z + jets events. Contributions from t¯t events to W + jets candi-dates with at least three jets, where this background dominates, were estimated with a data-driven method as described below in order to reduce the overall uncer-tainty. The t¯t contributions to W + jets candidates with fewer than three jets and to Z + jets events were esti-mated using simulated event samples, as are the con-tributions from single top quarks.
The third category of background, referred to as multi-jet background, comes from events in which hadrons mimic the signature of an isolated lepton. In the electron channel this includes photon conversion processes, typically from the decay of neutral pions, narrow hadronic jets and real electrons from the de-cay of heavy-flavour hadrons. In the muon channel, the multi-jet background is primarily composed of heavy-flavour hadron decay processes. This background cat-egory dominates at low jet multiplicity in W + jets events, amounting to 11% of the selected sample in both the electron and muon channels for events with one jet. Data-driven techniques were used to estimate this back-ground contribution to both the W + jets and Z + jets candidate events, as described below. The methods em-ployed to estimate background contributions with data-driven techniques in this analysis are very similar be-tween candidate events with W bosons and Z bosons and between electron and muon channels.
t¯t background
The t¯t background is the dominant background con-tribution to W + jets events with at least three jets, since each top quark predominantly decays as t → W b. The size of the t¯t contribution was estimated with a maximum-likelihood fit to the data.
The t¯t template in this fit was derived from a top– quark-enhanced data sample by requiring, in addition to the selection criteria given in Table 2, at least one b-tagged jet in the event, as determined by the MV1
6 The ATLAS Collaboration b-tagging algorithm of Ref. [40]. The chosen MV1
algo-rithm working point has a b-tagging efficiency of 70%. This data sample is contaminated with W signal events and electroweak and multi-jet backgrounds, amount-ing to about 40% in events with three jets and 25% in events with four jets. The contribution from W sig-nal events and electroweak background was estimated using simulation. The multi-jet contribution to the top-enriched sample was estimated using the multi-jet back-ground estimation method as outlined in the last part of this section, but with an additional b-tagging require-ment. Potential biases in the t¯t templates extracted from data were investigated using simulated t¯t events. Since b-tagging is only available for jets within |η| < 2.4 where information from the tracking detectors exists, the b-tagging selection biases some of the kinematic dis-tributions, most notably the jet rapidity distribution. To account for this, ALPGEN t¯t simulations were used to correct for any residual bias in the differential distri-butions; the maximum correction is 30%.
The number of t¯t events was extracted by fitting a discriminant distribution to the sum of three tem-plates: the top-enriched template after subtracting the contaminations discussed above, the multi-jet template (determined as described below) and the template ob-tained from simulation of the W + jets signal and the other background sources. The chosen discriminant was the transformed aplanarity, given by exp(−8A), where A is the aplanarity defined as 1.5 times the smallest eigenvalue of the normalized momentum tensor of the leptons and all the jets passing the selection [41]. This discriminant provides the best separation between t¯t and the W + jets signal. The fit to the transformed apla-narity distribution was done in the range 0.0–0.85 in each exclusive jet multiplicity of three or more.
Since the top-enriched sample is a sub-sample of the signal sample, statistical correlation between the two samples is expected. Its size was estimated using pseudo-datasets by performing Poisson variations of the signal and top-enriched samples. To account for this correlation, the uncertainty on the fit was increased by 15% for events with three jets and about 30% for events with four jets.
Multi-jet background
The multi-jet background contribution to the W + jets selected events was estimated with a template fit method using a sample enriched in multi-jet events. The templates of the multi-jet background for the fit were extracted from data, by modifying the lepton isolation requirements in both the electron and muon channels, in order to select non-isolated leptons. The
templates of the signal, the t¯t background, and the electroweak background were obtained from simulation. These templates were then normalized by a fit to the Emiss
T distribution after all signal requirements other
than the requirement on Emiss
T were applied.
To select an electron-channel data sample enriched in multi-jet events, dedicated electron triggers based on loose requirements were used (as defined in Ref. [33]), along with additional triggers based on loose electron and jet selection criteria. The background template dis-tributions were built from events for which the identi-fication requirements of the nominal electron selection failed, in order to suppress signal contamination in the template. Candidate electrons were also required to be non-isolated in the calorimeter, i.e. were required to have an energy deposition in the calorimeter in a cone of size ∆R < 0.3 centred on their direction greater than 20% of their total transverse energy. This selection re-sults in a data sample highly enriched in jets misiden-tified as electrons. As the luminosity increased during the course of 2011, the trigger selections were adjusted to cope with the increasing trigger rates. In order to build multi-jet template distributions that provide a good representation of the pile-up conditions of the se-lected data sample, these template distributions were extracted from two distinct data periods with high and low pile-up conditions. The background templates ex-tracted from the two different data periods were fitted separately and then combined into an overall multi-jet estimate.
To select the multi-jet sample in the muon channel, muon candidates were required to be non-isolated. The sum of transverse momenta of tracks in a cone of size ∆R < 0.2 centred on the muon-candidate direction had to be between 10% and 50% of the muon transverse momentum. The contamination from W signal events and electroweak and top backgrounds to the multi-jet sample was subtracted using simulation. It amounts to 1.4% for events with one jet and 4.8% for events with four jets.
The number of multi-jet background events was ob-tained for each jet multiplicity in the electron and muon channels by fitting the ETmissdistribution obtained from the W + jets data candidate events (selected before the application of the Emiss
T requirement) to the
multi-jet template and a template of signal and electroweak and t¯t backgrounds derived from simulations. The fit range was chosen to ensure significant contributions from both templates, in order to guarantee fit stabil-ity under systematic variations described in Sect. 7. The Emiss
T distribution was fitted in the range 15 GeV
to 80 GeV in the electron channel and in the range 15 GeV to 70 GeV in the muon channel.
The multi-jet background contribution to the Z + jets selected candidates was estimated using a tem-plate fit method similar to the procedure used in the W + jets case. In the electron channel, the template distributions for the multi-jet background were con-structed from a data sample collected with electron trig-gers looser than those used for the nominal Z → ee se-lection. Electrons were then required to satisfy the loose offline identification criteria (as defined in Ref. [33]) but fail to meet the nominal criteria. In the muon chan-nel, the jet template distributions for the multi-jet background were obtained from the nominal signal data sample, after relaxing the impact parameter sig-nificance requirement applied to Z → µµ events can-didates, and selecting events that did not satisfy the isolation criteria applied in the signal selection. The number of multi-jet background events was obtained for each exclusive jet multiplicity by fitting the
dilep-ton invariant mass distribution m`` in an extended
range, 50 < m`` < 140 GeV, excluding the Z-peak
region itself, after all other signal requirements were applied. Due to statistical limitations for jet multiplic-ities greater than two jets, the normalisation factor ob-tained from the two-jet bin was consistently applied to the templates for higher jet multiplicities. Potential bias in this procedure was accounted for in the systematic uncertainty estimate.
The evaluation of the systematic uncertainties for each background source is explained in Sect. 7.
6 Corrections for detector effects
The signal event yields were determined by subtract-ing the estimated background contributions from the data. After background subtraction, the resulting dis-tributions were corrected for detector effects such that distributions at particle level were obtained. The correc-tion procedure based on simulated samples corrects for jet, W and Z selection efficiency, resolution effects and residual mis-calibrations. While W + jets and Z + jets events were separately corrected before forming Rjets,
the systematic uncertainties were estimated for the ra-tio itself, as explained in the next secra-tion.
At particle level, the lepton kinematic variables in the MC-generated samples were computed using final-state leptons from the W or Z boson decay. Photons radiated by the boson decay products within a cone of size ∆R = 0.1 around the direction of a final-state lep-ton were added to the leplep-ton, and the sum is referred to as the “dressed” lepton. Particle-level jets were
iden-tified by applying the anti-kt algorithm with R = 0.4
to all final-state particles with a lifetime longer than 30 ps, whether produced directly in the proton–proton collision or from the decay of particles with shorter life-times. Neutrinos, electrons, and muons from decays of the W and Z bosons, as well as collinear photons in-cluded in the “lepton dressing procedure” were exin-cluded by the jet reconstruction algorithm. The phase-space requirements match the selection criteria defining the data candidate events, as presented in Table 2, in order to limit the dependence of the measurement results on theoretical assumptions.
The correction was implemented using an iterative Bayesian method of unfolding [42]. Simulated events are used to generate for each distribution a response matrix to account for bin-to-bin migration effects be-tween the reconstruction-level and particle-level distri-butions. The Monte Carlo particle-level prediction is used as initial prior to determine a first estimate of the unfolded data distribution. For each further itera-tion, the previous estimate of the unfolded distribution is used as a new input prior. Bin sizes in each distri-bution were chosen to be a few times larger than the resolution of the corresponding variable. The ALPGEN W + jets and Z + jets samples provide a satisfactory de-scription of distributions in data and were employed to perform the correction procedure. The number of it-erations was optimized to find a balance between too many iterations, causing high statistical uncertainties associated with the unfolded spectra, and too few it-erations, which increase the dependency on the Monte Carlo prior. The optimal number of iterations is typi-cally between one and three, depending on the observ-able. Since the differences in the unfolded results are negligible over this range of iterations, two iterations were used consistently for unfolding each observable.
7 Systematic uncertainties
One of the advantages of measuring Rjetsis that
system-atic uncertainties that are positively correlated between the numerator and denominator cancel at the level of their correlations (higher correlations result in larger cancellations). The impact on the ratio of a given source of uncertainty was estimated by simultaneously apply-ing the systematic variation due to this source to both the W + jets and Z + jets events and repeating the full measurement chain with the systematic variations ap-plied. This included re-estimating the data-driven back-ground distributions after the variations had been ap-plied.
Since the uncertainties were found to be symmetric within the statistical fluctuations, the resulting
system-8 The ATLAS Collaboration
Njets 0 1 2 3 4
Fraction [%] W (→ eν) + jets
W → eν 94 78 73 58 37
Z → ee 0.30 7.5 6.6 6.8 5.4
t¯t < 0.1 0.30 3.4 18 46
Multi-jet 4 11 12 11 6.9
Electroweak (without Z → ee) 1.9 2.6 3.3 3 1.9
Single top < 0.1 0.30 1.7 3.5 3.9
Total Predicted 11 100 000 1 510 000 354 000 89 500 28 200
± 640 000 ± 99 000 ± 23 000 ± 5600 ± 1400
Data Observed 10 878 398 1 548 000 361 957 91 212 28 076
Fraction [%] Z(→ ee) + jets
Z → ee 100 99 96 93 90
W → eν < 0.1 < 0.1 < 0.1 < 0.1 < 0.1
t¯t < 0.1 0.20 1.9 4.6 7.8
Multi-jet 0.20 0.20 0.40 0.50 0.50
Electroweak (without W → eν) 0.10 0.50 1.3 1.4 1.2
Single top < 0.1 < 0.1 0.10 0.20 0.10
Total Predicted 754 000 96 500 22 100 4700 1010
± 47 000 ± 6900 ± 1700 ± 930 ± 93
Data Observed 761 280 99 991 22 471 4 729 1050
Table 3 The contribution of signal and background from various sources, expressed as a fraction of the total number of
expected events for the W (→ eν) + jets and Z (→ ee) + jets selection as a function of jet multiplicity Njets together with the
total numbers of expected and observed events.
Njets 0 1 2 3 4 Fraction [%] W (→ µν) + jets W → µν 93 82 78 62 40 Z → µµ 3.4 3.5 3.5 3 2 t¯t < 0.1 0.20 3.1 19 46 Multi-jet 1.5 11 10 9.5 6.8 Electroweak (without Z → µµ) 1.9 2.7 3.4 2.9 1.9 Single top < 0.1 0.20 1.7 3.4 3.8 Total Predicted 13 300 000 1 710 000 384 000 96 700 30 100 ± 770 000 ± 100 000 ± 24 000 ± 6100 ± 1600 Data Observed 13 414 400 1 758 239 403 146 99 749 30 400 Fraction [%] Z(→ µµ) + jets Z → µµ 100 99 96 91 84 W → µν < 0.1 0.10 0.10 0.20 0.20 t¯t < 0.1 0.30 2.2 6.1 13 Multi-jet 0.30 0.50 0.90 1.1 1.7 Electroweak (without W → µν) 0.10 0.50 1.3 1.4 1.1 Single top < 0.1 < 0.1 0.10 0.20 0.20 Total Predicted 1 300 000 168 000 37 800 8100 1750 ± 79 000 ± 12 000 ± 2800 ± 660 ± 160 Data Observed 1 302 010 171 200 38 618 8397 1864
Table 4 The contribution of signal and background from various sources, expressed as a fraction of the total number of
expected events for the W (→ µν) + jets and Z (→ µµ) + jets selection as a function of jet multiplicity Njets together with the
(W → eν)/(Z → ee) Njets ≥ 0 ≥ 1 ≥ 2 ≥ 3 ≥ 4 Electron 0.89 0.92 0.93 0.97 1.0 JES 0.094 2.0 2.0 3.5 5.7 JER 0.25 2.4 3.5 4.3 6.4 Emiss T 0.19 1.7 1.2 1.2 1.0 t¯t 0.024 0.23 1.0 4.9 14 Multi-jet 0.81 1.6 1.5 2.2 6.2 Other backgrounds 0.12 0.57 0.58 0.76 1.0 Unfolding 0.20 0.56 0.86 1.2 1.4 Luminosity 0.062 0.26 0.27 0.34 0.44 Total 1.3 4.1 4.8 8.2 18 (W → µν)/(Z → µµ) Njets ≥ 0 ≥ 1 ≥ 2 ≥ 3 ≥ 4 Muon 1.1 1.2 1.1 0.86 0.87 JES 0.10 0.84 0.71 1.8 2.6 JER 0.094 1.6 1.8 2.6 4.2 Emiss T 0.30 1.0 0.94 0.97 0.99 t¯t 0.018 0.18 0.87 4.3 12 Multi-jet 0.20 0.60 1.1 1.7 2.7 Other backgrounds 0.21 0.24 0.28 0.42 0.60 Unfolding 0.22 0.59 0.90 1.2 1.2 Luminosity 0.10 0.12 0.11 0.088 0.023 Total 1.2 2.5 3.0 5.9 13
Table 5 Systematic uncertainties in percent on the measured W + jets / Z + jets cross-section ratio in the electron and muon
channels as a function of the inclusive jet multiplicity Njets.
atic uncertainties on the Rjets measurements were fully
symmetrized by taking the average value of the upwards and downwards variations.
Uncertainty sources affecting the Rjets
measure-ments can be assigned to one of the following categories: jet measurements, lepton measurements, missing trans-verse momentum measurement, unfolding procedure, data-driven background estimates and simulation-based background estimates. These sources of uncer-tainty feature significant correlations between W + jets and Z + jets processes, which have been fully accounted for as explained above. The systematic uncertainties on the t¯t and multi-jet background estimates were con-sidered to be uncorrelated between the W + jets and Z + jets selections. The uncertainty on the integrated lu-minosity was propagated through all of the background calculations and treated as correlated between W + jets and Z + jets so that it largely cancels in the ratio. The contributions from each of the sources mentioned above and the total systematic uncertainties were obtained by adding in quadrature the different components, and are summarized in Table 5. The total uncertainty on Rjets
as a function of the inclusive jet multiplicity ranges from 4% for Njets ≥ 1 to 18% for Njets ≥ 4 in the electron
channel and from 3% for Njets≥ 1 to 13% for Njets≥ 4
in the muon channel.
Jet-related systematic uncertainties are dominated by the uncertainty on the jet energy scale (JES) and res-olution (JER). The JES uncertainty was derived via in-situ calibration techniques, such as the transverse mo-mentum balance in Z + jets, multi-jet and γ−jet events, for which a comparison between data and simulation was performed [39]. The JER uncertainty was derived from a comparison of the resolution measured in di-jet data events using the bisector method [38], and the same approach was applied to simulated dijet events. The JER and JES uncertainties are highly correlated
between W + jets and Z + jets observables and are thus largely suppressed compared to the individual measure-ments. They are nevertheless the dominant systematic uncertainties in the cases where there are one or two jets in the events. The cancellation is not perfect because any changes in JES and JER are consistently propa-gated to the Emiss
T measurement event-by-event. This
causes larger associated migrations for the W selection than for the Z selection. In addition, the level of back-ground in the W + jets sample is larger, resulting in a larger jet uncertainty compared to the Z + jets selec-tion. The sum of JER and JES uncertainties on the Rjets measurement ranges from 3% to 8% in the
elec-tron channel and from 2% to 5% in the muon channel as Njets ranges from 1 to 4. The difference between the
two channels is due to the fact that the Z → ee back-ground in the W → eν data sample is much larger than the corresponding Z → µµ background in the W → µν sample, being about 7% for candidate events with one jet in the electron channel compared to 3% in the muon channel. The Z → ee background contam-inates the W → eν sample because one electron can be misidentified as a jet, contributing to the JES and JER uncertainties. This contribution to the uncertain-ties does not cancel in Rjets.
The uncertainty on the electron and muon selec-tions includes uncertainties on the electron energy or muon momentum scale and resolution, as well as uncer-tainties on the scale factors applied to the simulations in order to match the electron or muon trigger, recon-struction and identification efficiencies to those in data. Any changes in lepton energy scale and resolution were consistently propagated to the ETmissmeasurement. The energy- or momentum-scale corrections of the leptons were obtained from comparison of the Z-boson invari-ant mass distribution between data and simulations. The uncertainties on the scale factors have been derived
10 The ATLAS Collaboration from a comparison of tag-and-probe results in data and
simulations [33,34]. Each of these sources of uncertainty is relatively small in the Rjets measurement (about 1%
for Njets ranging from 1 to 4 in both channels).
The uncertainties in Emiss
T due to uncertainties in
JES, JER, lepton energy scale and resolution were in-cluded in the values quoted above. A residual ETmiss un-certainty accounts for uncertainties on the energy mea-surement of clusters in the calorimeters that are not as-sociated with electrons or jets. It was determined via in-situ measurements and comparisons between data and simulation [43]. These systematic uncertainties affect only the numerator of the ratio because no ETmiss cut was applied to Z+ jets candidate events. The resulting uncertainty on the Rjets measurement is about 1% for
Njets ranging from 1 to 4 in both channels.
The uncertainty on the unfolding has a component of statistical origin that comes from the limited num-ber of events in each bin of the Monte Carlo inputs. This component was estimated from the root mean square of Rjets measurements obtained in a large set of
pseudo-data generated independently from the W + jets and Z + jets Monte Carlo samples used to unfold the data. The Monte Carlo modelling uncertainty in the unfolding procedure was estimated using an alterna-tive set of ALPGEN samples for which the nominal W + jets and Z + jets production was modelled by differ-ent theoretical parameter values. The MLM matching procedure [44], employed to remove the double count-ing of partons generated by the matrix element calcula-tion and partons produced in the parton shower, uses a matching cone of size R = 0.4 for matrix element par-tons of pT> 20 GeV. To determine how the choice of
this cone size and the matching pTscale impact the
un-folded results, samples with variations of these parame-ters were used in the unfolding procedure. In addition, to account for the impact of changing the amount of radiation emitted from hard partons, ALPGEN Monte Carlo samples were generated with the renormalisation and factorisation scales set to half or twice their nomi-nal value of pm2
V+pT2V, where V is the W or Z boson
depending on the sample. The systematic uncertainty is the sum in quadrature of the differences with respect
to the Rjets measurement obtained from the nominal
samples. The overall uncertainty on the unfolding pro-cedure ranges between 0.6% and 1.4% for Njetsranging
from 1 to 4.
For backgrounds estimated using simulation, the uncertainty on the cross-section calculation was taken into account. The combined impact of these uncertain-ties on the Rjets measurement is typically less than 1%
for the different jet multiplicities.
For t¯t predictions taken from the ALPGEN sample, the uncertainty on the cross-section calculation is con-sidered, as well as a shape uncertainty by comparing
to the POWHEG-BOX t¯t sample. The largest
contri-bution to the total uncertainty from the data-driven t¯t estimate is from the statistical uncertainty on the fit. The systematic uncertainty on the data-driven t¯t es-timate also covers uncertainties on the contamination of the background template by signal events, on the choice of fit range and other small uncertainties. The latter include the uncertainties on the b-tagging effi-ciencies and uncertainties on the bias in the t¯t distri-butions when applying the b-tagging. The uncertainty on the contribution from W + heavy-flavour events to
the t¯t template, modelled by ALPGEN Monte Carlo
samples, was evaluated by varying the W +c cross sec-tion and the combined W +cc and W +bb cross secsec-tions. The size of the variations is a factor of 0.9 and 1.3 re-spectively. These factors were obtained from fits to the data in two control regions, defined as one or two jets and at least one b-tagged jet. This uncertainty, which is 3% of the number of t¯t events for Njets≥ 3, is largest
at lower jet multiplicities where the contribution from W +heavy flavour is most significant. The upper limit of the fit range in transformed aplanarity was varied from the nominal values of 0.85 to 0.83 or 0.87. The t¯t uncertainty dominates for final states with high jet multiplicity due to its increasing contribution, which does not cancel in Rjets. It amounts to an uncertainty
of 14% on the Rjets measurement in the electron
chan-nel and to an uncertainty of 12% in the muon chanchan-nel for events with at least four jets.
In the evaluation of the multi-jet background sys-tematic uncertainties, various sources were taken into account. For the W +jets selection, the uncertainty on the shape of the template distributions of the multi-jet background was studied by varying the lepton isolation requirement and identification definition. The nominal template fit range for Emiss
T was also varied, within
10 GeV up and down from the nominal limits. The distributions of the signal template were alternatively modelled by SHERPA instead of ALPGEN and the dif-ference was taken as an uncertainty. The statistical un-certainty on the template normalisation factor from the fit was also included. Finally, to evaluate the uncer-tainty on the estimate of the multi-jet background to the Z + jets events, the fit ranges and the modelling of the signal and of the electroweak contamination were varied in the same way as for the W + jets events. The combined impact of these uncertainties on the Rjets
measurement varies between 2% and 6% in the electron channel and between 1% and 3% in the muon channel for Njets ranging from 1 to 4.
8 Combination of electron and muon channels In order to increase the precision of the W + jets to Z + jets differential cross-section ratio measurements the results obtained for each observable in the electron and the muon channels were statistically combined, ac-counting for correlations between the sources of sys-tematic uncertainties affecting each channel. Since the electron and muon measurements were performed in different fiducial regions, bin-by-bin correction factors, estimated using ALPGEN Monte Carlo samples, were applied to each measured distribution to extrapolate the measurements to the common phase space defined in Table 1. The corrections to the Rjets measurement
are of the order of 6% in the electron channel and 1% in the muon channel. The uncertainties on the accep-tance corrections are below 0.5%, as determined by us-ing SHERPA instead of ALPGEN. By comparus-ing distri-butions computed at LO and NLO, it was checked with MCFM that NLO effects on the extrapolation to the common phase space are negligible. Before the combi-nation was performed, the individual results of the two channels were compared to each other after extrapola-tion; the results are compatible within their respective uncertainties.
The method of combination used is an averaging procedure described in Refs. [45, 46]. The distributions for each observable were combined separately by min-imising a χ2 function which takes into account the
re-sults in the extrapolated electron and muon channels and all systematic uncertainties on both channels. The uncertainties on the modelling in the unfolding proce-dure, the integrated luminosity, the background contri-butions estimated from simulations except for Z + jets and W + jets backgrounds and systematic uncertainties on the data-driven t¯t estimation were treated as cor-related among bins and between channels. The lepton systematic uncertainties were assumed to be correlated between bins of a given distribution, but uncorrelated between the two lepton channel measurements. The sta-tistical uncertainties of the data, the stasta-tistical uncer-tainty of the unfolding procedure, and the statistical uncertainty of the t¯t fit were treated as uncorrelated among bins and channels. The systematic uncertain-ties on multi-jet backgrounds, which contain correlated and uncorrelated components, are also treated as un-correlated among bins and channels. This choice has little impact on the final combined results and was cho-sen as it is slightly more conservative in terms of the total uncertainty of the combined results. Finally, the uncertainties from the jet energy scale, the jet energy resolution, the ETmiss calculation and the Z + jets and W + jets background contributions were treated as fully
correlated between all bins and do not enter into the combination procedure to avoid numerical instabilities due to the statistical component in these uncertainties. For the combined results, each of these uncertainties was taken as the weighted average of the corresponding uncertainty on the electron and muon measurements, where the weights are the inverse of the sum in quadra-ture of all the uncorrelated uncertainties that entered in the combination.
9 Theoretical predictions
The measured distributions of all the observables con-sidered in the analysis are compared at particle level to various pQCD predictions in the phase space defined in Table 1.
Next-to-leading-order pQCD predictions were cal-culated with BlackHat+SHERPA [47–49] at parton level for various parton multiplicities, from zero to four. In this calculation BlackHat is used for the compu-tation of the virtual one-loop matrix elements, while SHERPA is used for the real emission part and the phase-space integration. The fixed-order calculation is performed at parton level only, without radiation and hadronization effects. Renormalisation and factorisa-tion scales were evaluated at HT/2, where HT is
de-fined as the scalar sum of the transverse momenta of all stable particles in each event. The PDF set used was CT10 [17]. Partons were clustered into jets using the anti-ktalgorithm with R = 0.4.
The effect of uncertainties on the prediction has been computed for Rjets, accounting for correlation
be-tween the individual W + jets and Z + jets processes. The uncertainties on the theoretical predictions are sig-nificantly reduced in this procedure, with the statistical uncertainty on the samples often dominating.
Uncertainties on the renormalisation and the fac-torisation scales were evaluated by varying these scales independently to half and twice their nominal value. The PDF uncertainties were computed from the CT10 eigenvectors, derived with the Hessian method at 68% confidence level [17]. The changes in Rjets due to these
PDF variations were combined and used as the uncer-tainty. In addition, the nominal value of the strong cou-pling constant, αs= 0.118, was varied by ±0.0012, and
the impact of this variation was taken into account in the PDF uncertainty. All the uncertainty components mentioned above were then added in quadrature. The total systematic uncertainty on the prediction ranges from 0.3% to 1.8% for inclusive jet multiplicities rang-ing from one to four, and from 2% to 6% for leadrang-ing-jet
12 The ATLAS Collaboration In order to compare the BlackHat+SHERPA
parton-level predictions with the measurements at par-ticle level, a set of non-perturbative corrections was ap-plied to the predictions. Corrections for the underly-ing event (UE) were calculated usunderly-ing samples generated with ALPGEN+HERWIG+JIMMY. The ratio of sam-ples where the UE has been switched on and off was evaluated in each bin of each distribution. Corrections for the hadronization of partons to jets were computed using similar samples by forming the ratio of distribu-tions obtained using jets clustered from hadrons versus jets clustered from partons. In Rjets, the hadronization
and UE corrections have opposite signs and are quite small (typically 2% to 3% for the exclusive jet multiplic-ity), so the overall correction factor is close to unity. Ad-ditional ALPGEN +PYTHIA samples were used to es-timate the uncertainties due to these non-perturbative corrections, which are typically well below 1%.
Finally, corrections for QED final-state radiation
were calculated as the ratio of Rjets derived from
“dressed” leptons to Rjets defined before any final-state
photon radiation, using ALPGEN samples interfaced to PHOTOS. These corrections range between 1% and 2% for both the electron and the muon channel. Sys-tematic uncertainties were derived by comparing with corrections obtained using SHERPA, which calculates final-state QED radiation using the YFS method [50]. The differences between the predictions are typically well below 1%.
Tree-level multi-leg matrix element calculations matched to parton showering algorithms were obtained from the ALPGEN and SHERPA generators. These calculations use different PDF sets, matching pro-cedures, parton shower evolution, and hadronization and multi-parton interaction modelling, as detailed in Sect. 3. Only statistical uncertainties were considered for these predictions, which are compared with the BlackHat+Sherpa calculations and the data in Sect. 10.
10 Results and discussion
The theoretical predictions described in Sect. 9 are compared to the experimental data unfolded to par-ticle level, as defined in Sect. 6. Individual ratios of the BlackHat+SHERPA, ALPGEN, and SHERPA pre-dictions to unfolded data make it possible to disen-tangle the important features of each theoretical pre-diction. The Rjets results highlight the ability of these
Monte Carlo programs to model the differences between Z + jets and W + jets processes.
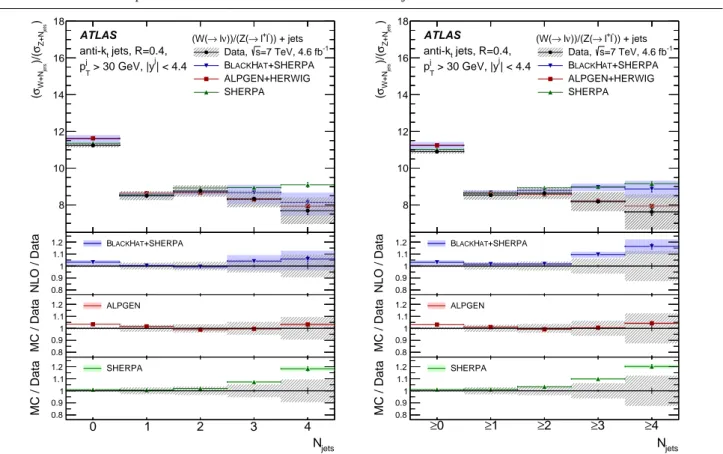
Figure 1 shows Rjets as a function of exclusive and
inclusive jet multiplicity. The values are detailed in
Ta-bles 6 and 7, respectively.5 The theoretical predictions
describe the data fairly well, given the experimental uncertainties, with few exceptions. At high jet multi-plicities, where the effects of hard QCD radiation are tested, the SHERPA prediction is about 1.5 standard deviations (1.5σ) of the experimental error greater than the measurement. BlackHat+SHERPA is able to de-scribe Rjetsmeasured as a function of exclusive jet
mul-tiplicity, within the theoretical uncertainties, although it is about 1σ greater than the measurement at high inclusive jet multiplicities; this is expected since it does not include all contributions for events with at least four jets.
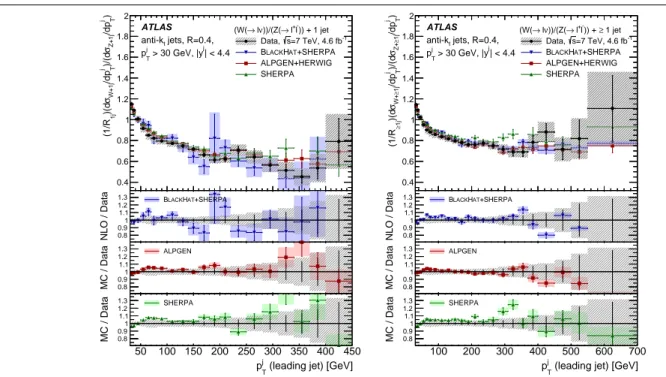
In the following figures, Rjets is normalized to the
ratio of the W and Z cross sections in the correspond-ing jet multiplicity bin presented in Fig. 1, so that the shapes of the distributions can be compared. Fig-ure 2 shows the Rjets ratio versus the leading-jet pTfor
Njets = 1 and Njets ≥ 1. At low transverse
momen-tum (pT< 200 GeV), the Rjetsdistribution falls as the
leading-jet pT increases, indicating that the shapes in
W + jets and Z + jets events are different. This is due to the W and Z boson mass difference, which affects the scale of the parton radiation, and the different vector-boson polarizations, which affect the kinematics of their decay products. In the small region very close to the minimum value of the jet pT considered in the
analy-sis, where radiative parton shower effects play a major role, all of the predicted shapes exhibit trends different from those in the data, but the ALPGEN predictions still show the best agreement.
Figure 3 shows Rjets versus the leading-jet pT for
Njets ≥ 2 and Njets ≥ 3. The Rjets distribution falls
less steeply the more jets are in the event. This is due to the smaller average vector-boson pT, which reduces
the effects arising from differences in boson masses and polarizations. At the lowest pT values considered the
comparison with the data shows a tendency for different behaviour of the theoretical predictions, especially in events with at least three jets. The effect, which is most pronounced for BlackHat+SHERPA, is expected in case of lack of resummation of soft and collinear parton emissions, as in this calculation.
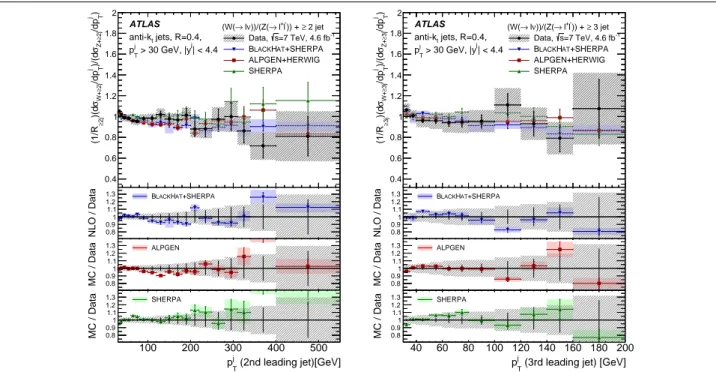
Figure 4 shows Rjets versus the second- and
third-leading-jet pTfor Njets ≥ 2 and Njets ≥ 3 respectively.
The various predictions agree with the data distribu-tions, given the uncertainties, except for small devia-tions in the second-leading-jet pTfor Njets≥ 2.
The next kinematic observable studied is ST, the
scalar sum of all jet transverse momenta in the event. This observable is often used in searches for new
high-5 Tabulated values of the results are also available in the
jets N 0 1 2 3 4 ) jets Z+N σ )/( jets W+N σ ( 8 10 12 14 16 18 ATLAS jets, R=0.4, t anti-k | < 4.4 j > 30 GeV, |y j T p )) + jets -l + l → ))/(Z( ν l → (W( -1 =7 TeV, 4.6 fb s Data, +SHERPA AT H LACK B ALPGEN+HERWIG SHERPA jets N 0 1 2 3 4 NLO / Data 0.8 0.9 1 1.1 1.2 BLACKHAT+SHERPA jets N 0 1 2 3 4 MC / Data 0.8 0.9 1 1.1 1.2 ALPGEN jets N 0 1 2 3 4 MC / Data 0.8 0.9 1 1.1 1.2 SHERPA jets N 0 ≥ ≥1 ≥2 ≥3 ≥4 ) jets Z+N σ )/( jets W+N σ ( 8 10 12 14 16 18 ATLAS jets, R=0.4, t anti-k | < 4.4 j > 30 GeV, |y j T p )) + jets -l + l → ))/(Z( ν l → (W( -1 =7 TeV, 4.6 fb s Data, +SHERPA AT H LACK B ALPGEN+HERWIG SHERPA jets N 0 ≥ ≥1 ≥2 ≥3 ≥4 NLO / Data 0.8 0.9 1 1.1 1.2 BLACKHAT+SHERPA jets N 0 ≥ ≥1 ≥2 ≥3 ≥4 MC / Data 0.8 0.9 1 1.1 1.2 ALPGEN jets N 0 ≥ ≥1 ≥2 ≥3 ≥4 MC / Data 0.8 0.9 1 1.1 1.2 SHERPA
Fig. 1 The ratio of W + jets and Z + jets production cross sections, Rjets, as a function of exclusive jet multiplicity, Njets,
(left) and inclusive jet multiplicity (right). The electron and muon channel measurements are combined as described in the text. Ratios of the BlackHat+SHERPA NLO calculation and the ALPGEN and SHERPA generators to the data are shown in the lower panels. Vertical error bars show the respective statistical uncertainties. The hatched error band shows statistical and systematic uncertainties added in quadrature for the data. The solid error bands show the statistical uncertainties for the ALPGEN and SHERPA predictions, and the combined statistical and theoretical uncertainties for the BlackHat+SHERPA prediction. Njets Rjets = 0 11.24 ± 0.01 (stat.) ± 0.11 (syst.) = 1 8.50 ± 0.02 (stat.) ± 0.24 (syst.) = 2 8.76 ± 0.05 (stat.) ± 0.30 (syst.) = 3 8.33 ± 0.10 (stat.) ± 0.44 (syst.) = 4 7.69 ± 0.21 (stat.) ± 0.70 (syst.)
Table 6 The ratio of W + jets and Z + jets production cross sections, Rjets, as a function of exclusive jet multiplicity in the
phase space defined in Table 1.
Njets Rjets ≥ 0 10.90 ± 0.01 (stat.) ± 0.10 (syst.) ≥ 1 8.54 ± 0.02 (stat.) ± 0.25 (syst.) ≥ 2 8.64 ± 0.04 (stat.) ± 0.32 (syst.) ≥ 3 8.18 ± 0.08 (stat.) ± 0.51 (syst.) ≥ 4 7.62 ± 0.19 (stat.) ± 0.94 (syst.)
Table 7 The ratio of W + jets and Z + jets production cross sections, Rjets, as a function of inclusive jet multiplicity in the
14 The ATLAS Collaboration
(leading jet) [GeV] j T p 50 100 150 200 250 300 350 400 450 ) j T /dp Z+1j σ )/(d j T /dp W+1j σ )(d 1j (1/R 0.4 0.6 0.8 1 1.2 1.4 1.6 1.8 2 ATLAS jets, R=0.4, t anti-k | < 4.4 j > 30 GeV, |y j T p )) + 1 jet -l + l → ))/(Z( ν l → (W( -1 =7 TeV, 4.6 fb s Data, +SHERPA AT H LACK B ALPGEN+HERWIG SHERPA
(leading jet) [GeV]
j T p 50 100 150 200 250 300 350 400 450 NLO / Data 0.8 0.9 1 1.1 1.2 1.3 BLACKHAT+SHERPA
(leading jet) [GeV]
j T p 50 100 150 200 250 300 350 400 450 MC / Data 0.8 0.9 1 1.1 1.2 1.3 ALPGEN
(leading jet) [GeV]
j T p 50 100 150 200 250 300 350 400 450 MC / Data 0.8 0.9 1 1.1 1.2 1.3 SHERPA
(leading jet) [GeV] j T p 100 200 300 400 500 600 700 ) j T /dp 1j ≥ Z+ σ )/(d j T /dp 1j ≥ W+ σ )(d 1j ≥ (1/R 0.4 0.6 0.8 1 1.2 1.4 1.6 1.8 2 ATLAS jets, R=0.4, t anti-k | < 4.4 j > 30 GeV, |y j T p 1 jet ≥ )) + -l + l → ))/(Z( ν l → (W( -1 =7 TeV, 4.6 fb s Data, +SHERPA AT H LACK B ALPGEN+HERWIG SHERPA
(leading jet) [GeV]
j T p 100 200 300 400 500 600 700 NLO / Data 0.8 0.9 1 1.1 1.2 1.3 BLACKHAT+SHERPA
(leading jet) [GeV]
j T p 100 200 300 400 500 600 700 MC / Data 0.8 0.9 1 1.1 1.2 1.3 ALPGEN
(leading jet) [GeV]
j T p 100 200 300 400 500 600 700 MC / Data 0.8 0.9 1 1.1 1.2 1.3 SHERPA
Fig. 2 The ratio of W + jets and Z + jets production cross sections, Rjets, normalized as described in the text versus the
leading-jet transverse momentum, pjT, for Njets= 1 (left) and Njets≥ 1 (right). The electron and muon channel measurements
are combined as described in the text. Ratios of the BlackHat+SHERPA NLO calculation and the ALPGEN and SHERPA generators to the data are shown in the lower panels. Vertical error bars show the respective statistical uncertainties. The hatched error band shows statistical and systematic uncertainties added in quadrature for the data. The solid error bands show the statistical uncertainties for the ALPGEN and SHERPA predictions, and the combined statistical and theoretical uncertainties for the BlackHat+SHERPA prediction.
(leading jet) [GeV] j T p 100 200 300 400 500 ) j T /dp 2j ≥ Z+ σ )/(d j T /dp 2j ≥ W+ σ )(d 2j ≥ (1/R 0.4 0.6 0.8 1 1.2 1.4 1.6 1.8 2 ATLAS jets, R=0.4, t anti-k | < 4.4 j > 30 GeV, |y j T p 2 jet ≥ )) + -l + l → ))/(Z( ν l → (W( -1 =7 TeV, 4.6 fb s Data, +SHERPA AT H LACK B ALPGEN+HERWIG SHERPA
(leading jet) [GeV]
j T p 100 200 300 400 500 NLO / Data 0.8 0.9 1 1.1 1.2 1.3 BLACKHAT+SHERPA
(leading jet) [GeV]
j T p 100 200 300 400 500 MC / Data 0.8 0.9 1 1.1 1.2 1.3 ALPGEN
(leading jet) [GeV]
j T p 100 200 300 400 500 MC / Data 0.8 0.9 1 1.1 1.2 1.3 SHERPA
(leading jet) [GeV] j T p 40 60 80 100 120 140 160 180 200 ) j T /dp 3j ≥ Z+ σ )/(d j T /dp 3j ≥ W+ σ )(d 3j ≥ (1/R 0.4 0.6 0.8 1 1.2 1.4 1.6 1.8 2 ATLAS jets, R=0.4, t anti-k | < 4.4 j > 30 GeV, |y j T p 3 jet ≥ )) + -l + l → ))/(Z( ν l → (W( -1 =7 TeV, 4.6 fb s Data, +SHERPA AT H LACK B ALPGEN+HERWIG SHERPA
(leading jet) [GeV]
j T p 40 60 80 100 120 140 160 180 200 NLO / Data 0.8 0.9 1 1.1 1.2 1.3 BLACKHAT+SHERPA
(leading jet) [GeV]
j T p 40 60 80 100 120 140 160 180 200 MC / Data 0.8 0.9 1 1.1 1.2 1.3 ALPGEN
(leading jet) [GeV]
j T p 40 60 80 100 120 140 160 180 200 MC / Data 0.8 0.9 1 1.1 1.2 1.3 SHERPA
Fig. 3 The ratio of W + jets and Z + jets production cross sections, Rjets, normalized as described in the text versus the
leading-jet transverse momentum, pjT, for Njets ≥ 2 (left) and ≥ 3 (right). The electron and muon channel measurements
are combined as described in the text. Ratios of the BlackHat+SHERPA NLO calculation and the ALPGEN and SHERPA generators to the data are shown in the lower panels. Vertical error bars show the respective statistical uncertainties. The hatched error band shows statistical and systematic uncertainties added in quadrature for the data. The solid error bands show the statistical uncertainties for the ALPGEN and SHERPA predictions, and the combined statistical and theoretical uncertainties for the BlackHat+SHERPA prediction.
(2nd leading jet)[GeV] j T p 100 200 300 400 500 ) j T /dp 2j ≥ Z+ σ )/(d j T /dp 2j ≥ W+ σ )(d 2j ≥ (1/R 0.4 0.6 0.8 1 1.2 1.4 1.6 1.8 2 ATLAS jets, R=0.4, t anti-k | < 4.4 j > 30 GeV, |y j T p 2 jet ≥ )) + -l + l → ))/(Z( ν l → (W( -1 =7 TeV, 4.6 fb s Data, +SHERPA AT H LACK B ALPGEN+HERWIG SHERPA (2nd leading jet)[GeV] j T p 100 200 300 400 500 NLO / Data 0.8 0.9 1 1.1 1.2 1.3 BLACKHAT+SHERPA (2nd leading jet)[GeV] j T p 100 200 300 400 500 MC / Data 0.8 0.9 1 1.1 1.2 1.3 ALPGEN (2nd leading jet)[GeV] j T p 100 200 300 400 500 MC / Data 0.8 0.9 1 1.1 1.2 1.3 SHERPA
(3rd leading jet) [GeV] j T p 40 60 80 100 120 140 160 180 200 ) j T /dp 3j ≥ Z+ σ )/(d j T /dp 3j ≥ W+ σ )(d 3j ≥ (1/R 0.4 0.6 0.8 1 1.2 1.4 1.6 1.8 2 ATLAS jets, R=0.4, t anti-k | < 4.4 j > 30 GeV, |y j T p 3 jet ≥ )) + -l + l → ))/(Z( ν l → (W( -1 =7 TeV, 4.6 fb s Data, +SHERPA AT H LACK B ALPGEN+HERWIG SHERPA
(3rd leading jet) [GeV]
j T p 40 60 80 100 120 140 160 180 200 NLO / Data 0.8 0.9 1 1.1 1.2 1.3 BLACKHAT+SHERPA
(3rd leading jet) [GeV]
j T p 40 60 80 100 120 140 160 180 200 MC / Data 0.8 0.9 1 1.1 1.2 1.3 ALPGEN
(3rd leading jet) [GeV]
j T p 40 60 80 100 120 140 160 180 200 MC / Data 0.8 0.9 1 1.1 1.2 1.3 SHERPA
Fig. 4 The ratio of W + jets and Z + jets production cross sections, Rjets, normalized as described in the text versus the
second-leading-jet transverse momentum, pjT, for Njets ≥ 2 (left) and versus the third-leading-jet pTfor Njets ≥ 3 (right).
The electron and muon channel measurements are combined as described in the text. Ratios of the BlackHat+SHERPA NLO calculation and the ALPGEN and SHERPA generators to the data are shown in the lower panels. Vertical error bars show the respective statistical uncertainties. The hatched error band shows statistical and systematic uncertainties added in quadrature for the data. The solid error bands show the statistical uncertainties for the ALPGEN and SHERPA predictions, and the combined statistical and theoretical uncertainties for the BlackHat+SHERPA prediction.
mass particles. Figure 5 shows Rjets versus ST for
Njets= 2 and Njets≥ 2, while Fig. 6 shows Rjetsversus
ST for Njets = 3 and Njets ≥ 3. At the lowest
val-ues of STthe predicted distributions are different from
the measured distributions, particularly for SHERPA, but in the higher-ST region the theoretical predictions
describe the data well. The central value of the fixed-order BlackHat+SHERPA calculation does not re-produce the ST distributions for W + jets and Z + jets
separately as well as the inclusive calculation, corrobo-rating the previous observations in Refs. [4,5]. The ten-sions are due to the missing higher-order contributions which cancel almost completely in Rjets.
Figure 7 shows the separation ∆Rj1,j2 and the
az-imuthal angular distance ∆φj1,j2 between the two
lead-ing jets, and Fig. 8 shows their invariant mass m12for
Njets ≥ 2. At the lowest ∆Rj1,j2 and m12 values, the
predicted shapes differ from the measured ones. This is interpreted as a weak sensitivity to non-perturbative effects enhancing the difference in soft QCD radiation between W and Z events, but not cancelling completely in Rjets.
Figure 9 shows the leading-jet rapidity for Njets ≥
1, and the second-leading-jet rapidity for Njets ≥ 2,
while Fig. 10 shows the third-leading-jet rapidity for Njets ≥ 3. The different trends between predictions at
high leading-jet rapidity can be due to the effects of the parton shower and, in some cases, different PDF sets. These effects, which do not cancel completely in Rjets,
16 The ATLAS Collaboration [GeV] T S 100 200 300 400 500 600 700 800 900 1000 )T /dS Z+2j σ )/(dT /dS W+2j σ )(d 2j (1/R 0.4 0.6 0.8 1 1.2 1.4 1.6 1.8 2 ATLAS jets, R=0.4, t anti-k | < 4.4 j > 30 GeV, |y j T p )) + 2 jet -l + l → ))/(Z( ν l → (W( -1 =7 TeV, 4.6 fb s Data, +SHERPA AT H LACK B ALPGEN+HERWIG SHERPA [GeV] T S 100 200 300 400 500 600 700 800 900 1000 NLO / Data 0.8 0.9 1 1.1 1.2 1.3 BLACKHAT+SHERPA [GeV] T S 100 200 300 400 500 600 700 800 900 1000 MC / Data 0.8 0.9 1 1.1 1.2 1.3 ALPGEN [GeV] T S 100 200 300 400 500 600 700 800 900 1000 MC / Data 0.8 0.9 1 1.1 1.2 1.3 SHERPA [GeV] T S 100 200 300 400 500 600 700 800 900 1000 )T /dS2j ≥ Z+ σ )/(dT /dS 2j ≥ W+ σ )(d2j ≥ (1/R 0.4 0.6 0.8 1 1.2 1.4 1.6 1.8 2 ATLAS jets, R=0.4, t anti-k | < 4.4 j > 30 GeV, |y j T p 2 jet ≥ )) + -l + l → ))/(Z( ν l → (W( -1 =7 TeV, 4.6 fb s Data, +SHERPA AT H LACK B ALPGEN+HERWIG SHERPA [GeV] T S 100 200 300 400 500 600 700 800 900 1000 NLO / Data 0.8 0.9 1 1.1 1.2 1.3 BLACKHAT+SHERPA [GeV] T S 100 200 300 400 500 600 700 800 900 1000 MC / Data 0.8 0.9 1 1.1 1.2 1.3 ALPGEN [GeV] T S 100 200 300 400 500 600 700 800 900 1000 MC / Data 0.8 0.9 1 1.1 1.2 1.3 SHERPA
Fig. 5 The ratio of W + jets and Z + jets production cross sections, Rjets, normalized as described in the text versus the scalar
sum pT of jets, ST, for Njets = 2 (left) and ≥ 2 (right). The electron and muon channel measurements are combined as
described in the text. Ratios of the BlackHat+SHERPA NLO calculation and the ALPGEN and SHERPA generators to the data are shown in the lower panels. Vertical error bars show the respective statistical uncertainties. The hatched error band shows statistical and systematic uncertainties added in quadrature for the data. The solid error bands show the statistical uncertainties for the ALPGEN and SHERPA predictions, and the combined statistical and theoretical uncertainties for the BlackHat+SHERPA prediction. [GeV] T S 100 200 300 400 500 600 700 800 900 1000 )T /dS Z+3j σ )/(dT /dS W+3j σ )(d 3j (1/R 0.4 0.6 0.8 1 1.2 1.4 1.6 1.8 2 ATLAS jets, R=0.4, t anti-k | < 4.4 j > 30 GeV, |y j T p )) + 3 jet -l + l → ))/(Z( ν l → (W( -1 =7 TeV, 4.6 fb s Data, +SHERPA AT H LACK B ALPGEN+HERWIG SHERPA [GeV] T S 100 200 300 400 500 600 700 800 900 1000 NLO / Data 0.8 0.9 1 1.1 1.2 1.3 BLACKHAT+SHERPA [GeV] T S 100 200 300 400 500 600 700 800 900 1000 MC / Data 0.8 0.9 1 1.1 1.2 1.3 ALPGEN [GeV] T S 100 200 300 400 500 600 700 800 900 1000 MC / Data 0.8 0.9 1 1.1 1.2 1.3 SHERPA [GeV] T S 100 200 300 400 500 600 700 800 900 1000 )T /dS 3j ≥ Z+ σ )/(dT /dS 3j ≥ W+ σ )(d 3j ≥ (1/R 0.4 0.6 0.8 1 1.2 1.4 1.6 1.8 2 ATLAS jets, R=0.4, t anti-k | < 4.4 j > 30 GeV, |y j T p 3 jet ≥ )) + -l + l → ))/(Z( ν l → (W( -1 =7 TeV, 4.6 fb s Data, +SHERPA AT H LACK B ALPGEN+HERWIG SHERPA [GeV] T S 100 200 300 400 500 600 700 800 900 1000 NLO / Data 0.8 0.9 1 1.1 1.2 1.3 BLACKHAT+SHERPA [GeV] T S 100 200 300 400 500 600 700 800 900 1000 MC / Data 0.8 0.9 1 1.1 1.2 1.3 ALPGEN [GeV] T S 100 200 300 400 500 600 700 800 900 1000 MC / Data 0.8 0.9 1 1.1 1.2 1.3 SHERPA
Fig. 6 Rjets normalized as described in the text versus the scalar sum pT of jets, STfor Njets = 3 (left) and ≥ 3 (right).
The electron and muon channel measurements are combined as described in the text. Ratios of the BlackHat+SHERPA NLO calculation and the ALPGEN and SHERPA generators to the data are shown in the lower panels. Vertical error bars show the respective statistical uncertainties. The hatched error band shows statistical and systematic uncertainties added in quadrature for the data. The solid error bands show the statistical uncertainties for the ALPGEN and SHERPA predictions, and the combined statistical and theoretical uncertainties for the BlackHat+SHERPA prediction.