Magic-Sized Cd
3
P
2
II-V Nanoparticles Exhibiting
Bandgap Photoemission
Ruibing Wang,1 Christopher I. Ratcliffe,1 Xiaohua Wu,2 Oleksandr Voznyy,2 Ye Tao,2 and Kui Yu1*
1
Steacie Institute for Molecular Sciences, and
2
Institute for Microstructural Sciences,
National Research Council of Canada, Ottawa, Ontario K1A 0R6, Canada
*To whom correspondence should be addressed. Email: kui.yu@nrc-cnrc.gc.ca
RECEIVED DATE (to be automatically inserted after your manuscript is accepted if required according to the journal that you are submitting your paper to)
1
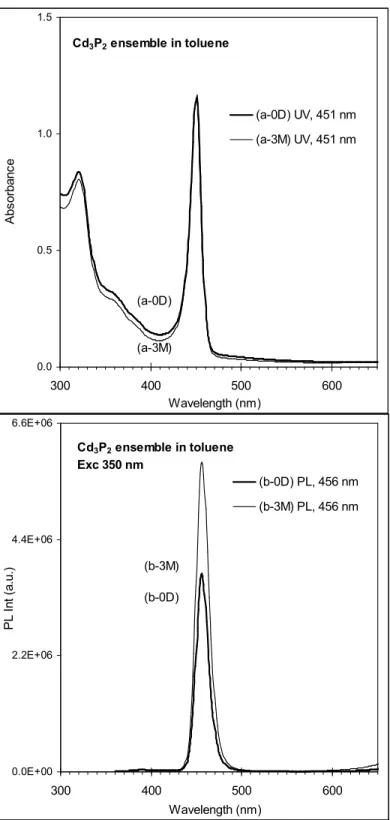
Figure S1. Storage stability of the 140 °C-growth Cd3P2 ensemble (shown in Figures 1 and 2 and
3), monitored by the absorbance (top) and emission (bottom). The storage was 3 months in a fridge ( ~ -20 °C). 0.0 0.5 1.0 1.5 300 400 500 600 Wavelength (nm) A b s o rb a n c e (a-0D) UV, 451 nm (a-3M) UV, 451 nm Cd3P2 ensemble in toluene (a-0D) (a-3M) 0.0E+00 2.2E+06 4.4E+06 6.6E+06 300 400 500 600 Wavelength (nm) P L I n t (a .u .) (b-0D) PL, 456 nm (b-3M) PL, 456 nm Cd3P2 ensemble in toluene Exc 350 nm (b-3M) (b-0D)
2
*
*
*
*
*
*
*
*
*
*
*
*
*
*
*
*
*
*
*
*
*
*
*
*
*
*
*
*
*
*
*
*
*
*
*
*
*
*
*
*
*
*
*
*
*
*
*
*
*
*
*
*
*
*
*
*
*
*
*
*
(S2-1a) (S2-1b) (S2-2)3
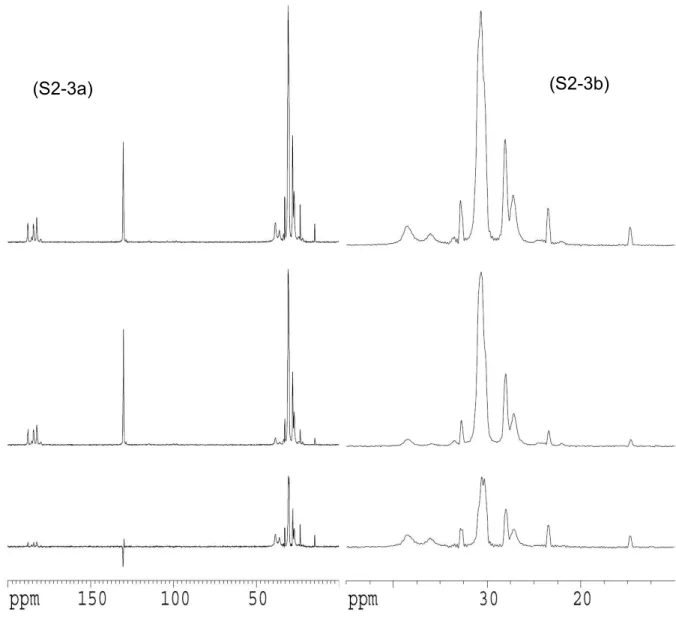
Figure S2. 113Cd (S2-1), 31P (S2-2), and 13C (S2-3) MAS NMR spectra.
The NMR spectra were obtained on a Bruker AMX300 spectrometer and a Doty Scientific Inc. 5mm MAS probe using silicon nitride rotors. 113Cd spectra were referenced to Cd(NO3)2.4H2O, 31
P to 85 wt% phosphoric acid solution, and 13C to TMS using hexamethylbenzene as external solid reference. The nanoparticle sample was from a large-scale reaction under the same reaction formula and conditions shown in Figures 1 and 2.
113
Cd spectra (S2-1a and S2-1b) required very long collection times (4-5 days), both with and without cross-polarization (CP), respectively. The CP/MAS spectrum (S2-1a) show two principal Cd resonances with large chemical shift anisotropies (csa) indicated by many spinning side
4
bands (ssb, labeled as red and green *). The isotropic lines centred at ~ 292 ppm (indicated with a
red arrow) and ~ 407 ppm (indicated with a green arrow) are both split into doublets (or possibly quartets), and these presumably arise from J-coupling to 31P. Without CP but still with high power
1
H decoupling (HPDEC, S2-1b), an additional line, again with a large csa appears with isotropic shift at ~ 790 ppm (indicated with a blue arrow). The spin-rate in the HPDEC spectrum is such that the ssbs of the two surface Cd lines overlap with each other – so the spectrum “appears” accidentally to be simpler. We assign this line to core Cd, since it does not appear with any significant intensity in the CP spectrum, and the two other lines to surface Cds (c.f. our previous assignments of core and surface Cd in CdSe and CdTe nanoparticles10d-g).
The 31P spectrum (S2-2) shows only one main resonance line centred at ~ 366.3 ppm which also has a significant csa apparent from the ssb; an expansion of the isotropic line is emphasized. Curiously the spectrum obtained without CP is virtually identical to that with CP except for a very weak resonance at ~ 11 ppm, which is most probably a trace of an oxygen-bearing-P impurity. Thus core and surface P centres are not distinguished. This may indicate that there are no core P atoms. The shift of the line itself is unusual and quite unlike that of bulk tetragonal Cd3P2, which shows
three P resonances with isotropic shifts at -140, -162 and -178 ppm (Adolphi, N.L.; Stoddard, R.D.; Goel, S.C.; Buhro, W.E.; Gibbons, P.C.; Conradi, M.S. J. Phys. Chem. Solids 1992, 53, 1275-1278). The shift is towards that of materials with P-P bonds, e.g. P4 in CD2Cl2 solution is at -526.9 ppm
(Ehses, M.; Romerosa, A.; Peruzzini, M. Topics in Current Chemistry, 2002, 220, 107-140). The line also shows a multiplet structure (possibly quintet) with an odd intensity pattern that does not correspond to a simple J-coupled pattern, which may arise from both J(31P-31P) and J(111,113Cd-31P). Though the exact interpretation of this spectrum is still uncertain, nevertheless it does confirm the PXRD result that the nanomaterial does not have the structure of bulk tetragonal Cd3P2.
The 13C CP/MAS spectrum (S2-3a top, normal CP/MAS) shows the carbons of the oleic acid capping material (or more probably oleate ion). The dipolar dephased spectrum (S2-3a middle) shows that many of the protonated carbons are in fact dynamic; their appearance in the dipolar dephased spectrum means that their 1H-13C dipolar couplings have been reduced due to motion. However, close inspection of the spectra, including the difference spectrum (S2-3a bottom), shows that some of the resonances in the CH2 region do not appear in the dephased spectrum. This is
consistent with a model where the oleate groups are attached to the surface and the CH2 groups
closest to the –CO2- are effectively static whereas CH2 further along the chain have increasingly
5
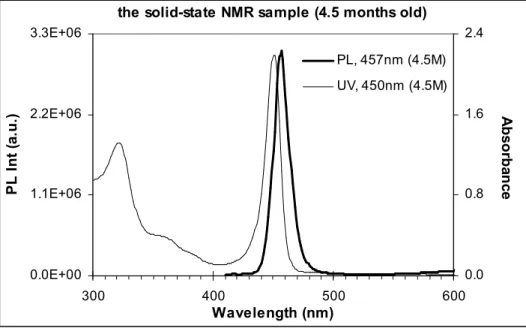
To check on the integrity of the NMR sample, the solid material was redissolved in toluene after the NMR experiments were completed and its absorbance and emission spectra (see Figure S3) were very similar to those shown in Figure S1 above and Figure 2 in main text, in peak position but with higher quantum yield of 7.2% (the fresh sample’s quantum yield of 3%).
Figure S3. Absorbance (thin line) and emission (thick line) of the solid-state NMR Cd3P2 sample
(shown in Figure S2) after 4.5-month storage (about 3 months at room temperature and 1.5 months in fridge).
the solid-state NMR sample (4.5 months old)
0.0E+00 1.1E+06 2.2E+06 3.3E+06 300 400 500 600 Wavelength (nm) P L I n t (a .u .) 0.0 0.8 1.6 2.4 PL, 457nm (4.5M) UV, 450nm (4.5M) A b s o rb a n c e
6
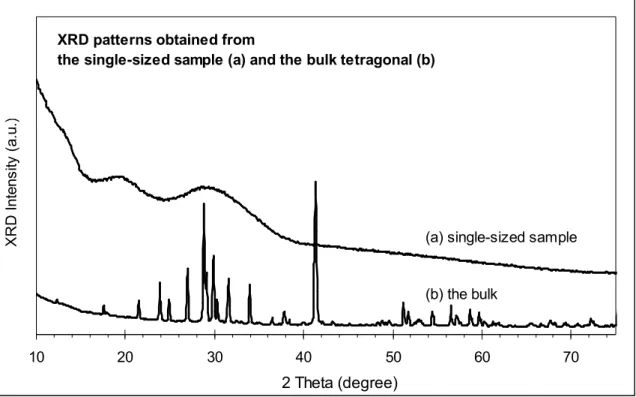
Figure S4. Powder XRD patterns of our Cd3P2 sample (a) and the tetragonal bulk Cd3P2 materials
(purchased from CERAC inc., Milwaukee, WI, USA) (b), without background subtractions.
The PXRD pattern shows only very broad features centred at about 13.5, 20 and 30° in 2θ. This is inconsistent with the tetragonal structure of bulk Cd3P2. The most recent single crystal
structural determination for Cd3P2 gives two similar possible structural arrangements22 but
simulated powder patterns calculated from either one of these are not compatible with the observed pattern. In particular, both structural models have a very strong line at about 42° in 2θ and other groups of lines at higher angles, yet there is no indication whatsoever of any intensity in the observed pattern above about 36°. In fact the PXRD pattern does not appear to represent a 3D crystalline structure.
Regarding the crystal structure, a reviewer suggested the possibility of alloy formation, which is believed to plague the synthesis of other P-containing nanocrystals.
10 20 30 40 50 60 70 2 Theta (degree) X R D I n te n s ity ( a .u .)
XRD patterns obtained from
the single-sized sample (a) and the bulk tetragonal (b)
(a) single-sized sample
7
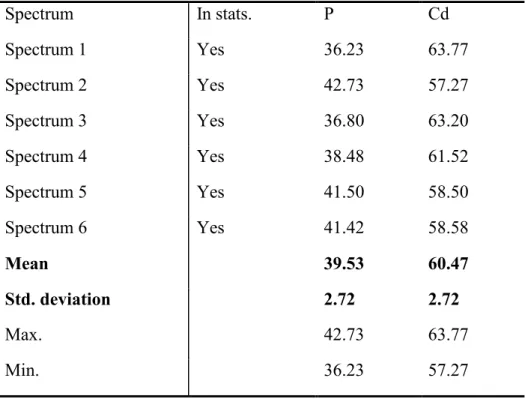
Table S1. The atomic composition (expressed by atomic percentage) of the Cd3P2 nanoparticle
sample analyzed by the EDX spectra (shown in Figure 3).
Spectrum In stats. P Cd Spectrum 1 Yes 36.23 63.77 Spectrum 2 Yes 42.73 57.27 Spectrum 3 Yes 36.80 63.20 Spectrum 4 Yes 38.48 61.52 Spectrum 5 Yes 41.50 58.50 Spectrum 6 Yes 41.42 58.58 Mean 39.53 60.47 Std. deviation 2.72 2.72 Max. 42.73 63.77 Min. 36.23 57.27
8
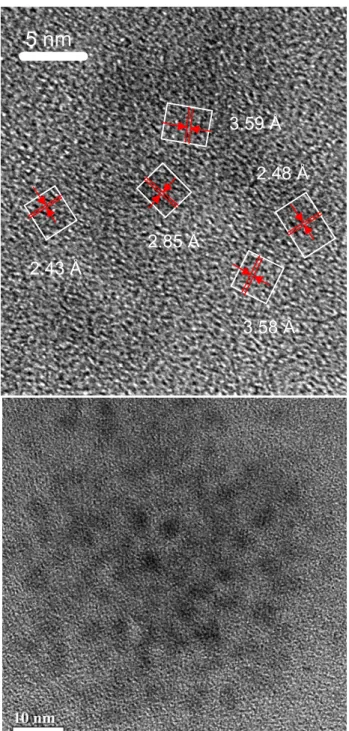
Figure S5. TEM images of the Cd3P2 sample (also presented in Figure 4). The measured d-spacing
values are individually labeled with the unit of angstrom (Å) and the measured areas are also indicated with boxes.
5 nm
3.59 Å 2.48 Å 2.85 Å 3.58 Å 2.43 Å5 nm
3.59 Å 2.48 Å 2.85 Å 3.58 Å 2.43 Å9
Figure S6. The formation of the single-sized CdP nanoparticles from the three batches (top, middle, and bottom) with the same feed molar ratios of 4OA-4Cd-1P and [P] of 10 mmol/Kg; the growth periods and temperature were
Top batch (0 min): 60 °C (1), 80 °C (2), 100 °C (3), 120 °C (4), 140 °C (5), 160 °C (6), 180 °C (7), 200 °C (8), 220 °C (9), and 240 °C (10). This batch is presented in Fig. 1.
CdP 0.8 1.4 2.0 2.6 0 2 4 6 8 10
Samples (w ith grow th from 60 °C - 240 °C )
A b s o rb a n c e O.D. at 449-451nm CdP 0.0 1.6 3.2 4.8 0 2 4 6 8 10
Samples (w ith grow th from 60 °C - 240 °C )
PL Ef fi c ie n c y PL/OD at 455nm/456nm CdP 0.8 1.4 2.0 2.6 0 3 6 9
Samples (w ith grow th at 80 oC mainly)
A b s o rb a n c e O.D. at 447nm/450nm CdP 0.0 1.6 3.2 4.8 0 3 6 9
Samples (w ith grow th at 80 oC mainly)
PL Ef fi c ie n c y PL/OD at 456nm/457nm CdP 0.8 1.4 2.0 2.6 0 3 6 9
Samples (w ith grow th at 100 oC mainly)
A b s o rb a n c e O.D. at 450nm CdP 0.0 1.6 3.2 4.8 0 3 6 9
Samples (w ith grow th at 100 oC mainly)
PL Ef fi c ie n c y PL/OD at 457nm/458nm
10
Middle batch: 0 min/60 °C (1), 0 min/80 °C (2), 10 min/80 °C (3), 20 min/80 °C (4), 30 min/80 °C (5), 60 min/80 °C (6), 120 min/80 °C (7), 180 min/80 °C (8), and 240 min/80 °C (9).
Bottom batch: 0 min/80 °C (1), 0 min/100 °C (2), 10 min/100 °C (3), 20 min/100 °C (4), 30 min/100 °C (5), 60 min/100 °C (6), 120 min/100 °C (7), 180 min/100 °C (8), and 240 min/100 °C (9).
The as-synthesized Cd3P2 nanoparticle samples from the three synthetic batches were dispersed in
toluene, with the concentration of 10 µL/mL. They exhibited bandgap absorption and emission at ~ 447 nm – 451 nm and at ~ 455 nm – 458 nm, respectively. It is clearly that the synthesis can be carried out at relatively low temperature such as 100 °C with long growth periods and at relatively high temperature such as 140 °C with short growth periods.
![Figure S6. The formation of the single-sized CdP nanoparticles from the three batches (top, middle, and bottom) with the same feed molar ratios of 4OA-4Cd-1P and [P] of 10 mmol/Kg; the growth periods and temperature were](https://thumb-eu.123doks.com/thumbv2/123doknet/14154496.472289/10.918.98.832.90.813/figure-formation-single-nanoparticles-batches-middle-periods-temperature.webp)
