Overview
advanced materials analysis
How would you…
…describe the overall signifi cance of this paper?
Micromechanics is a booming research area experiencing the development of new advanced testing techniques at small dimensions. Most methods provide information on macroscopic mechanical data. In this paper we demonstrate that in situ Laue microdiffraction is a unique method to follow the evolution of the microstructure during mechanical testing at the micron scale.
…describe this work to a materials science and engineering professional with no experience in your technical specialty?
It is the ease of dislocation nucleation and propagation and the nature of the dislocation multiplication mechanism that determines the strength of the metallic structure; a concept offering several pathways for strengthening. The microcompression test is a relatively new experimental method that revealed a “smaller is stronger” trend for single crystal micron sized samples. This paper reviews the efforts to explore the role of the initial defect structure and the boundary conditions of the testing method on the observed trend by performing micro-focused Laue diffraction.
…describe this work to a layperson?
Here, we discuss a new approach to follow in-situ and nondestructively the evolution of the microstructure of micrometer-scaled objects during deformation.
Micromechanics is a booming re-search area experiencing the develop-ment of new advanced testing methods at small dimensions. A relatively young but very popular technique involves uniaxial compressing micrometer and sub-micrometer sized objects, usually in the shape of pillars. Research in this fi eld has focused mainly on exploring size effects in single crystal metals. This article demonstrates that Laue mi-crodiffraction allows exploring in-situ the evolving microstructure in the tran-sition regime from elasticity to plastic-ity, a feature that is not accessible with other techniques but which is essential for the understanding of small-scale plasticity.
introduction
In metals, dislocations, i.e. line de-fects in the single crystal lattice, are the main carriers of plastic strain.1,2 Their
motion, multiplication, and annihila-tion mechanisms contribute to the plas-tic fl ow and the strength of the metal. The steady operation and interplay of these mechanisms result in the for-mation of dislocation entanglements, dislocation forests, and eventually the formation of sub-structures. Dur-ing the microstructural evolution the metal hardens, which for metals with a face-centered cubic (f.c.c.) symme-try is refl ected in a specifi c multi-stage character of the stress–strain response.3
It is known that some of the above-mentioned dislocation mechanisms might be restricted when the volume of the crystal is confi ned. For instance, the well-known dislocation Frank-Read nucleation source is believed not to operate anymore in a polycrystalline metal when the grain size is well below 50 nm.4–10
The development of the
micro-com-the use of Laue microdiffraction to
Study Small-scale plasticity
H. Van Swygenhoven and S. Van Petegem
pression technique,11–13 has allowed
deforming single crystal samples with diameters between 200 nm up to more than 20 µm, revealing a stress–strain response that is different from the expected multi-stage character. Eye-catching is the enhanced strength for
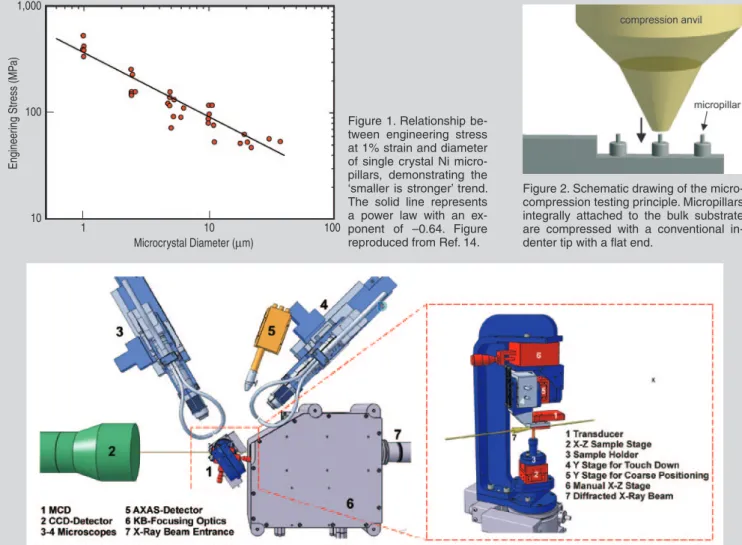
smaller sample sizes (i.e., the so-called “smaller is stronger” trend). This is demonstrated in Figure 1 for the case of nickel single-crystal micropillars. The remarkable strengthening of single crystals in this size range has perplexed materials scientists, because it does not fi t into our current understanding of single crystal plasticity theories. The strength (at low strain) of single crys-tals does not depend strongly on the size but rather on the geometrically predicted dislocation slip system(s) for which the resolved shear stress is the highest, the type of hardening mecha-nism activated and eventually the ini-tial defect content. An enthusiastic community of metallurgists and mate-rial scientists started studying all kinds of pillar sizes and metals, resulting in a lot of publications and a huge interest at international conferences.14–25
It has to be recognized that micro-compression testing is different from the classical well-lubricated large-scale compression experiment where the sample can slide on both sides be-tween the compression platens (DIN 5010626). One of the major differences
in a micro-compression device is that the sample set-up is asymmetric, as is demonstrated in Figure 2: the bottom of the pillar is rigidly fi xed to the sub-strate and the top is a free surface (i.e., one of the platens has infi nite large friction; the conditions of the other are rather unknown). Such sample geom-etry is unavoidable because of the im-possibility to align a micrometer-sized pillar between two fl at platens. On the other hand, the samples are easy to make when using the focused ion beam (FIB) milling technique.
In the early experiments using the micro-compression technique, it was assumed that the axial compression
testing configuration provides a stress state over a uniform gauge section of the sample that minimizes stretch or rotational strain gradients, at least at the onset of plasticity and for a suitable aspect ratio of the sample.13,14,27 These
assumptions resulted from simula-tions on the testing geometry using an anisotropic, elastic-viscoplastic crys-tallographic finite-element code. It is, however, well known that the nature of the constraints in a compression test changes the uniformity or heterogene-ity of the stress distribution in the sam-ple. These different conditions can lead to important differences in activated deformation mechanisms resulting in differences in developing crystal rota-tions with the possibility for orienta-tion gradients. The way a sample will deform is determined very early during the loading procedure, and affects the evolution of the dislocation network, which in turn affects the strain harden-ing behavior.
In a micro-compression experiment the boundary conditions are very dif-ficult to control because it depends not only on the chosen hardware (for instance by the lateral stiffness) but also on many other parameters, which can vary from sample to sample, such as the geometrical outline of sample relative to the indenter,11,28 the surface
quality of the indenter and the pillar top, and the specific geometry of the sample such as the aspect ratio29 and
the taper geometry.17,28
To improve our current understand-ing of the boundary conditions of the technique, dedicated experiments and computational simulations have to be performed. The effects of initial crystallographic orientation, sample geometry and friction during single crystal micro-compression deforma-tion has been addressed by Raabe et al. in a crystal plasticity finite element modeling (FEM) study.30 The authors
demonstrated, among others, that non-zero friction conditions reduce shape instability with a dependence on the initial crystal orientation and that the evolution of crystal orientation scatter during compression is weaker when the friction coefficient is higher. Fur-thermore they observed pronounced deformation-induced crystal orienta-tion changes including the evoluorienta-tion
of substantial orientation gradients taking place at engineering compres-sive strains of about 0.2. The three-dimensional crystal plasticity calcu-lations of Shade et al.31 show that the
stress distribution in a single crystal pillar with a 〈123〉 crystal direction parallel to the compression axis is al-ready non-uniform at 0.3% strain in the presence of friction. Note that the above-mentioned calculations assume the compression stress is applied on a dislocation-free sample. Using a multi-scale dislocation dynamics plasticity (MDDP) approach coupling discrete dislocation dynamics at the micro-scale with the macroscopic plastic de-formation,32 it has been shown that in
the presence of dislocations the influ-ence of friction can be very different. For instance, starting from the same initial dislocation distribution and den-sity, it was shown that when the upper surface is free to move, one slip sys-tem dominates and the deformation is localized in two adjacent slip bands located towards the bottom end of the specimen while the upper portion of the specimen glides freely over these bands and deforms elastically. On the other hand, when the upper end is con-strained two slip systems are activated and the localization occurs towards the upper surface of the specimen.
Besides the complexity of the bound-ary conditions of the micro-compres-sion test, there are other parameters that come into play, such as, for instance, the methodology to produce the single crystal pillars. Most studies have been performed on single crystal pillars that have been synthesized using two differ-ent FIB milling methods: the first one called “annular milling”17 results in a
ta-pered pillar, whereas the second meth-od, “lathe milling,”13 results in a
taper-free pillar. During loading the presence of a taper can obviously induce a stress gradient along the pillar axis, which might have non-negligible effects on the onset of plasticity. Furthermore, it is well known that FIB induces damage to the crystal lattice in terms of defect structures and implanted gallium (the ion usually used for FIB milling).33,34
How exactly the induced defects, even-tually in the form of a damaged layer, affect the observed plasticity in a single crystal pillar geometry is an open
ques-tion. The fact is that it has measurable influences on strength as shown by E. George et al. who demonstrated that molybdenum single-crystal pillars ob-tained by directional solidification lose their whisker-type characteristics when the pillar diameter is slightly reduced by FIB.34,35
The above-mentioned uncertainties, resulting from boundary and alignment conditions of the experimental setup and sample geometry, are at the origin of the often not very reproducible ini-tial shape of the stress-strain curve. It is therefore not possible to determine from the stress-strain curve the onset of plasticity by, for instance, a 0.2% yield criteria as is done for deformation tests of macroscopic samples (see DIN 5010626).
Needless to say, to make progress in the understanding of the observed “smaller is stronger” effect in single crystals, there is a need for a measure-ment technique that allows following the microstructure during deformation and eventually to differentiate between phenomena resulting from boundary conditions of the device or geometrical constraints from the sample, and those phenomena intrinsically resulting from plasticity mechanism in a confined vol-ume.
Laue diffraction is an excellent can-didate for such purposes. It is one of the oldest diffraction techniques, which however lost the interest from mate-rial scientists because it was only ap-plicable for single crystals. However, with the enhanced performance and fo-cusing conditions at synchrotron light sources, Laue diffraction has gained back in interest, as is witnessed by the papers in the current JOM volume. White beam x-ray Laue diffraction is sensitive to the underlying microstruc-ture and, when performed under load, can reflect the dynamics of the self-organization process of dislocations leading to the formation of sub-grain structures.36 Continuous streaking of
Laue diffraction peaks can be related to internal strain gradients, while discon-tinuous streaking evidences the pres-ence of dislocation walls, forming geo-metrically necessary boundaries.37 The
path along which a Laue peak moves during deformation can be linked to a specific active lattice plane within the
Figure 3. Schematic drawing of the MCD setup at the MicroXAS beam line. The inset shows the micro-compression device in more detail. 100 1,000 10 1 10 Microcrystal Diameter (mm) Engineer ing Stress (MP a) 100
Figure 1. Relationship be-tween engineering stress at 1% strain and diameter of single crystal Ni micro-pillars, demonstrating the ‘smaller is stronger’ trend. The solid line represents a power law with an ex-ponent of –0.64. Figure reproduced from Ref. 14.
Figure 2. Schematic drawing of the micro-compression testing principle. Micropillars integrally attached to the bulk substrate are compressed with a conventional in-denter tip with a flat end.
a c b d Figure 4. (a) SEM image of a free-standing Mo pillar after etching (left) and after treatment with FIB (right). Representative shapes (3-D and 2-D) of Laue diffraction peaks from (b) a single-crystal Si wafer (100 mm thick), (c) a DS Mo pillar after etching, and (d) a DS pillar after etching and subsequent FIB treatment. All peaks are plotted in units of radial (2θ) and azimuthal (ψ) angles. The radial angle is defined as the angle between the scattering vector and the direct beam, and the azimuthal angle corresponds to the angle between the projection of the scattering vector onto the charge coupled device (CCD) detector plane and the horizontal axis of the CCD plane. In the 2D plots, the dark red color represents the intensity at half maximum.
b a
c
d
Figure 5. Results from a compression test on a Ni micropillar with 8 mm diameter: (a) Stress-strain curves for three loading cycles. The fourth curve (in blue) corresponds to the stress-strain response of a 10 mm Ni pillar recorded by Dimiduk et al.14 The inset
displays the plastic part of the third loading cycle in more detail, demonstrating the pres-ence of significant strain bursts. (b) SEM im-ages before and after deformation, revealing the presence of localized slip on the (111) plane in the lower half of the pillar. (c) Spatial resolved diffraction maps for the (311) peak after load 1 (left) and after load 3 (right).
120 115 110 105 100 100 80 60 40 20 0 0 1 2 3 Engineering Strain (%) Strain (%) Engineer ing Stress (MP a) Stress (MP a) 4 2 1 3 4 3 2 1 5 6
rotational Taylor model.38,39 From the
collective motion of all Laue spots to-gether, the rotation of the local crystal-lographic orientation can be quantified. This article highlights selected re-search results that were obtained using white beam Laue diffraction on single crystal pillars. The examples chosen aim to illustrate the type of informa-tion that can be obtained together with their suitability for understanding the
effect of the boundary conditions on the outcome of an experiment and for understanding why smaller samples are stronger.
the SwiSS Light Source micro-compreSSion teSt Figure 3 shows a schematic drawing of the in-situ micro-compression setup installed at the MicroXAS beam line of the Swiss Light Source. A white x-ray
beam is generated at a conventional un-dulator source, resulting in an energy distribution ranging from 5 keV to 23 keV. A set of Kirkpatrick-Baez focus-ing mirrors is used to focus the beam down to a size less than 1 mm in the focal plane. The compression experi-ments are performed with a custom designed micro-compression device (MCD), shown in detail in the inset of Figure 3. It consists of a set of 11
linear stages, two tilting stages, and one rotary positioner, which are used for precise alignment of the micro-pillars with the compression anvil and with the x-ray microbeam. The actual compression test is performed with a standard one-dimensional Triboscope transducer from Hysitron, Inc. The diffracted x-ray beam is detected by a charged couple device (CCD) detec-tor positioned in a Laue transmission geometry at typical sample-to-detector distances of ~50 mm. Emitted fluores-cence light from the sample is detected by a single element analogue x-ray ac-quisition system (AXAS), allowing the reconstruction of the sample position in laboratory coordinates. This method unambiguously determines the sample position relative to the micro-focused x-ray beam. Two high resolution mi-croscopes are used to monitor the alignment in two perpendicular planes during the compression anvil approach and the actual compression experiment.
To check the stiffness of the ma-chine, calibration indents with a stan-dard Berkovich indentation tip were performed on quartz resulting in an indentation modulus of 76 GPa, in rea-sonable agreement with reported lit-erature values.40 It has to be mentioned
that displacement measurements with a transducer are very sensitive to ther-mal drift and that the in-situ measure-ments are not executed in a controlled environment. Indentation software programs usually allow for automatic correction for such a drift, which, un-fortunately, cannot be applied for the long in-situ measurements. Further de-tails on the experimental set-up can be found in the online material of Refer-ence 41.
initiaL microStructure of piLLarS
There exists clear evidence that the plastic response and the strength of micrometer-sized single crystal pillars may be quite sensitive to the initial defect content. This was recently dem-onstrated for the case of molybdenum pillars that are obtained after etching away the surrounding NiAl matrix in a directionally solidified (DS) NiAl-Mo eutectic grown composite. The DS pil-lars were found to yield at stresses close to the theoretical strength independent
of pillar size (in the range 350~1,000 nm),42 reminiscent of whisker
behav-ior.43 When the DS pillars were slightly
pre-strained before etching and subse-quent compression, their strengths de-creased dramatically. Furthermore the stress-strain curves became stochastic and exhibited moderate size depen-dence.44 Interestingly, a substantial
de-crease in the strengths of the DS pillars was also observed after FIB milling.35
Therefore, the characterization of the initial microstructure is an important first step in understanding the observed mechanical properties of micropillars. This can be done using transmission electron microscopy. But for this pur-pose, thin film lamellae have to be cut out of the pillars, where the use to FIB cannot be avoided (see for instance Reference 45). On the other hand, x-rays interact weakly with matter and are therefore well suited to investigate the microstructure of entire microme-ter-sized specimens. When working in transmission geometry the pillars have to be freestanding (i.e., a free pathway for the incoming and diffracted beam), which is a tedious task in case of the DS molybdenum pillars, as they are only separated by a few micrometers. The technique used to obtain a freestanding pillar out of a forest of pillars has been described in Reference 46. As an alter-native, a differential aperture technique can be used to study the microstructure of non-free standing molybdenum pil-lars.47
Figure 4a shows scanning elec-tron microscopy (SEM) pictures of a free standing DS molybdenum pil-lar after etching (left) and after FIB treatment (right). Both pillars have a 〈001〉 crystal orientation parallel to the compression axis. Figure 4b dis-plays a representative diffraction peak (011) obtained from the as-prepared pillars. For comparison, a (311) dif-fraction peak obtained from a 100-mm thick single-crystal Si wafer measured under the same conditions is shown in Figure 4c. For the molybdenum pillar, the approximate full-widths at half-maximum (FWHM), defined in units of radial and azimuthal angles, D2θ and Dψ, are 0.04° and 0.05°, respectively. The corresponding values for the sili-con wafer are 0.06° and 0.06°, respec-tively. In other words, the peak width
obtained for the molybdenum pillars is within the resolution of the experimen-tal setup, the latter being determined by the angular divergence of the incident beam and the detector pixel size.46
Although it is not known which is the lower detection limit in disloca-tion density, it can be concluded that the shape of the Laue diffraction peaks observed for DS pillars correspond to a dislocation-poor single crystal pillar. However, if such pillars are treated on the surface with an FIB, using the an-nual milling procedure, the diffraction peaks start showing intensity streaks. Figure 4d demonstrates this for a (211) diffraction peak. The continuous inten-sity distribution of the streaked peaks suggests that the deviatoric strain gra-dients are present not only near the sur-face, which is directly affected by the gallium ion implantation, but also near the center of the pillar. For the pillar studied, it is not possible to determine if the streaking direction corresponds with an excess dislocation density on a certain slip system, given the large number of possible slip systems in molybdenum and the limited number of diffraction spots obtained. It can however be said that the lengths of the streaks in FIB pillars are usually too large to be explained entirely by elastic strain gradients without the presence of dislocations.
Similar investigations have also been performed on pillars that were FIB syn-thesized out of a larger single crystal or out of a well annealed large grain embedded in a polycrystalline metal. Moreover, the studies on face-centered cubic pillars suggest an increasing im-portance of streaking for smaller pil-lars.48–50 Besides the above-mentioned
streaking, Laue diffraction has also demonstrated occasionally the presence of lattice misorientations that could be related to planar defects such as twins or low angle grain boundaries.48 The
origin of such defects is an open ques-tion: they might be due to a rearrange-ment of the statistically stored disloca-tions under the influence of FIB or they may arise during sample handling prior or after FIB synthesis. Independent on their origin, the presence of planar de-fects in the pillar body or at the pillar base may induce dislocation pile up ef-fects. To what extent FIB damage will
influence the mechanical behavior will strongly depend on the initial micro-structure. It can be anticipated that FIB damage will have a minor influence on the measured strength for pillars hav-ing a microstructure with an internal length scale that is much smaller com-pared to the pillar size, such as for in-stance, nanoporous or nanocrystalline pillars.51
In summary, Laue diffraction dem-onstrates that it is not justified to ne-glect a priori a possible influence of the FIB synthesis procedure on the mechanical properties of small-scale single crystal objects.
expLoring the boundary conditionS of micro-compreSSion As mentioned in the introduction, several simulations have been per-formed to explore the stress distribu-tion upon loading depending on the crystal orientation, the lateral friction, and the sample geometry.30–32 In what
follows we describe how Laue diffrac-tion can be used as a complementary tool to investigate these important as-pects.
Figure 5 shows the compression de-formation curves and the Laue maps taken from an 8 µm nickel pillar made by M.D. Uchic using the FIB lathe mill-ing technique. The vertical axis for the pillar corresponds closely with a 〈123〉 orientation (within 2°) and the pillar was found to be free of planar defects prior to deformation. Moreover, as the pillar is rather big, the streaking due to the FIB procedure was found to be neg-ligible. The pillar was deformed in-situ during Laue diffraction52 and subjected
to three subsequent load-unload cycles. Figure 5a shows the corresponding stress-strain curves together with the stress-strain curve obtained from an ex-situ deformation on a 10 µm pillar with a 〈269〉 crystal orientation (courtesy M. Uchic). Comparing the flow stresses of the 8 µm in-situ deformed sample and of the 10 µm ex-situ deformed sample, the values correspond approximately with what could be expected from the smaller is stronger effect (see also Figure 1). Figure 5b displays an SEM image of the pillar before deformation and after loading cycle 3. The slip lines indicate significant localized slip in the
lower half of the pillar and are in agree-ment with the slip plane containing the slips systems with the largest Schmid factor. Because of the relatively large size of the pillar compared the x-ray beam, spatial revolved diffraction pat-terns could be taken before loading and after every loading step (Figures 5c and d). Inspecting the Laue map of the in-situ deformed pillar after loading cycle 1 (Figure 5c) clearly evidences the presence of early plasticity at the top of the pillar. On the other hand the low-er part of the pillar remains relatively unaffected. A similar Laue map taken after unloading from the third loading cycle (Figure 5d) shows the presence of lattice misorientations at the top and at the bottom of the pillar, in particular in the region of localized slip. Further-more the upper half of the crystal has rotated relative to the support by ap-proximately 1°. Apart from the region near the top the diffraction peaks in this upper half exhibit mild broadening. In view of the simulations per-formed by Akarapu et al.,32 plasticity
that starts at the top may be related to the presence of lateral constraints, an idea further supported by the pres-ence of significant lattice rotations.39
Note however, that the upper part of the pillar did move laterally, indicating that the system is far from fully rigid. Furthermore the observed features may also be evoked by a small misorienta-tion between the indenter and the pil-lar axis. An in-situ investigation on Au pillars accompanied by crystal plastic-ity FEM simulations has demonstrated that small misorientations between pil-lar axis and compression anvil can re-sult in the selection of a slip system that is geometrically not predicted,53 as will
be discussed in the “in-situ” example below.
In summary, the use of micro-Laue diffraction allows exploration of the details of the microstructural evolution upon applying load, which, together with a computational approach, will allow improvement of our understand-ing of the boundary conditions of the micro-compression technique in rela-tion to the sample geometry and initial defect content, as well as exploration of whether these conditions eventually contribute to the observed smaller is stronger trend.
in-Situ Laue diffraction during deformation In-situ Laue diffraction is an ideal method to study several aspects of the evolving microstructure during load-ing. For instance, the way the crys-tal orientation changes can be used as an indication for the activated slip system(s). This allows the study of the applicability of Schmid’s law in confined volumes and the role played by initial microstructure on the selec-tion of the slip systems. Other features that can be studied are, for instance, the formation of geometrically necessary boundaries at larger strains and phase transformations.54 In what follows this
is demonstrated for the case of a gold micropillar.
Figure 6 shows the compression deformation curve and information obtained from the Laue measurements for a 2.2 µm gold sample with a com-pression axis corresponding with a 〈123〉 crystallographic axis (i.e., the pillar is oriented for single slip). The geometrically predicted slip system is the (111)[101] for which the Schmid factor amounts 0.47. Before loading, the Laue diffraction peaks evidenced a small amount of streaking that, when expressed in terms of excess disloca-tions36 would correspond with a (111)
[101] slip system. This slip system has a relative low Schmid factor of 0.36. The orientation of the plane is shown in the inset of Figure 6a together with the orientation of the (111) plane con-taining the slip system with the high-est Schmid factor. Figure 6a shows the stress-strain curve with the correspond-ing numbers of the Laue diffraction patterns recorded in-situ during defor-mation. Figure 6b displays the shape of the (222) Laue reflection during the initial raise of the stress-strain curve. Upon loading all recorded Laue peaks broaden in the same direction as the initial streaking direction, addi-tionally the peak position moves. The path (in detector units) followed by the (222) reflection during deformation is shown in Figure 6c. An arrow marks the peak position prior to deformation. The first movement of each diffraction peak (colored blue) is closely follow-ing one line indicated with the arrow, corresponding to the rotation direction
expected when slip occurs on the (111) plane. Both initial rotations correspond to dislocation activity on a geometrical-ly less favorable slip plane. After load-ing up to about 55 MPa, a rather abrupt change in path of the Laue peak is ob-served (colored orange), corresponding to dislocation activity predominantly on the classically predicted slip plane (111), which comprises the slip sys-tem with the highest SF. Such a behav-ior was observed for all recorded Laue peaks. Note that SEM observations after deformation indicated the pres-ence of slip lines for both observed slip systems. From the path followed by all Laue spots the rotation of the vertical
crystal axis can be derived by means of full Laue pattern fitting, providing details on the development of the rota-tional gradients during deformation of a single crystal, as is demonstrated in Reference 53.
In summary, the above example demonstrates the existence of two de-formation regimes in FIB single-crys-tal face-centered-cubic pillars. The first one corresponds to the activity on slip systems different from those that are geometrically predicted for uniaxial compression. The second one corre-sponds with the highest Schmid factor anticipated for ideal uniaxial compres-sion conditions. The first deformation
regime is probably to be associated with the boundary conditions of the test. More analysis is, however, need-ed to pin down the origin of this non-Schmid behavior. For that it would be necessary to investigate the role of ini-tial streaking that is observed in small pillars that are synthesized by FIB, meanwhile not neglecting the role of small misalignments that are unavoid-able, even when the test is performed in an SEM. Crystal plasticity finite element simulations performed in the group of Raabe and coworkers on a gold pillar with similar dimensions and the same crystal orientation have demonstrated the importance of small
Figure 6. (a) Stress-strain response of a 2.2 mm 〈123ñ Au pillar. The numbers of the Laue patterns recorded in-situ during deformation are indicated. The inset displays the orientation of the (111) and (111) slip planes in the pillar. (b) Two-dimensional representation of the (222) peak for the indicated Laue pattern number; (c) path followed by the (222) peak on the detector plane during deformation. The arrows indicate the directions expected for slip on the indicated slip planes. (d) Average shear rates on all 12 slip systems for the compression of micropillars of the same orientation, geometry, and taper as investigated in the current experiments. The boundary conditions were compression at zero friction and tool inclination of 2° off the ideal punch direction (SF, Schmid factor).
X-position (a.u.) Engineering Strain (%)
Position (a.u.) Position (a.u.) Position (a.u.) Engineering Strain (%) 0.2 0.3 0.4 0.1 0.0 Y-position (a.u.) Av er
aged Shear Rate (s
–1) Nor maliz ed Intensity Engineer ing Stress (MP a) Nor maliz ed Intensity Nor maliz ed Intensity 0.08 0.07 0.06 0.05 0.04 0.03 0.02 0.01 0.00 1 1 1 0.8 180 150 120 90 60 30 0 0.8 0.8 0.6 0.6 0.6 0.4 0.4 0.4 0.2 0.2 0.2 0 0 0 0 20 40 60 80 100 0 20 40 60 80 100 0 20 40 60 80 100 0 5 10 15 20 a b c d
S. Van Petegem is a TMS Member!
To read more about him, turn to page 9. To join TMS, visit www.tms.org/Society/Membership.aspx. misorientations.53 Under a 2° tool
incli-nation and zero friction, the simulation show fi rst an activity on two slip sys-tems that are geometrically unexpected if a perfect uniaxial compressive stress state is anticipated, before the expected system fi nally becomes dominant, as is shown in Figure 6d. Beyond 0.3% strain the geometrically predicted slip system reaches the highest shear rate.
concLuSionS
The above examples demonstrate that in-situ Laue microdiffraction is an excellent tool to investigate some of the open questions related to micro-compression and small scale testing in general. Laue diffraction can give in-formation on the initial microstructure in some of the samples, the infl uence of FIB synthesis method on the deforma-tion behavior of pillars with diameters below 5 µm, the infl uence of friction on the activated slip systems, the effect of initial misorientations on the out-come of a compression test, etc. When combined with computational methods such as those in References 30–32 it will provide the correct understand-ing of the boundary conditions of the micro-compression test.
But there is an even brighter future for Laue microdiffraction in combina-tion with micro-compression. Laue diffraction has the potential to answer questions of crucial importance related to the observed smaller-is-stronger trend. It will allow differentiating what comes from nucleation aspects16 and
what comes from hardening aspects.53
Indeed, since Laue diffraction allows following the different activated slip systems, it has potential to provide ad-ditional details on the size dependent hardening in single crystals. Again, to achieve such a goal, experiments will have to be accompanied by simula-tions. In particular, the combination with discrete dislocation plasticity methods is very promising.55–59
acKnowLedgementS
The authors gratefully acknowledge the great support of the MicroXAS beamline crew: Dr. D. Grolimund, Dr. C. Borca, and M. Willimann. Thanks go also to the collaborating groups of Dr. E.P. George, Dr. M.D. Uchic, and Dr. C.A. Volkert who provided pillars dis-cussed in this paper and to the Ph.D. students of the Material Science and Simulation group, R. Maaß, J. Zimmer-mann, C. Marichal, M. Weisser, and S. Pierret.
refere nces
1. D. Hull and D.J. Bacon, Introduction to Dislocations (Oxford: Butterworth-Heinemann, 2 001).
2. J.R. Weertman and J. Weertman, Elementary
Dislocation Theory (New York: Oxford University
P ress, 1992).
3. A.S. Argon, Strengthening Mechanism in Crystal
Plasticity, Oxford Series on Materials Modelling (New
York: Oxford University Press, 2 007).
4. J.R. Weertman, in: Nanostructured Materials;
Processing, Properties and Applications, ed. C.C.
Koch (Norwich, NY: William Andrews Publishing, 2002), p. 397.
5. E. Arzt, Acta Mater., 46 (1998), pp. 5611– 5626. 6. Y. Estrin, H.S. Kim, and F.R.N. Nabarro, Acta Mater., 55 (2007), pp. 6401– 6407.
7. H. Van Swygenhoven and J.R. Weertman, Materials
Today, 9 (2006), p . 24.
8. H. Van Swygenhoven et al., Phys. Rev. B, 66 (2004), 02 4101.
9. Z. Budrovic et al., Science, 304 (2004), p. 273. 10. H. Van Swygenhoven et al., Acta Mater., 54 (2006), pp. 1975– 1983.
11. M.D. Uchic et al., Materials Research Society
Symposium Proceedings, vol. 753, ed. E.P. George
et al. (Warrendale, PA: Materials Research Society, 2003), pp. BB1.4.1–BB1 .4.6.
12. M.D. Uchic et al., Science, 305 (2004), p. 986. 13. M.D. Uchic and D.A. Dimiduk, Mater. Sci. Eng. A, 400 (2005), p. 268.
14. D.M. Dimiduk et al., Acta Mater., 53 (2005), p. 4065. 15. C. Motz et al., Acta Mater., 53 (2005), p. 4269. 16. J.R. Greer and W.D. Nix, Phys. Rev. B, 73 (2006), 24 5410.
17. C.A. Volkert and E.T. Lilleodden, Philos. Mag., 86 (2006), p. 5567.
18. D. Kiener et al., Adv. Eng. Mater., 8 (2006), p. 1119. 19. D.M. Dimiduk et al., Science, 312 (2006), p. 1188. 20. C.P. Frick et al., Acta Mater., 55 (2007), p. 3845. 21. D. Kiener et al., Acta Mater., 56 (2008), p. 580. 22. J.R. Greer et al., Mater. Sci. Eng. A, 493 (2008), p . 21.
23. C.P. Frick et al., Mater. Sci. Eng. A, 489 (2008), p. 319.
24. K.S. Ng and A.H.W. Ngan, Acta Mater., 56 (2008), p. 1712.
25. H. Tang et al., Phys. Rev. Lett., 100 (2008), 1 85503 26. “DIN 50106 - Testing of Metallic Materials; Compression Test” (Deutsches Institut Für Normung E.V., Burggrafenstraße 6, 10787 Berlin, Germany; 1 978).
27. Y.S. Choi et al., Scripta Mater., 57(2007), p. 849. 28. H. Zhang et al., Scripta Mater., 54 (2006), p. 181. 29. D. Kiener et al., Intern. J. Mater. Sci., 98 (2007), pp. 1047– 1053.
30. D. Raabe et al., Acta Mater., 55 (2007), pp. 4567– 4583.
31. P.A. Shade et al., Acta Mater., 57 (2009), p. 4580. 32. S. Akarapu et al., Intern. J. Plast., 26 (2010), pp. 239 –257.
33. D. Kiener et al., Mater. Sci. Eng. A, 459 (2007), pp. 262 –272.
34. H. Bei et al., Appl. Phys. Lett., 91 (2007), 11 1915. 35. S. Shim et al., Acta Mater., 57 (2009), p. 503. 36. G.E. Ice and R.I. Barabash, in: Dislocation in Solids, Vol. 13, ed. F.R.N. Nabarro and J.P. Hirth (Amsterdam: Elsevier, 2007), Chapte r 79.
37. R.I. Barabash, G.E. Ice, and F.J. Walker, J. Appl.
Phys., 93 (2003), p. 1457.
38. G.I. Taylor, Proc. R. Soc. Lond. Ser. A-Contain. Pap.
Math. Phys. Character, 116 (1927), p . 16.
39. W.F. Hosford, The Mechanics of Crystals and
Textured Polycrystals (Oxford, U.K.: Oxford University
Press, 1 993).
40. W.W. Gerberich et al., J. Mater. Res., 13 (1998), p. 421.
41. R. Maass et al., Phys. Rev. Lett., 99 (2007), 14 5505. 42. H. Bei et al., Scripta Mater., 57 (2007), p. 397. 43. S.S. Brenner, J. Appl. Phys., 28 (1957), p. 1023. 44. H. Bei et al., Acta Mater., 56 (2008), p. 4762. 45. D.M. Norfl eet et al., Acta Mater., 56 (2008), p. 2988. 46. J. Zimmermann et al., Scripta Mater., 62 (2010), pp. 746 –749.
47. H. Bei et al., Appl. Phys. Lett., 93 (2008), 07 1904. 48. R. Maass et al., Scripta Mater., 59 (2008), p. 471. 49. R. Maass et al., Appl. Phys. Lett., 89 (2006), 15 1905.
50. R. Maass et al., Appl. Phys. Lett., 91 (2007), 13 1909.
51. S. Van Petegem et al., Nanoletters, 9 (2009), p. 1158.
52. R. Maass, Ph.D. Thesis EPFL 4468, Lausanne, Switzerland (2009).
53. R. Maass et al., Acta Mater., 57 (2009), p. 5996. 54. C.P. Frick et al., Scripta Mater., 62 (2010), p. 492. 55. J. Senger et al., Scripta Mater., 58 (2008), pp. 587 –590.
56. J. Senger et al., Phil. Mag., 90 (2010), pp. 617 –628. 57. C. Motz et al., Acta Mater., 57 (2009), pp. 1744– 1754.
58. C.R. Weinberger and W. Cai, Proc. Nat. Acad. Sci., 105 (2009), pp. 14304–1 4307.
59. J.A. El-Awady et al., Phys. Rev. B, 80 (2009), 104104.
H. Van Swygenhoven, group leader, and S. Van Petegem, senior scientist, are with Material Sci-ence and Simulations, ASQ/NUM, Paul Scherrer Institut, CH-5232 Villigen, Switzerland. Prof. Van Swygenhoven is also with the Mechanical Metal-lurgy Laboratory at Ecole Polytechnique Federale de Lausanne.