DOI 10.1007/s10584-008-9492-z
The IPCC on a heterogeneous Medieval Warm Period
Jan Esper· David FrankReceived: 18 July 2007 / Accepted: 1 August 2008 / Published online: 17 September 2008 © Springer Science + Business Media B.V. 2008
Abstract In their 2007 report, IPCC working group 1 refers to an increased hetero-geneity of climate during medieval times about 1000 years ago. This conclusion would be of relevance, as it implies a contrast in the spatial signature and forcing of current warmth to that during the Medieval Warm Period. Our analysis of the data displayed in the IPCC report, however, shows no indication of an increased spread between long-term proxy records. We emphasize the relevance of sample replication issues, and argue that an estimation of long-term spatial homogeneity changes is premature based on the smattering of data currently available.
1 Introduction
In their fourth assessment report (AR4), the IPCC specifically addressed tempera-tures during the Medieval Warm Period (MWP) (IPCC2007). Box 6.4 on page 468 shows eight, millennium-long proxy based temperature reconstructions from various places on the Northern Hemisphere. From this compilation it is concluded that the “wide spread of values exhibited by the individual records” is indicative for “the heterogeneous nature of climate during MWP”.
Such heterogeneity alone is often used as a distinguishing attribute to contrast with present anthropogenic warming. Twentieth century temperature homogeneity is – besides the level and rate of recent warming – sometimes considered as an indicator for a greenhouse-gas-forced climate, and as such, estimation of pre-industrial climatic heterogeneity would be of relevance to the attribution of the anthropogenic impact on recent warmth (Jones and Mann2004).
J. Esper (
B
)· D. FrankSwiss Federal Research Institute WSL, 8903, Birmensdorf, Switzerland e-mail: [email protected]
J. Esper
Herein, we demonstrate that the records reproduced in AR4 do not exhibit systematic changes in coherence, and thus cannot be used as evidence for long-term homogeneity changes. We suggest that before conclusions of changes in homogeneity can be robustly identified (or excluded) properties and potential biases of the proxy data must be considered. Accordingly, we stress the relevance of data replication changes, analyze some variance and wavelength properties of the long-term proxy records shown in AR4, and argue that there are currently too few proxy data to derive conclusions on MWP large-scale temperature patterns.
2 AR4 proxy records
Proxies shown in the AR4 include an ice core record from W Greenland (Fisher et al. 1996), a multi-proxy record from E Asia (Yang et al. 2002), and six tree-ring records representing: SW Canada (Luckman and Wilson2005), W USA (Lloyd and Graumlich 1997), N Sweden (Grudd et al. 2002), NW Russia (Hantemirov and Shiyatov 2002), N Russia (Naurzbaev et al. 2002), and Mongolia (D’Arrigo et al.2001). The tree-ring chronologies are all combinations of samples from living trees with relict/historical material. These temporally overlapping data have been matched using ‘crossdating’, a technique introduced in the early 20th century into dendrochronology (Douglass1929), so that every ring is assigned a calendar year. Application of this method allowed for the development of continuous, millennium-long tree-ring chronologies, even though the single trees included in such a record may have only reached ages of 200 years or less. The Greenland ice core proxy integrates severalδ18O timeseries that were first detrended to remove non-climatic
long-term trends and then combined to a single record. The regional multi-proxy record from E Asia combines a total of nine different proxies, including tree-ring, ice core, peat bog, lake sediment, and documentary data. As some of these proxies are not annually resolved, decadal variance is substantially reduced in the combined timeseries.
Importantly, all tree-ring records shown in AR4 were detrended using a method known as ‘Regional Curve Standardization’ (RCS; Esper et al.2003). This technique allows the preservation of centennial scale climate variability, even if the tree-ring chronologies are composed of relatively short segments of material from living trees and historical wood (Cook et al.1995). Application of RCS is essential to reconstruct the low frequency spectrum of temperature variability including long-term cooling trends (Esper et al.2004) and thus necessary to estimate the spatial extent of MWP (Broecker2001).
3 Methods
To quantify temporal homogeneity changes, we calculated the 5–95% range of the proxy distribution for each year estimated by bootstrapping (1000 replications) and, as an alternative measure, two standard errors (SE) between the eight AR4 proxy records over the 950–1982 common period. SE was also computed over the less replicated 850–949 period (seven records), and the late 1983–1995 period during
which replication declines to only 3 records from Asia (NW Russia, N Russia, Mongolia).
Temporal variance changes in the eight AR4 records are analyzed by calculating the standard deviation in a 100-year window shifted along each of these timeseries. This approach allows for an assessment of longer term variance drifts that are potentially not related to climate. The analysis is supplemented by the application of MTM power spectra (Mann and Lees1996) calculated over the 950–1982 common period using a 5-year resolution and 3 tapers. The spectra were particularly analyzed for differences in low frequency variance retained in the AR4 proxy records.
4 Results
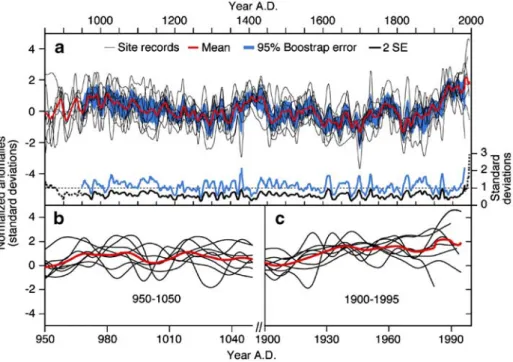
Both the bootstrap and SE measures demonstrate that there is no increased spread of values during the MWP (Fig.1). SE is actually largest during recent decades – this is at least partly related to diverging trends in late 20th century tree-ring records (Cook et al. 2004). This quantification of proxy data coherence suggests that it was erroneous to conclude that the records displayed in AR4 are indicative for a heterogeneous climate during the MWP.
Fig. 1 Proxy records as shown in AR4 to highlight “the heterogeneous nature of climate during the Medieval Warm Period”. (a) Black curves are eight individual proxies (smoothed with a 20-year filter and normalized over 1001–1980), red curve the mean, and blue area the 5–95% bootstrap range of the proxy distribution. Black (dashed before 950 and after 1982 when fewer than eight records exist) and blue curves at the bottom are two standard errors (SE) and the bootstrap range from above, respectively. (b–c) Proxy records (black) and mean (red) over the 950–1050 and 1900–1995 periods
5 Discussion
Conclusions on potential long-term homogeneity changes are closely linked with the selection of proxy records of past temperatures. This process, however, is poorly detailed in AR4. Generally, proxy selection based on the match with hemispheric scale instrumental temperature averages (Hegerl et al.2007; Mann and Jones2003) increases the chance for greatest homogeneities during the 20th century. This is especially so when selection is made against a single and thus unifying target, in a procedure that disregards the spatial variability of recent temperature trends over the Northern Hemisphere. The period used for normalization can also affect estimates of heterogeneity: modern homogeneity may even be a simple outcome of calibration over the recent instrumental period (Briffa and Osborn2002; Esper et al.2005; see also Bürger2007; Osborn and Briffa2007).
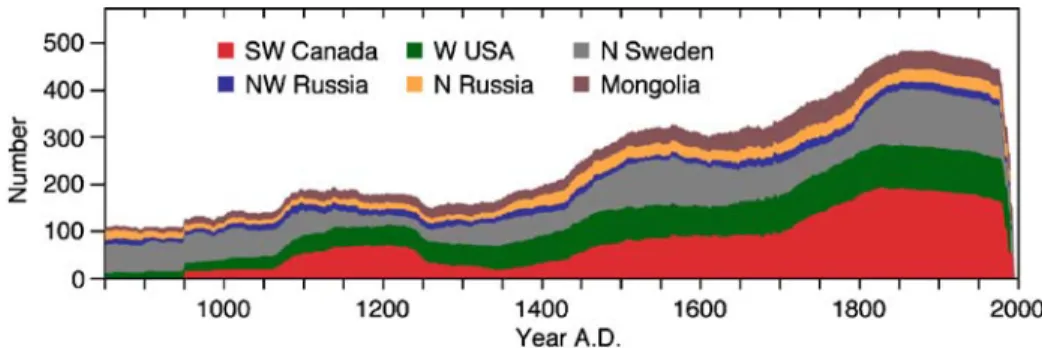
The analysis of long-term climate heterogeneity can, however, not be solely based just on the comparison of the final products, but also has to consider some of the underlying issues of proxy timeseries development (Frank et al.2007a). From this perspective, the ‘non-heterogeneous’ MWP conditions are actually surprising, as the number of measurement series included in the AR4 tree-ring chronologies declines considerably over the past millennium – from 480 in 1900 to only 132 in 1000 (Fig.2). These data are also geographically limited with about three quarters from Canada, the US, and Sweden. Temporal replication changes, while often ignored, are common in tree-ring based reconstructions. They affect the quality of the climate signal (Wigley et al.1984), and by introducing more random fluctuations can leave the erroneous impression of increased heterogeneities. These limitations are particularly relevant in RCS-detrended chronologies, such as shown in AR4, as this method requires higher replications than standard techniques (Esper et al.2002). Robust estimation of early millennium low frequency climate signals can further be complicated, as the site control of tree-ring samples is generally reduced back in time, and living in situ trees are replaced with older historical material from less well defined sites (Büntgen et al.2005). This change in site control can affect the precise estimation of long-term trends when using RCS.
While such changes in sample quality and replication are effectively relevant in all long-term tree-ring records, estimations of homogeneity changes using other proxy sources might be limited due to other reasons. For example, ice cores, stalagmites,
Fig. 2 Number of measurement series included in the six tree-ring proxy records shown in AR4. Tree-ring records are from SW Canada, W USA, N Sweden, NW Russia, N Russia, and Mongolia
or lake sediments are typically affected by reduced dating control and associated lowered resolution back in time (Blass et al. 2007; Fisher et al. 1996; Tan et al. 2006). These changes, however, can affect the estimation of long-term heterogeneity changes, as higher resolution climatic events are not accurately matched, and earlier periods appear less homogenous.
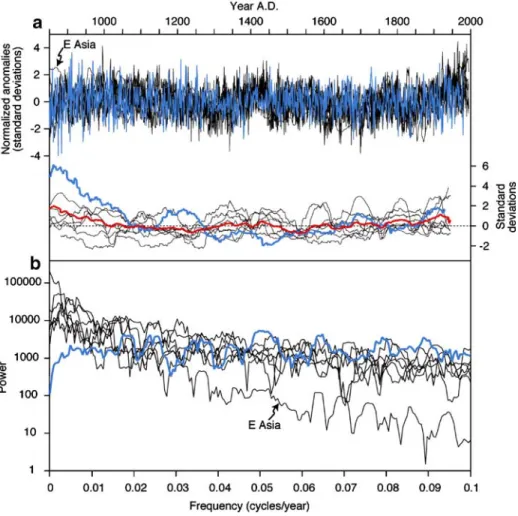
Basic time-series diagnostics also revealed that the year-to-year variability in one of the AR4 records – the stackedδ18O series from Greenland – steadily increased
prior to ∼1100, and that this record had a power-spectrum that is both different from all other records and indicative of limited preservation of low-frequency climate variability (Fig.3). Variance drifts, often artificial and related to replication changes,
Fig. 3 Variance and spectral properties of the AR4 proxy records. (a) Top panel shows the eight proxies (here non-smoothed, normalized over 1001–1980), with theδ18O composite from W
Greenland highlighted in blue. Curves at the bottom are (normalized) standard deviations of the individual proxy records calculated over 100-year moving windows. Results for W Greenland shown in blue; mean of all standard deviation timeseries in red. (b) MTM power spectra of the AR4 proxy records (W Greenland in blue). Multi-proxy record from E Asia labeled with an arrow to highlight the varying shape of the spectral density of this lower resolution time series
are widespread in proxy-records, and for example, confuse the estimation of extreme year return intervals and the magnitude, in degrees C, of past climatic fluctuations (Frank et al.2007b). Such time-series qualities (variance drift, “whiter” spectrum), increase the probability for a record to be anomalous, and are not supportive for an estimation of long-term climatic change.
6 Conclusions
The debate on MWP heterogeneity started over a decade ago, when Hughes and Diaz (1994) compared several long-term climate reconstructions available that time. This early analysis, however, suffered from comparing tree-ring records where the low-frequency climate variability was preserved (i.e., RCS detrended) with non-RCS chronologies, and overlooking sample replication issues. These factors helped in reaching the conclusion that the MWP was heterogeneous. Since then, several large-scale studies have been published demonstrating that data sparseness and low replication before about 1200 introduce random variations in the single records and increase uncertainty in any subsequent hemispheric scale average (Cook et al.2004; D’Arrigo et al. 2006; Frank et al. 2007b). This evidence should not be confused with spatially heterogeneous temperatures during MWP. Given the wide acceptance of the AR4 and the notion of a more chaotic climate towards the Dark Ages, it thus seems relevant to recall that we currently do not have sufficient widespread, high-resolution proxy data to soundly conclude on the spatial extent of warmth during MWP.
Acknowledgements We thank Wally Broecker for discussion. Supported by the Swiss National Science Foundation through the National Centre for Competence in Climate Research (NCCR-Climate), and the EC project Millennium (Grant No. 017008).
References
Blass A, Grosjean M, Troxler A, Sturm M (2007) How stable are twentieth-century calibration models? A high-resolution summer temperature reconstruction for the eastern Swiss Alps back to AD 1580 derived from proglacial varved sediments. Holocene 17:51–63
Briffa KR, Osborn TJ (2002) Blowing hot and cold. Science 295:2227–2228 Broecker WS (2001) Was the Medieval Warm Period global? Science 291:1497–1499
Büntgen U, Esper J, Frank DC, Nicolussi K, Schmidhalter M (2005) A 1052-year tree-ring proxy for Alpine summer temperatures. Clim Dyn 25:141–153
Bürger G (2007) Comment on the spatial extent of 20th-century warmth in the context of the past 1200 years. Science 316:1844a
Cook ER, Briffa KR, Meko DM, Graybill DA, Funkhouser G (1995) The ‘segment length curse’ in long tree-ring chronology development for palaeoclimatic studies. Holocene 5:229–237 Cook ER, Esper J, D’Arrigo R (2004) Extra-tropical Northern Hemisphere temperature variability
over the past 1000 years. Quat Sci Rev 23:2063–2074
D’Arrigo R, Jacoby G, Frank D, Pederson N, Cook E, Buckley B, Nachin B, Mijiddorj R, Dugarjav C (2001) 1738 years of Mongolian temperature variability inferred from a tree-ring width chronology of Siberian pine. Geophys Res Lett 28:543–546
D’Arrigo R, Wilson R, Jacoby G (2006) On the long-term context for late twentieth century warming. J Geophys Res 111:D03103
Douglass AE (1929) The secret of the Southwest solved by talkative tree rings. Natl Geogr Magazine 56:736–770
Esper J, Cook ER, Schweingruber FH (2002) Low-frequency signals in long tree-ring chronologies and the reconstruction of past temperature variability. Science 295:2250–2253
Esper J, Cook ER, Krusic PJ, Peters K, Schweingruber FH (2003) Tests of the RCS method for preserving low-frequency variability in long tree-ring chronologies. Tree-Ring Res 59:81–98 Esper J, Frank DC, Wilson RJS (2004) Climate reconstructions – low frequency ambition and high
frequency ratification. EOS 85:113–120
Esper J, Wilson RJS, Frank DC, Moberg A, Wanner H, Luterbacher J (2005) Climate: past ranges and future changes. Quat Sci Rev 24:2164–2166
Fisher DA, Körner RM, Kuiviner K, Clausen HB, Johnson SJ, Steffensen JP, Gunderstrup N, Hammer CU (1996) Intercomparsion of ice core and precipitation records from sites in Canada and Greenland over the last 3500 years and over the last few centuries in detail using EOF techniques. In: Jones PD et al (eds) Climatic variations and forcing mechanisms of the last 2000 years. Springer, Berlin, pp 297–328
Frank D, Büntgen U, Böhm R, Maugeri M, Esper J (2007a) Warmer early instrumental measure-ments versus colder reconstructed temperatures: shooting at a moving target. Quat Sci Rev 26:3298–3310
Frank D, Esper J, Cook ER (2007b) Adjustment for proxy number and coherence in a large-scale temperature reconstruction. Geophys Res Lett 34. doi:10.1029/2007GL030571
Grudd H, Briffa KR, Karlén W, Bartholin TS, Jones PD, Kromer B (2002) A 7400-year tree-ring chronology in northern Swedish Lapland: natural climatic variability expressed on annual to millennial timescales. Holocene 12:657–665
Hantemirov SM, Shiyatov SG (2002) A continuous multi-millennial ring-width chronology in Yamal, northwestern Siberia. Holocene 12:717–726
Hegerl GC, Crowley TJ, Allen M, Hyde WT, Pollack HN, Smerdon J, Zorita E (2007) Detection of human influence on a new, validated 1500-year temperature reconstruction. J Clim 20:650–666 Hughes MK, Diaz HF (1994) Was there a ‘Medieval Warm Period’, and if so, where and when? Clim
Change 26:109–142
IPCC (2007) Climate change 2007. Physical Science Basis, Cambridge
Jones PD, Mann ME (2004) Climate over past millennia. Rev Geophys 42. doi:10.1029/ 2003RG000143
Lloyd AH, Graumlich LJ (1997) Holocene dynamics of tree line forests in the Sierra Nevada. Ecology 78:1199–1210
Luckman BH, Wilson RJS (2005) Summer temperatures in the Canadian Rockies during the last millennium: a revised record. Clim Dyn 24:131–144
Mann M, Jones P (2003) Global surface temperatures over the past two millennia. Geophys Res Lett 30:1820–1823
Mann ME, Lees JM (1996) Robust estimation of background noise and signal detection in climatic time series. Clim Change 33:409–445
Naurzbaev MM, Vaganov EA, Sidorova OV, Schweingruber FH (2002) Summer temperatures in eastern Taimyr inferred from a 2427-year late-Holocene tree-ring chronology and earlier floating series. Holocene 12:727–736
Osborn T, Briffa KR (2007) Response to comment on the spatial extent of 20th-century warmth in the context of the past 1200 years. Science 316:1844b
Tan M, Baker A, Genty D, Smith C, Esper J, Cai B (2006) Applications of stalagmite laminae to paleoclimate reconstructions: comparison with dendrochronology/climatology. Quat Sci Rev 25:2103–2117
Wigley TML, Briffa KR, Jones PD (1984) On the average of correlated time series, with applications in dendroclimatology and hydrometeorology. J Clim Appl Meteorol 23:201–213
Yang B, Bräuning A, Johnson KR, Yafeng S (2002) General characteristics of temperature variation in China during the last two millennia. Geophys Res Lett 29. doi:10.1029/2001GL014485