SHORT COMMUNICATION
Could digital imaging be an alternative
for digital colorimeters?
Alper Caglar&Kivanc Yamanel&Kamran Gulsahi&
Bora Bagis&Mutlu Özcan
Received: 27 April 2009 / Accepted: 27 July 2009 / Published online: 18 August 2009 # Springer-Verlag 2009
Abstract This study evaluated the colour parameters of composite and ceramic shade guides determined using a colorimeter and digital imaging method with illuminants at different colour temperatures. Two different resin compos-ite shade guides, namely Charisma (Heraeus Kulzer) and Premise (Kerr Corporation), and two different ceramic shade guides, Vita Lumin Vacuum (VITA Zahnfabrik) and Noritake (Noritake Co.), were evaluated at three different colour temperatures (2,700 K, 2,700–6,500 K, and 6500 K) of illuminants. Ten shade tabs were selected (A1, A2, A3, A3,5, A4, B1, B2, B3, C2 and C3) from each shade guide. CIE Lab values were obtained using digital imaging and a colorimeter (ShadeEye NCC Dental Chroma Meter, Shofu Inc.). The data were analysed using two-way ANOVA, and
Pearson's correlation. While mean L* values of both
composite and ceramic shade guides were not affected
from the colour temperature, L* values obtained with the
colorimeter showed significantly lower values than those of
the digital imaging (p<0.01). At combined 2,700–6500 K
colour temperature, the means of a* values obtained from
colorimeter and digital imaging did not show significant differences (p>0.05). For both composite and ceramic
shade guides,L* and b* values obtained from colorimeter
and digital imaging method presented a high level of correlation. High-level correlations were also acquired for a* values in all shade guides except for the Charisma composite shade guide. Digital imaging method could be an alternative for the colorimeters unless the proper object– camera distance, digital camera settings and suitable illumination conditions could be supplied. However, varia-tions in shade guides, especially for composites, may affect the correlation.
Keywords Colorimeter . Colour . Digital imaging . Shade guides
Introduction
Judging the colour of a surface highly depends on the surface spectral reflectance and the spectral power distri-bution of the illuminant as well as the light source, time of the day, surrounding conditions and position of the tooth
[1–8]. The ideal colour temperature for colour reproduction
is 5,500 K. Light at this temperature is considered as “white” light. The incandescent dental unit lamp has an average colour temperature of 3,800 K. For this reason, dental unit lights should not be used during colour selection as they are too bright and cause glare yielding to eye fatigue. Standard illuminant D65 represents a phase of daylight with a correlated colour temperature of
approxi-mately 6,500 K [3,9,10]. Illuminant A, on the other hand,
A. Caglar
:
K. Yamanel:
K. GulsahiFaculty of Dentistry, Department of Prosthetic Dentistry, Başkent University,
Ankara, Turkey B. Bagis
Faculty of Dentistry, Department of Prosthetic Dentistry, Karadeniz Technical University,
Trabzon, Turkey M. Özcan (*)
Dental Materials Unit, Center for Dental and Oral Medicine, Clinic for Fixed and Removable Prosthodontics and Dental Materials Science, University of Zürich,
Zurich, Switzerland
represents light from the full radiator at absolute tempera-ture of 2,856 K, and illuminant F2 represents light from fluorescent lamp with medium colour temperature of 4,230 K. Among these, illuminant A and D65 are commonly recommended.
Tooth colour could be assessed using a shade guide, a spectrophotometer, colorimeter, film-based photography or computer analysis of digital images [2, 8, 11–13]. Unfor-tunately, common shade guides do not provide sufficient
spectral coverage of the colours present in teeth [10, 12,
14]. In fact, spectrophotometric/colorimetric approach is
attractive so it is more commonly used in dentistry, eliminating possible environmental viewing conditions
and examiner's experience [11,14–17]. On the other hand,
computer analysis of digital images produced through a digital camera also enables collection of colour values from the images [9,18,19]. Systematic error due to translucency and surface curvature could be minimised when charge-coupled device (CCD)-based imaging systems (i.e. digital
cameras or spectroradiometers) are used [9]. However, their
reliability for different shade guides under different colour temperatures are not known, to date. The objectives of this study, therefore, were to compare the digital imaging method with a colorimeter at different colour temperatures and also to compare the colour parameters for resin composite and ceramic shade guides. The null hypothesis tested were that digital imaging method would correlate well with that of a colorimeter and composite and ceramic shade guides would present similar colour parameters.
Materials and methods Shade guides and tabs
Two different resin composite shade guides, namely Charisma (Heraeus Kulzer, Hanau, Germany) and Premise (Kerr Corporation, Orange, CA, USA), and two different ceramic shade guides, Vita Lumin Vacuum (VITA Zahn-fabrik, Bad Säckingen, Germany) and Noritake (Noritake Co., Nagoya, Japan), were evaluated at three different colour temperatures (2,700 K, 2,700–6,500 K, and 6,500 K). Shade tabs that existed commonly in all shade
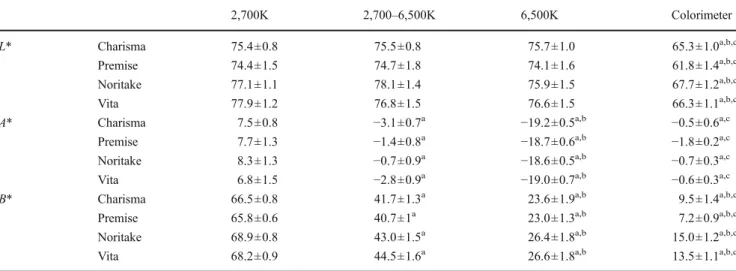
Table 1 Digital imaging at various colour temperatures of the illuminants and the colorimeter with both composite and ceramic shade guides 2,700K 2,700–6,500K 6,500K Colorimeter L* Charisma 75.4±0.8 75.5±0.8 75.7±1.0 65.3±1.0a,b,c
Premise 74.4±1.5 74.7±1.8 74.1±1.6 61.8±1.4a,b,c Noritake 77.1±1.1 78.1±1.4 75.9±1.5 67.7±1.2a,b,c Vita 77.9±1.2 76.8±1.5 76.6±1.5 66.3±1.1a,b,c A* Charisma 7.5±0.8 −3.1±0.7a −19.2±0.5a,b −0.5±0.6a,c
Premise 7.7±1.3 −1.4±0.8a −18.7±0.6a,b −1.8±0.2a,c Noritake 8.3±1.3 −0.7±0.9a −18.6±0.5a,b −0.7±0.3a,c Vita 6.8±1.5 −2.8±0.9a −19.0±0.7a,b −0.6±0.3a,c B* Charisma 66.5±0.8 41.7±1.3a 23.6±1.9a,b 9.5±1.4a,b,c
Premise 65.8±0.6 40.7±1a 23.0±1.3a,b 7.2±0.9a,b,c Noritake 68.9±0.8 43.0±1.5a 26.4±1.8a,b 15.0±1.2a,b,c Vita 68.2±0.9 44.5±1.6a 26.6±1.8a,b 13.5±1.1a,b,c The mean values forL*, a* and b* from digital imaging at various colour temperatures of the illuminants and the colorimeter with both composite and ceramic shade guides
aThe difference between 2,700 K is statistically significant (p<0.01) b
The difference between 2,700–6,500 K is statistically significant (p<0.001)
c
The difference between 6,500 K is statistically significant (p<0.001)
Fig. 1 Meana* values obtained from both digital imaging method and the colorimeter
guides (A1, A2, A3, A3,5, A4, B1, B2, B3, C2 and C3) were selected.
Colour measurement
For digital colour measurement, four fluorescent lamps (each 1,200 lm) were mounted perpendicular to the frontal plane of a tailor-made photo stand with lamps being 15 cm away from the specimen, reflecting at an angle of 45°. Specimens were placed 15 cm above the stand plane. Digital images were obtained using a digital camera (Fuji S20 Pro, Fujifilm, Tokyo, Japan) adjusted to auto white balance with a CCD sensor having 6.2 million effective pixels. Images were taken from the specimens in an object–
lens distance of 10 cm in the macro mode using manual settings (aperture: f/11; shutter speed: 1/80 s). In the first group, four fluorescent lamps (Philips PL-C 18 W/827, Koninklijke Philips Electronics N.V., Eindhoven, Nether-lands) were used with colour temperature of 2,700 K. In the second group, two fluorescent lamps of 6,500 K (Philips PL-C 18 W/865) were placed in the lower socket of the photo stand and combined with two 2,700 K fluorescent tubes placed in the upper socket. In the third group, four fluorescent lamps were used with colour temperature of 6,500 K.
From each shade tab, three digital images were obtained. Digital images were then transferred to a personal computer (PC), and colour values were calculated using a software
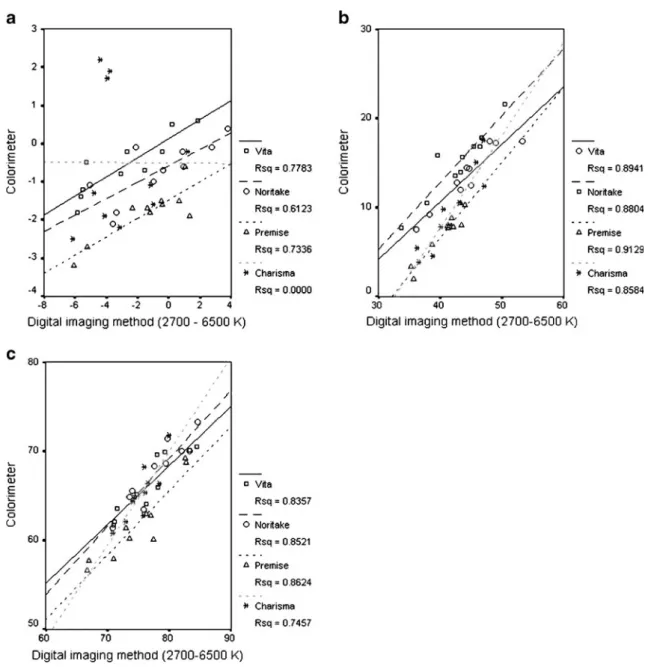
Fig. 2 a–c Correlation between digital imaging (2,700–6,500 K) and the colorimeter for a L*, b a* and c b* values for both composite and ceramic shade guides
programme (Adobe Photoshop CS2, Adobe Systems Inc., CA, USA). A measurement template was created in the middle third of the tab that consisted of a spherical area having 3.790 pixels. Colour measurements were made using a histogram tool. The data was obtained in Photoshop red, green and blue (RGB). Mean values were converted from RGB to CIE Lab (Commision Internationale de l’Eclairage, L*, a*, b*) values with EasyRGB software (Logicol S.r.l., Trieste, Italy). Colour measurements were made again from all tabs of the shade guides using a digital intraoral colorimeter (ShadeEye NCC Dental Chroma Meter, Shofu Inc., Kyoto, Japan). Before each measure-ment, the colorimeter was calibrated according to the manufacturer's recommendations. ShadeEye NCC device contains a pulsed xenon lamp as an optical light source and three-component silicon photocell as the optical sensor. The measurements were obtained from each tab by contacting the measurement tip on the middle third region of the shade tabs. Measurements were realised in the analysis mode that
givesL*, a*, b* values of the colorimeter.
Statistical analysis
Statistical analysis was performed using SPSS 11.5 for Windows, (SPSS Inc., Illinois, USA). The means of CIE Lab values of each group were analysed using two-way
analysis of variance and Student'st test. Pearson's test was
used for the correlations (α=0.05).
Results
The means ofL* values obtained from both composite and
ceramic shade guides using the digital imaging did not show significant differences at all colour temperatures
(p>0.01; Table 1). At 2,700 K, the means of a* and b*
values of both composite and ceramic shade guides did not show significant differences (p>0.01) with the digital
imaging, but both a* and b* values were significantly
affected from the colour temperatures of 2,700–6500 K (p< 0.01) and 6,500 K (p<0.001). At combined 2,700–6,500 K,
the means of a* values obtained from colorimeter and
digital imaging did not show significant differences (p> 0.05).
Regardless of the shade guide type, mean a* values
obtained under 2,700 K illuminant were more positive (more red), and, under 6,500 K illuminant, they were more
negative (more green; Fig. 1). Within the shade guides,
these values were not statistically significant (p>0.05).
For both composite and ceramic shade guides,L* and b*
values obtained from colorimeter and digital imaging method under each three-colour temperature presented a
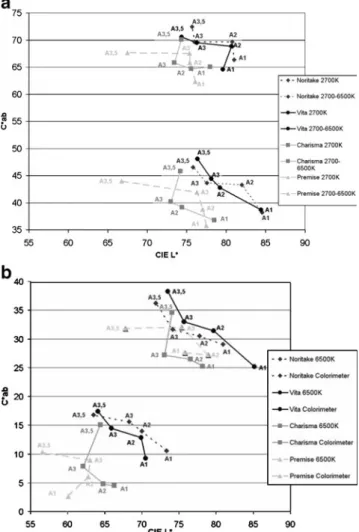
high level of correlation (Fig.2a–c).C*ab values were in
the order of 2,700 K > 2,700–6,500 K>6,500 K>
colorim-eter (Fig.3a–b). The lowestL* values were obtained with
Premise A 3,5. C*ab values of A 3,5 ceramic shade tabs
were the highest.
Discussion
In this study, when the digital imaging was performed only under 2,700–6,500 K, mean a* values did not show significant statistical differences with the colorimeter. High correlation was obtained between the digital imaging and the
colorimeter for L* and b* values. Therefore, the hypothesis
could be accepted partially. Colorimeter used in this study consists of a pulsed xenon lamp. A xenon arc lamp is a bright white light that closely mimics natural daylight (D65). When evaluating shade guides by digital imaging method, mean RGB values of three digital images were converted to CIE Lab values. The use of such softwares on PCs has
Fig. 3 a–b L* versus C*ab for representative A1, A2, A3 and A3,5 shade tabs obtained at a 2,700 K and 2700–6500 K colour temperature using the digital imaging method b 6,500 K colour temperature using the digital imaging method and the colorimeter
controversial outcome [18–20]. In those studies, the studied material was the tooth brightness and translucency after vital
bleaching using L* and RGB values. In earlier studies,
intraoral colorimeters have provided accurate and repeatable measurements compared with conventional visual shade selection since the resolution of digital colorimeters is above that of a human eye [8,9,16,21,22]. Since standard shade
guides without complicated colour blends [17] were used in
this study, the results with the colorimeter were consistent,
but b* values with the ceramic shade guides were higher
with the colorimeter. Variations inL*, a*, b* values are also
principally affected due to light transmittance characteristics of the materials [23]. In a similar study, Park et al. [10] evaluated the effect of various illuminants (D65, F2 and A illuminants) on the shade guides (Vita Lumin and
Chromas-cop) using spectrophotometer. The results indicated thatL*
and C*ab values were the most affected from the shade and the illuminant. In another study, the type of the standard light source (C, A or D65) had a significant effect of shade guides
on the L* values being slightly higher with C illuminant
[24]. In the present study,L* values were similar. This can
be due to illuminants being at the same power used in digital imaging method.
In a previous study, onlya* and b* colour parameters
showed good correlation between digital imaging method
and a spectrophotometer [11]. The results of the current
study showed good correlation between digital imaging and
the colorimeter for allL*, a*, b* values except a* values of
Charisma composite shade guide. Although the presence of
disparities in a* and b* values were not discussed in the
previous study [11], it is most probably related to the
chromaticity coordinate of the material. Different filler content of Charisma could be the reason for the disparities
in a* values in that more reflection of light during the
measurements might have affected the results. This aspect needs to be verified with other shade guides of other composites with other filler particles. In this study, no
significant differences were found for the L* values with
the digital imaging method. This was most probably because the illuminants had the same power (72 W). In this study, for the digital imaging method, illuminants on the photo table were placed at 45° and the camera (observer) at 0° for better clinical simulation [25]. Verifi-cation of the digital imaging versus colorimeter was difficult due to the variations in the light sources and the power, namely xenon lamp, was used by the colorimeter measurements and fluorescent lamp by the digital imaging. Furthermore, ShadeEye NCC device is a self-calibrating apparatus where the calibration is achieved with the calibration cap (docking station) by rotating the device according to the manufacturer. Although it may be considered as a limitation of such studies where spherical area measurements of 3.790 pixels from the digital images
cameras were compared with a self-calibrated colorimeter with possible edge loss due to the surface anatomy of shade tabs, standardisation with 45° illumination, 0° observation angle and combined 2,700–6,500 K colour temperature seems to be appropriate to achieve comparable results for the majority of the shade tabs.
Conclusions
Digital imaging method could be an alternative to the colorimeters when assessing colour in clinical dentistry unless the proper object–camera distance, digital camera settings and suitable illumination conditions are supplied. Conflict of interest The authors declare that they have no conflict of interest.
References
1. Knispel G (1991) Factors affecting the process of color matching restorative materials to natural teeth. Quintessence Int 22:525–531 2. Watts A, Addy M (2001) Tooth discolouration and staining: a
review of the literature. Br Dent J 190:309–316
3. Fondriest J (2003) Shade matching in restorative dentistry: the science and strategies. Int J Periodont Rest Dent 23:467–479 4. Yang JN, Shevell SK (2003) Surface color perception under two
illuminants: the second illuminant reduces color constancy. J Vis 3:369–379
5. Joiner A (2004) Tooth colour: a review of the literature. J Dent 32:3–12
6. Paravina RD, Kimura M, Powers JM (2006) Color compatibility of resin composites of identical shade designation. Quintessence Int 37:713–719
7. Raigrodski AJ, Chiche GJ, Aoshima H, Spiekerman CF (2006) Efficacy of a computerized shade selection system in matching the shade of anterior metal–ceramic crowns—a pilot study. Quintes-sence Int 37:793–802
8. Dozić A, Kleverlaan CJ, El-Zohairy A, Feilzer AJ, Khashayar G (2007) Performance of five commercially available tooth color-measuring devices. J Prosthodont 16:93–100
9. Guan YH, Lath DL, Lilley TH, Willmot DR, Marlow I, Brook AH (2005) The measurement of tooth whiteness by image analysis and spectrophotometry: a comparison. J Oral Rehabil 32:7–15 10. Park JH, Lee YK, Lim BS (2006) Influence of illuminants on the
color distribution of shade guides. J Prosthet Dent 96:402–411 11. Cal E, Sonugelen M, Guneri P, Kesercioglu A, Kose T (2004)
Application of a digital technique in evaluating the reliability of shade guides. J Oral Rehabil 31:483–491
12. Cho BH, Lim YK, Lee YK (2007) Comparison of the color of natural teeth measured by a colorimeter and shade vision system. Dent Mater 23:1307–1312
13. Douglas RD, Steinhauer TJ, Wee AG (2007) Intraoral determination of the tolerance of dentists for perceptibility and acceptability of shade mismatch. J Prosthet Dent 97:200–208
14. Analoui M, Papkosta E, Cochran M, Matis B (2004) Designing visually optimal shade guides. J Prosthet Dent 92:371–376
15. Douglas RD, Brewer JD (1998) Acceptability of shade differences in metal ceramic crowns. J Prosthet Dent 79:254–260
16. Klemetti E, Matela AM, Haag P, Kononen M (2006) Shade selection performed by novice dental professionals and colorimeter. J Oral Rehabil 33:31–35
17. Li Q, Wang YN (2007) Comparison of shade matching by visual observation and an intraoral dental colorimeter. J Oral Rehabil 34:848–854
18. Bentley C, Leonard RH, Nelson CF, Bentley SA (1999) Quantization of vital bleaching by computer analysis of photographic images. J Am Dent Assoc 130:809–816
19. Hasegawa A, Ikeda I, Kawaguchi S (2000) Colour and translucency of in vivo natural central incisors. J Prosthet Dent 83:418–423 20. King KA, deRijk WG (2007) Variations of L*a*b* values among
Vitapan classical shade guides. J Prosthodont 16:352–356
21. Okubo SR, Kanawati A, Richards MW, Childress S (1998) Evaluation of visual and instrument shade matching. J Prosthet Dent 80:642–648
22. Dagg H, O'Connell B, Claffey N, Byrne D, Gorman C (2004) The influence of some different factors on the accuracy of shade selection. J Oral Rehabil 31:900–904
23. Arikawa H, Kanie T, Fujii K, Takahashi H, Ban S (2007) Effect of filler properties in composite resins on light transmittance characteristics and color. Dent Mater J 26:38–44
24. Lee YK, Yoon TH, Lim BS, Kim CW, Powers JM (2002) Effects of colour measuring mode and light source on the colour of shade guides. J Oral Rehabil 29:1099–1107
25. Paul S, Peter A, Pietrobon N, Hämmerle CH (2002) Visual and spectrophotometric shade analysis of human teeth. J Dent Res 81:578–582