SCIENTIFIC ARTICLE
Diffusion tensor imaging of the median nerve: intra-,
inter-reader agreement, and agreement between two
software packages
Roman Guggenberger&Daniel Nanz&Gilbert Puippe&
Kaspar Rufibach&Lawrence M. White&
Marshall S. Sussman&Gustav Andreisek
Received: 28 June 2011 / Revised: 1 October 2011 / Accepted: 12 October 2011 / Published online: 4 November 2011 # ISS 2011
Abstract
Objective To assess intra-, inter-reader agreement, and the agreement between two software packages for magnetic resonance diffusion tensor imaging (DTI) measurements of the median nerve.
Materials and methods Fifteen healthy volunteers (seven men, eight women; mean age, 31.2 years) underwent DTI of both wrists at 1.5 T. Fractional anisotropy (FA) and apparent diffusion coefficient (ADC) of the median nerve were measured by three readers using two commonly used software packages. Measurements were repeated by two readers after 6 weeks. Intraclass correlation coefficients
(ICC) and Bland-Altman analysis were used for statistical analysis.
Results ICCs for intra-reader agreement ranged from 0.87 to 0.99, for inter-reader agreement from 0.62 to 0.83, and between the two software packages from 0.63 to 0.82. Bland-Altman analysis showed no differences for intra- and inter-reader agreement and agreement between software packages.
Conclusion The intra-, inter-reader, and agreement between software packages for DTI measurements of the median nerve were moderate to substantial suggesting that user-and software-dependent factors contribute little to variance in DTI measurements.
Keywords Magnetic resonance imaging . Diffusion tensor imaging . Median nerve . Neuropathy . Software
Abbreviations
ADC Apparent diffusion coefficient
CSA Cross-sectional area
DTI Diffusion tensor imaging
FA Fractional anisotropy
FoV Field of view
FSE Fast spin-echo
HA Hamate bone
ICC Intra-class correlation coefficient
NEX Number of excitations
MR Magnetic resonance
PI Pisiform bone
RC Radio-carpal joint
ROI Region of interest
ssSE EPI Single-shot spin-echo-based echo planar imaging
R. Guggenberger
:
D. Nanz:
G. Puippe:
G. Andreisek (*) Musculoskeletal Imaging Research Group,Department of Radiology, University Hospital Zurich, Ramistrasse 100,
CH 8091 Zurich, Switzerland e-mail: [email protected] K. Rufibach
Division of Biostatistics,
Institute for Social and Preventive Medicine, University of Zurich, Hirschengraben 84,
CH 8001 Zurich, Switzerland L. M. White
Department of Medical Imaging, Mount Sinai Hospital and the University Health Network, University of Toronto,
600 University Ave.,
Toronto, ON, Canada M5G 1X5 M. S. Sussman
Department of Medical Imaging, University Health Network, University of Toronto,
TE Echo time
TR Relaxation time
Introduction
Diffusion tensor imaging (DTI) of peripheral nerves is an emerging magnetic resonance (MR) imaging method. It provides insight into nerve microstructure by monitoring
random movement of water molecules [1].
Diffusion-weighted images show signal attenuation if diffusive pro-cesses result in a net and incoherent displacement of water molecules along the direction of a magnetic field gradient, which can be applied along any direction in the three-dimensional space. The magnitude of signal attenuation increases with higher water diffusivity, which in most tissues is restricted to different degrees along different directions of space, reflecting average geometry of local tissue architecture
[2–4]. The diffusion along a given direction can be
quantitatively assessed as the apparent diffusion coefficient (ADC). Largely orientation-independent, tissue-specific measures of the diffusion are, e.g., the trace of the diffusion tensor or its averaged eigenvalues. In contrast, parameters such as the fractional anisotropy (FA) index quantitatively
assess the“directedness” or anisotropy of the water diffusion
within the microscopic tissue structures [5]. Water diffusion
in peripheral nerve tissue typically shows marked anisotropy, since myelin sheaths and nerve fibers favor molecular diffusion along fibers but hinder diffusion perpendicular to
their course [6–8].
Recently, an increasing number of studies about DTI of
the brachial plexus [9], the optic nerves [10], the olfactory
system [11], and several peripheral nerves, e.g., the median,
radial, and ulnar nerve; the peroneal and tibial nerve; as
well as the sciatic nerve have been published [5,7,12–17].
In these studies however, a large variability exists with regard to the imaging and post-processing techniques. Sources of variability were the use of different MR scanners, coils, pulse sequences, and imaging parameters (e.g., b-values) as well as the use of different software packages for post-processing.
While most research groups are tied to the MR scanner, coil technology, and pulse sequences available on site, researchers usually have the choice of different software packages for post-processing of DTI data. The answer as to which software to choose is difficult as only some package differences are obvious, such as ease of use, amount of functionality (e.g., capability for stepless rather than step-wise zoom of images), hardware requirements, and costs, while the underlying equation-based automatic processes of DTI calculation and FA and ADC map generation are
usually hidden from direct inspection [18]. Details of the
algorithms in commercial software packages are typically not available even for commonly used packages such as FuncTool (AW FuncTool, Operator Manual, release 5326719-2EN, GE Healthcare, Waukesha, WI, USA).
Whereas detailed data for intra-subject variability in DTI of peripheral nerves have recently been published, data for
intra- and inter-reader variability still remain limited [13,
19]. Recent data from a brain DTI study showed the
reproducibility of both inter- and intra-reader measurements
was found to vary significantly [20]. In our own previous
DTI experiments on peripheral nerves, we obtained only slightly different results when calculations of DTI charac-teristics were performed by different readers. However, to the best of our knowledge, there is no study where the intra-and inter-reader agreement for the post-processing of DTI data of peripheral nerves has been evaluated.
Thus, the purpose of this study was to systematically assess the intra- and inter-reader agreement and the agreement between two commonly used software packages for DTI of the median nerve.
Materials and methods Study subjects
This is a retrospective study. The data were acquired within
a previous DTI study [12], which was approved by the
institutional research ethics board. The current use for this study is in accordance with the institutional research board approval. Written informed consent was obtained from all study subjects.
Between January and March 2008, 15 healthy volunteers (7 men, 8 women; mean/median age, 31.2/31.2 years; range, 22–44 years) were included. The inclusion criterion was age older than 18 years. Exclusion criteria were contraindications to MRI (e.g., pacemaker), pregnancy, or history of prior surgery, cardiovascular, pulmonary, endocrine, metabolic, neurological, or neuromuscular disorders. All subjects were right-handed and underwent MRI of both wrists separately. MR imaging
All MR imaging was performed on a 1.5-T MR scanner (Signa Excite HD, GE Healthcare) using an eight-channel transmit-receive wrist coil (Invivo, Orlando, FL, USA). DTI acquisition of the wrist consisted of transaxial fat-suppressed single-shot spin-echo-based echo-planar imag-ing (ssSE EPI) sequences [TR/TE, 7,000/103 ms; b-value, 1,025 mm/s2; 25 diffusion-encoding directions; matrix size, 64×64; field of view (FoV), 120×120 mm; slice thickness, 4 mm; number of slices, 22; number of excitations (NEX), 2; acquisition time, 6:18 min].
In addition to the DTI sequences, anatomic reference images were acquired by performing a standard transaxial T2-weighted fast spin-echo (FSE) sequence (TR/TE, 3,500/ 87 ms; echo train length, 11; matrix size, 256×224; FoV, 120×120 mm; slice thickness, 4 mm; number of slices, 22; NEX, 2; acquisition time, 4:26 min) in identical slice locations as the ssSE EPI sequences. All imaging was
performed in prone position with the hand extended over
the head (i.e.,“superman” position).
Post-processing
In total, DTI data from 30 wrists were available (15 study subjects, both wrists). All data were transferred to
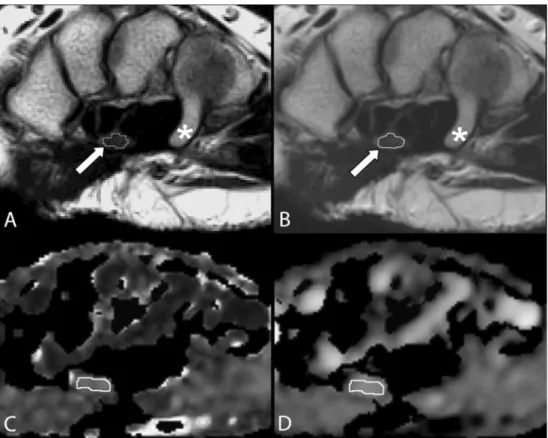
Fig. 1a–d A 26-year-old healthy woman. a Two-fold magnified transaxial T2-weighted fast spin echo MR image (TR/TE, 3,500/ 87 ms; echo-train length, 11) of the right wrist of a study subject at level of hamate (asterisk) illustrates free-hand drawing of a region of interest (ROI) that encircles the median nerve (arrow). This ROI was used to calculate the nerve cross-sectional area. Note the limited (though actual) image resolution with an irregular shaped ROI in dtiStudio. b The same MR image as in a (identical slice position and magnification factor) as dis-played with FuncTool, which offers stepless magnification and automatic application of filters. c Corresponding fractional anisot-ropy (FA) and d apparent diffu-sion coefficient (ADC) map illustrate free-hand drawing of ROI for the calculation of FA and ADC
Table 1 Descriptive statistics for cross sectional area (CSA), fractional anisotropy (FA), and apparent diffusion coefficient (ADC) measured using two different software packages
dtiStudio FuncTool
Radio-carpal joint Pisiform Hamate Radio-carpal joint Pisiform Hamate Mean ±SD Mean ±SD Mean ±SD Mean ±SD Mean ±SD Mean ±SD Reader 1 CSA (mm2) 12.59 ±2.59 12.14 ±3.5 10.45 ±2.96 14.36 ±2.52 12.30 ±3.51 11.83 ±2.9 FA 0.62 ±0.06 0.54 ±0.06 0.52 ±0.05 0.53 ±0.05 0.53 ±0.05 0.50 ±0.04 ADC (×10−3, mm2/s) 0.974 ±0.066 1.030 ±0.139 1.071 ±0.120 0.991 ±0.082 1.049 ±0.094 1.079 ±0.103 Reader 2 CSA (mm2) 14.9 ±2.77 16.68 ±3.02 13.58 ±4.48 14.79 ±2.87 12.33 ±3.93 10.88 ±3.62 FA 0.59 ±0.07 0.52 ±0.07 0.51 ±0.06 0.58 ±0.05 0.53 ±0.06 0.52 ±0.05 ADC (×10−3, mm2/s) 0.985 ±0.092 1.008 ±0.130 1.043 ±0.150 0.985 ±0.061 1.033 ±0.103 1.059 ±0.098 Reader 3 CSA (mm2) 12.46 ±2.75 12.73 ±2.65 11.40 ±2.26 14.37 ±2.82 11.57 ±3.25 12.07 ±3.03 FA 0.59 ±0.04 0.52 ±0.05 0.53 ±0.05 0.59 ±0.04 0.52 ±0.05 0.52 ±0.04 ADC (×10−3, mm2/s) 0.999 ±0.082 1.059 ±0.109 1.101 ±0.103 1.001 ±0.095 1.087 ±0.129 1.069 ±0.124 Mean values across all three anatomic locations were omitted for clarity reasons
an independent workstation and post-processed using two dedicated DTI software packages: dtiStudio (release 3.0.2, Johns Hopkins University, Baltimore, MD, USA) and FuncTool (release 6.3.1, Advantage Workstation 4.3, GE Healthcare). All post-processing was performed by two radiology residents (R.G. and G.P.; 2 and 3 years of experience in MR imaging, respectively) and one board-certified fellowship-trained musculoskeletal radiol-ogist with 5 years of expertise in DTI and 12 years of experience in MR imaging (G.A.). All readers worked independently, were blinded to the results of each other, and had dedicated knowledge in DTI post-processing. To assess the intra-reader agreement, both residents were asked to repeat the post-processing after a minimum of 6 weeks.
The first step of post-processing included semi-automatic calculation of FA and ADC maps for each wrist. The second step included region-of-interest
(ROI)–based measurements of the cross-sectional area
(CSA) and the FA and ADC of the median nerve at three different anatomic locations: at the level of the radio-carpal joint (RC), the pisiform (PI), and the hamate (HA) bone. First, ROIs for CSA measurements were drawn free-hand on an anatomic image. The ROI size depended on the nerve CSA. Due to the small size of the nerves, the software packages’ image magnifica-tion features were used for exact drawing and to ensure that the ROI exactly encircled the median nerve. dtiStudio allowed only step-wise (twofold and fourfold) magnification, whereas FuncTool offered stepless mag-nification, and in addition smoothing filters were used
for optimized display of magnified images (Fig. 1).
Second, new ROIs for FA and ADC measurements were drawn free-hand on the FA maps and then copied to the corresponding locations on the ADC maps. These ROIs were slightly smaller than the nerve CSA to avoid partial volume artifacts from surrounding fat tissue, vessels, or tendons.
Statistical analysis
All computations were performed by two authors (R.G. and K.R.) using Excel (release 12.0.6., Microsoft, Redmond, WA, USA), SPSS (release 18.0, SPSS, Chicago, IL, USA), and R including the irr package (R Foundation, Vienna, Austria). For each reader, basic descriptive statistics are presented. To assess intra-reader and inter-reader agreement as well as the agreement between both software packages, intraclass-correlation coefficients (ICC) for a two-way random effects model [ICC(2,1) in the terminology of McGraw and Wong
[21]] with 90% confidence intervals (CI) were calculated
and a Bland-Altman analysis was performed [22]. According Table
2 Intra-class correlation coef ficient (ICC) and 90% confidence interval (CI) for intra-reader agreement dtiStudio FuncT ool Radio-carpal joint Pisiform Hamate Radio-carpal joint Pisiform Hamate ICC(2,1) 90% CI ICC(2,1) 90% CI ICC(2,1) 90% CI ICC(2,1) 90% CI ICC(2,1) 90% CI ICC(2,1) 90% CI Reader 1 CSA 0.80 [0.66, 0.89] 0.56 [0.32, 0.74] 0.80 [0.65, 0.89] 0.71 [0.53, 0.83] 0.65 [0.19, 0.83] 0.54 [0.12, 0.76] F A 0.80 [0.65, 0.98] 0.91 [0.84, 0.95] 0.95 [0.91, 0.98] 0.86 [0.69, 0.93] 0.79 [0.64, 0.88] 0.69 [0.40, 0.84] ADC 0.83 [0.71, 0.91] 0.90 [0.81, 0.94] 0.96 [0.92, 0.98] 0.84 [0.64, 0.92] 0.85 [0.74, 0.91] 0.71 [0.42, 0.85] Reader 2 CSA 0.95 [0.88, 0.98] 0.79 [0.56, 0.91] 0.97 [0.90, 0.99] 0.83 [0.63, 0.93] 0.87 [0.71, 0.94] 0.94 [0.87, 0.98] F A 0.97 [0.92, 0.99] 0.99 [0.97, 0.99] 0.98 [0.96, 0.99] 0.91 [0.79, 0.96] 0.97 [0.91, 0.99] 0.97 [0.92, 0.99] ADC 0.71 [0.42, 0.87] 0.96 [0.90, 0.98] 0.89 [0.74, 0.96] 0.94 [0.85, 0.97] 0.97 [0.94, 0.99] 0.86 [0.67, 0.94] CSA Cross-sectional area (CSA), FA fractional anisotropy , ADC apparent dif fusion coef ficient Mean values across all three anatomic locations were omitted for clarity reasons
to Shrout et al. [23], the following ICC categories were used for interpretation: 0.00–0.10=virtually none; 0.11–0.40=
slight; 0.41–0.60=fair; 0.61–0.80=moderate; 0.81–1.00=
substantial agreement. The calculation of 90% CI allowed the interpretation that if the lower bound of the CI is above the lower limit of one of the abovementioned ICC categories, then there is a 95% probability that the population ICC(2,1) is greater than the lower limit of
the respective category [24].
Results
Descriptive data for all three readers for CSA of the median nerve, FA, and ADC including standard deviations (±SD)
for these measures are shown in Table1.
Intra-reader agreement
Overall, the intra-reader agreement (agreement between session 1 and 2) for reader 1 and 2 was fair to substantial for both software packages and for all anatomic locations according to the abovementioned interpretation categories
for ICCs (Table 2). ICCs for CSA measurements were
slightly lower for both readers when compared to FA and ADC measurements, with ICCs from 0.69 to 0.99 for FA and from 0.71 to 0.96 for ADC, respectively. In addition, the 90% CIs were wider for CSA measurements than for FA and ADC. ICCs for reader 2 were generally slightly higher and the 90% CIs narrower when compared to reader 1. Bland-Altman analysis showed minimal individual bias with relatively narrow 95% CI for CSA, FA, and ADC
measurements (Table3). Potentially significant differences
were only found for FuncTool (reader 1: CSA; both readers: ADC). It needs to be noted, however, that the absolute
differences were extremely small (e.g., for ADC, ×10−3).
Inter-reader agreement
The inter-reader agreement (agreement between reader 1 and 2, reader 1 and 3, and reader 2 and 3, respectively) was categorized as slight to substantial with ICCs ranging from 0.20 to 0.90 for FA and 0.27 to 0.82 for
ADC at all anatomic locations (Table4). ICCs for CSA of
the median nerve ranged from 0.22 to 0.90, which also corresponded to a slight to substantial agreement among the three readers. Bland-Altman analysis again showed only minimal individual bias, and the 95% CI did not indicate statistically significant differences among readers
(Table 5). For dtiStudio, however, a significant difference
with a bias of−2.1 [95% CI; −2.99, −1.30] between reader
1 and 2 and−2.1 [95% CI; 1.2, 2.94] between reader 2 and
3 was found when the CSA of the median nerve was measured.
Agreement between two software packages
ICCs for mean CSA were extremely low for all three
readers (−0.04 to 0.31) and indicate that there was virtually
no agreement between both software packages for this
measure (Table6). Detailed analysis of the ICCs for each
individual anatomic location showed that only at two locations could a slight inter-software agreement be noted (readers 1 and 3, pisiform; reader 2, radio-carpal joint) with however very large 90% CIs.
ICCs for mean FA were between 0.63 and 0.80 for all readers. With individual ICCs ranging from 0.52 to
0.85, there was—according to the abovementioned
interpretation categories—a fair to substantial inter-software agreement for FA measurement at all three anatomic locations. ADC data for each anatomic location were not as uniform, and the inter-software agreement was categorized only as slight to substantial for all three
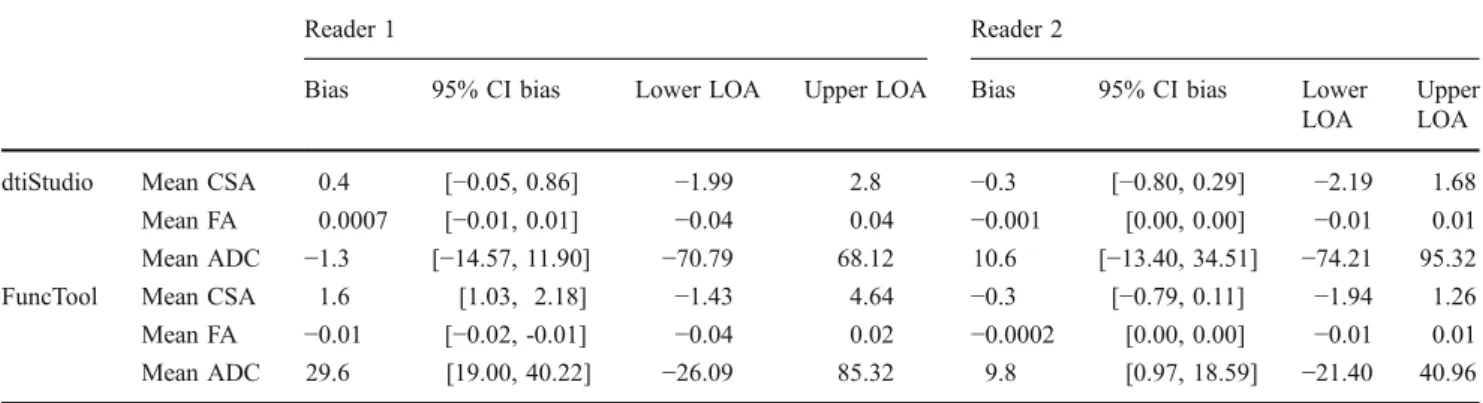
Table 3 Bland-Altman analysis of intra-reader agreement
Reader 1 Reader 2
Bias 95% CI bias Lower LOA Upper LOA Bias 95% CI bias Lower LOA
Upper LOA dtiStudio Mean CSA 0.4 [−0.05, 0.86] −1.99 2.8 −0.3 [−0.80, 0.29] −2.19 1.68
Mean FA 0.0007 [−0.01, 0.01] −0.04 0.04 −0.001 [0.00, 0.00] −0.01 0.01 Mean ADC −1.3 [−14.57, 11.90] −70.79 68.12 10.6 [−13.40, 34.51] −74.21 95.32 FuncTool Mean CSA 1.6 [1.03, 2.18] −1.43 4.64 −0.3 [−0.79, 0.11] −1.94 1.26 Mean FA −0.01 [−0.02, -0.01] −0.04 0.02 −0.0002 [0.00, 0.00] −0.01 0.01 Mean ADC 29.6 [19.00, 40.22] −26.09 85.32 9.8 [0.97, 18.59] −21.40 40.96 CSA Cross-sectional area (CSA), FA fractional anisotropy, ADC apparent diffusion coefficient
The bias (= mean difference of CSA, FA, or ADC), the 95% confidence interval (CI) of the bias, and the lower and upper limits of agreement (LOA) are given. CIs that do not contain the value 0 have a bias that is significantly different from 0 and thus statistically significant
readers. Bland-Altman analysis showed a statistically significant difference between both software packages for the CSA measurements of readers 1 and 2 (residents),
but not for reader 3 (expert) (Table 7).
Discussion
In this DTI study of the median nerve, we have evaluated the intra- and inter-reader agreement as well as the agreement between two commonly used software packages for the assessment of quantitative measures of the nerve such as nerve CSA, FA, and ADC.
The intra-reader agreement was found to be substantial for two repeated measurements that were separated by a minimum of a 6 week period. Our findings are in accordance with a previous DTI study of the median nerve in which quantitative and qualitative measures of the median nerve of a healthy subject were determined by an experienced reader. This reader repeated all measurements, and no statistically significant differences were found
between these measurements [19]. Thus, we consider DTI
measurements of peripheral nerves a robust technique where repeated measurements can be performed. This is important for its application in longitudinal research studies as well as in the follow-up of patients in the clinical routine. The inter-reader agreement for FA and ADC measure-ments in our study was found to be fair to substantial, which might reflect the fact that all readers had dedicated knowledge in quantitative DTI measurements from past research projects, although one of the readers was much more experienced than the other two. We acknowledge that this approach introduces a bias into the study, but it reflects routine research situations where readers of different experience levels perform sophisticated post-procedures of imaging data. Bland-Altman analysis did not show signif-icant differences among the three readers indicating that experience may not have a strong influence on accuracy of FA and ADC measurements. As in many other clinical routine situations, reader-dependent variability in DTI measurements might be reduced by means of standardized training. Despite all standardized training, there remains much room for variability among different readers. First, they have to select identical slices for the measurements. Considering typical through-plane resolutions of 3–4 mm (= slice thickness) of the images, the choice for a specific slice could be different. Second, readers have to draw a free-hand ROI, which is always a reader-dependent process. Last, they have to copy the ROIs to corresponding positions from the FA into the ADC maps, which also introduces a source of variability.
On first sight, our results seem to be contrary to recently published data in the brain where the intra- and inter-reader agreement for DTI measurements was found to be quite low
T able 4 Intra-class correlation coef ficient (ICC) and 90% confidence interval (CI) for inter-reader agreement dtiStudio FuncT ool Radio-carpal joint Pisiform Hamate Radio-carpal joint Pisiform Hamate ICC(2,1) 90% CI ICC(2,1) 90% CI ICC(2,1) 90% CI ICC(2,1) 90% CI ICC(2,1) 90% CI ICC(2,1) 90% CI Reader 1 versus 2 CSA 0.47 [0.18, 0.68] 0.35 [0.01, 0.62] 0.39 [0.08, 0.63] 0.41 [0.12, 0.63] 0.59 [0.35, 0.75] 0.67 [0.43, 0.82] F A 0.54 [0.30, 0.72] 0.83 [0.70, 0.90] 0.63 [0.39, 0.80] 0.68 [0.48, 0.81] 0.78 [0.63, 0.88] 0.58 [0.30, 0.77] ADC 0.42 [0.14, 0.65] 0.69 [0.50, 0.82] 0.78 [0.62, 0.88] 0.50 [0.24, 0.70] 0.82 [0.70, 0.90] 0.71 [0.51, 0.84] Reader 1 versus 3 CSA 0.53 [0.28, 0.72] 0.55 [0.29, 0.73] 0.22 [− 0.10, 0.5] 0.76 [0.60, 0.86] 0.71 [0.44, 0.85] 0.9 [0.82, 0.95] F A 0.65 [0.39, 0.80] 0.76 [0.58, 0.86] 0.33 [0.01, 0.58] 0.90 [0.81, 0.94] 0.88 [0.79, 0.93] 0.20 [− 0.10, 0.48] ADC 0.64 [0.40, 0.79] 0.54 [0.29, 0.72] 0.66 [0.44, 0.81] 0.72 [0.54, 0.84] 0.58 [0.35, 0.75] 0.65 [0.41, 0.80] Reader 2 versus 3 CSA 0.34 [0.05, 0.58] 0.39 [0.00, 0.65] 0.31 [0.01, 0.56] 0.5 [0.23, 0.69] 0.65 [0.43, 0.79] 0.67 [0.45, 0.82] F A 0.45 [0.17, 0.66] 0.76 [0.59, 0.86] 0.29 [− 0.03, 0.56] 0.69 [0.49, 0.82] 0.70 [0.51, 0.83] 0.21 [− 0.14, 0.50] ADC 0.33 [0.05, 0.57] 0.73 [0.50, 0.85] 0.58 [0.33, 0.76] 0.27 [0.03, 0.52] 0.54 [0.28, 0.72] 0.47 [0.17, 0.69] CSA Cross-sectional area (CSA), FA fractional anisotropy , ADC apparent dif fusion coeffi cient
[20]. However, those measurements in the brain showed a remarkable regional variability. It was seen that the inter-reader agreement was lowest for white matter areas with complex and crossing fiber orientations such as the corona radiata and centrum semiovale. Small differences in ROI placement lead to significant differences that were less pronounced in, e.g., the corpus callosum, mesencephalon, and capsula interna, structures with less complex microarchitecture. The median nerve, which is a typical peripheral nerve prototype, consists of multiple longitudinal nerve fascicles, each of which includes multiple longitudinal myelinated axons. Thus, peripheral nerves usually do not have complex or crossing fiber architecture, which therefore eases ROI-based measure-ments. Hence, DTI measurements can also be consid-ered as a robust or reliable technique when performed by different readers, as long as the readers have undergone a standardized training. This aspect is especially important for a potential widespread clinical application of DTI because it means that measurements will be comparable regardless of which individual actually performs them.
In our study, we asked all three readers to perform all measurements twice using different software packages. We decided to use a vendor-specific software (FuncTool) as well as independent freely available software that was
developed at Johns Hopkins University (dtiStudio) [18].
Both software solutions offer similar basic functionality such as DTI and semiautomatic FA and ADC map calculation. Both use similar computational algorithms
[18]. Differences in the software packages include ease
of use, amount of additional functionality, hardware requirements, and costs. An essential difference between both software packages refers to the central process of “ROI drawing.” As mentioned above, dtiStudio’s capa-bility of image magnification is limited to a twofold or fourfold magnification, whereas stepless magnification with additional automatic filtering is available in FuncTool. In our study, we found virtually no agree-ment between the two software packages for nerve CSA measurements. This was most likely caused by the limited capability of dtiStudio in image magnification. As a consequence, ROIs could have been placed not as exactly as would have been possible with stepless image magnification. Only the most experienced among the three readers was able to avoid significantly different CSA measurements. When the more inexperienced readers measured the nerve area using dtiStudio, they had results significantly different from those measured with FuncTool. In contrast to the measurement of the CSA, FA and ADC measurements were less influenced by the limited range of image magnification because ROI boundaries for FA and ADC measurements do not have to follow the nerve border as exactly as is needed for nerve CSA measurement. For the determination of FA and ADC values, it is enough to place an ROI smaller than the nerve CSA within the nerve due to the assumption that FA and ADC of healthy nerves are identical across the whole nerve CSA. Accidental exclusion of some nerve fibers during ROI drawing
Table 5 Bland-Altman analysis of inter-reader agreement
dtiStudio FuncTool
Bias 95% CI bias Lower LOA Upper LOA Bias 95% CI bias Lower LOA Upper LOA Reader 1 versus 2 Mean CSA −2.1 [−2.99, −1.30] −6.59 2.3 0.6 [−0.33, 1.60] −4.43 5.70 Mean FA 0.01 [0.00, 0.03] −0.07 0.09 −0.001 [−0.01, 0.01] −0.06 0.06 Mean ADC 8.3 [−15.68, 32.35] −117.71 134.37 12.0 [−5.19, 29.19] −78.25 102.25 Reader 1 versus 3 Mean CSA −0.07 [−0.88, 0.73] −4.29 4.14 0.8 [0.36, 1.25] −1.54 3.15 Mean FA 0.01 [0.00, 0.02] −0.05 0.07 −0.007 [−0.01, 0.00] −0.05 0.03 Mean ADC −28.2 [−49.47, 6.98] −139.74 83.3 −11.6 [−30.27, 7.05] −109.57 86.35 Reader 2 versus 3 Mean CSA −2.1 [1.2, 2.94] −2.5 6.64 0.2 [−0.72, 1.07] −4.53 4.88 Mean FA −0.001 [−0.02, 0.01] −0.08 0.08 −0.006 [−0.02, 0.01] −0.08 0.06 Mean ADC −36.6 [−62.69, −10.42] −173.73 100.62 −23.6 [−46.74, −0.48] −145.02 97.80 CSA Cross-sectional area (CSA), FA fractional anisotropy, ADC apparent diffusion coefficient
Data from the first and second post-processing session were pooled for readers 1 and 2. The bias (= mean difference of CSA, FA, or ADC), the 95% confidence interval (CI) of the bias, and the lower and upper limits of agreement (LOA) are given. CIs that do not contain the value 0 have a bias that is significantly different from 0
T able 6 Intraclass correlation coef ficient (ICC) and 90% confidence interval (CI) for the agreement between two software packages (dtiStudio versus FuncT ool) Reader 1 Reader 2 Reader 3 Radio-carpal joint Pisiform Hamate Radio-carpal joint Pisiform Hamate Radio-carpal joint Pisiform Hamate ICC (2,1) 90% CI ICC (2,1) 90% CI ICC (2,1) 90% CI ICC (2,1) 90% CI ICC(2,1) 90% CI ICC(2,1) 90% CI ICC(2,1) 90% CI ICC(2,1) 90% CI ICC (2,1) 90% CI CSA 0.10 [− 0.14, 0.36] 0.14 [− 0.18, 0.43] 0.04 [− 0.19, 0.32] 0.20 [− 0.12, 0.47] 0.06 [− 0.25, 0.18] 0.01 [− 0.24, 0.41] − 0.04 [− 0.27, 0.23] 0.31 [0.02, 0.55] 0.15 [− 0.17, 0.44] F A 0.52 [0.25, 0.71] 0.66 [0.45, 0.80] 0.52 [0.24, 0.72] 0.62 [0.40, 0.78] 0.83 [0.70, 0.90] 0.59 [0.32, 0.77] 0.65 [0.42, 0.79] 0.85 [0.74, 0.92] 0.67 [0.44, 0.82] ADC 0.12 [− 0.18, 0.4] 0.70 [0.51, 0.82] 0.67 [0.44, 0.82] 0.38 [0.09, 0.61] 0.80 [0.64, 0.89] 0.81 [0.66, 0.90] 0.50 0.23, 0.70] 0.81 [0.66, 0.89] 0.63 [0.39, 0.79 ] CSA Cross-sectional area (CSA), FA fractional anisotropy , ADC apparent dif fusion coeffi cient T able 7 Bland-Altman analysis for the agreement between two software packages (dtiStudio versus FuncT ool) Reader 1 Reader 2 Reader 3 Bias 95% CI bias Lower LOA Upper LOA Bias 95% CI bias Lower LOA Upper LOA Bias 95% CI bias Lower LOA Upper LOA Mean CSA − 1.2 [− 2.42, − 0.03] − 7.51 5.05 1.5 [0.12, 2.98] − 5.96 9.06 − 0.3 [− 1.47, 0.78] − 6.25 5.56 Mean F A 0.02 [0.00, 0.03] − 0.06 0.09 0.006 [− 0.01, 0.02] − 0.07 0.08 0.001 [− 0.01, 0.01] − 0.05 0.05 Mean ADC − 22.5 [− 46.84, 1.84] − 150.26 105.26 − 18.8 [− 37.05, − 0.62] − 1 14.44 76.77 − 5.9 [− 27.17, 15.39] − 1 17.6 105.82 CSA Cross-sectional area (CSA), FA fractional anisotropy , ADC apparent dif fusion coef ficient Data from the first and second post-processing session were pooled for both readers. The bias (= mean dif ference of CSA, F A, or ADC), the 95% confidence interval (CI) of the bias, and the lower and upper limits of agreement (LOA) are given. CIs that do not contain the value 0 have a bias that is significantly dif ferent from 0
might not alter the mean FA or ADC value. To overcome the limited capability of dtiStudio with regard to ROI drawing, dedicated ROI drawing software (ROIEditor, Johns Hopkins University, Baltimore, MD, USA) was developed by the same group that developed dtiStudio. The latter software has many more capabili-ties such as use of threshold FA or ADC values to define boundaries of an ROI, and the use of this software is therefore strongly recommended for all advanced ROI drawing applications, especially for more inexperienced readers.
Our study has some limitations. First, only two commonly used software packages were evaluated, although more are available. However, most software was originally developed and optimized for the vendor-specific MR scanners. At the time of the study, DTI data sets acquired on MR scanners of one vendor were not correctly recognized by evaluation software pack-ages from other manufacturers, without, e.g., manipu-lation of their DICOM header information. Second, our study was only based on quantitative measures of DTI data. We did not perform fiber tracking nor evaluate the intra- or inter-reader agreement in an assessment of software-generated fibers, e.g., their length or spatial density. Due to differences in the underlying computa-tional fiber-tracking algorithms and based on our own experience from previous studies, we would however expect significant software-specific differences. Third, our data are based on young healthy volunteers. No data from pathologic nerves were included. This may introduce a bias. However, since the variability of FA and ADC within pathologic nerves is not known so far, data from asymptomatic volunteers were the only reliable way to perform our study. Fourth, there is no reference standard for our FA and ADC measurements as diffusion values can only be gained from MR imaging. This however is a general and inherent problem of DTI research (e.g., in the brain). Last, knowledge about pathologic FA and ADC values with regard to certain pathology (e.g., carpal tunnel syndrome or inflammatory disease) is also very limited in the
literature [25–30]. As a consequence, we could not
precisely determine what amount of variability among
readers or software packages could be defined as
“accept-able.” Larger patient versus control group studies are needed and are expected to be published soon. For now, our observed intra- and inter-reader variability as well as the variability between the two software packages seems to be considerably smaller than FA differences between
healthy controls and patients [25,29,30].
In conclusion, the intra-, inter-reader agreement, and agreement between software packages for measurements of FA and ADC of the median nerve were moderate to
substantial suggesting that post-processing and user-dependent factors contribute little to the variance in DTI measurements.
References
1. Jambawalikar S, Baum J, Button T, Li H, Geronimo V, Gould ES. Diffusion tensor imaging of peripheral nerves. Skeletal Radiol. 39 (11):1073–79.
2. Bammer R, Acar B, Moseley ME. In vivo MR tractography using diffusion imaging. Eur J Radiol. 2003;45(3):223–34.
3. Bammer R. Basic principles of diffusion-weighted imaging. Eur J Radiol. 2003;45(3):169–84.
4. Le Bihan D, Mangin JF, Poupon C, Clark CA, Pappata S, Molko N, et al. Diffusion tensor imaging: concepts and applications. J Magn Reson Imaging. 2001;13(4):534–46.
5. Masutani Y, Aoki S, Abe O, Hayashi N, Otomo K. MR diffusion tensor imaging: recent advance and new techniques for diffusion tensor visualization. Eur J Radiol. 2003;46(1):53–66.
6. Skorpil M, Karlsson M, Nordell A. Peripheral nerve diffusion tensor imaging. Magn Reson Imaging. 2004;22(5):743–5. 7. Khalil C, Budzik JF, Kermarrec E, Balbi V, Le Thuc V, Cotten A.
Tractography of peripheral nerves and skeletal muscles. Eur J Radiol. 2010;76(3):391–7.
8. Skorpil M, Engstrom M, Nordell A. Diffusion-direction-dependent imaging: a novel MRI approach for peripheral nerve imaging. Magn Reson Imaging. 2007;25(3):406–11.
9. Vargas MI, Viallon M, Nguyen D, Delavelle J, Becker M. Diffusion tensor imaging (DTI) and t tractography of the brachial plexus: feasibility and initial experience in neoplastic conditions. Neuroradiology. 2010;52(3):237–45.
10. Wheeler-Kingshott CA, Trip SA, Symms MR, Parker GJ, Barker GJ, Miller DH. In vivo diffusion tensor imaging of the human optic nerve: pilot study in normal controls. Magn Reson Med. 2006;56(2):446–51.
11. Skorpil M, Rolheiser T, Robertson H, Sundin A, Svenningsson P. Diffusion tensor fiber tractography of the olfactory tract. Magn Reson Imaging. 2011;29(2):289–92.
12. Andreisek G, White LM, Kassner A, Tomlinson G, Sussman MS. Diffusion tensor imaging and fiber tractography of the median nerve at 1.5 T: optimization of b value. Skeletal Radiol. 2009;38(1):51–9. 13. Kabakci N, Gurses B, Firat Z, Bayram A, Ulug AM, Kovanlikaya A, et al. Diffusion tensor imaging and tractography of median nerve: normative diffusion values. AJR Am J Roentgenol. 2007;189(4):923–7.
14. Kabakci NT, Kovanlikaya A, Kovanlikaya I. Tractography of the median nerve. Semin Musculoskelet Radiol. 2009;13(1):18–23. 15. Khalil C, Hancart C, Le Thuc V, Chantelot C, Chechin D, Cotten
A. Diffusion tensor imaging and tractography of the median nerve in carpal tunnel syndrome: preliminary results. Eur Radiol. 2008;18(10):2283–91.
16. Lehmann HC, Zhang J, Mori S, Sheikh KA. Diffusion tensor imaging to assess axonal regeneration in peripheral nerves. Exp Neurol. 2010;223(1):238–44.
17. Yao L, Gai N. Median nerve cross-sectional area and MRI diffusion characteristics: normative values at the carpal tunnel. Skeletal Radiol. 2009;38(4):355–61.
18. Jiang H, van Zijl PC, Kim J, Pearlson GD, Mori S. DtiStudio: resource program for diffusion tensor computation and fiber bundle tracking. Comput Methods Programs Biomed. 2006;81 (2):106–16.
19. Andreisek G, White LM, Kassner A, Sussman MS. Evaluation of diffusion tensor imaging and fiber tractography of the median
nerve: preliminary results on intrasubject variability and precision of measurements. AJR Am J Roentgenol. 2010;194(1):W65–72. 20. Brander A, Kataja A, Saastamoinen A, Ryymin P, Huhtala H,
Ohman J, et al. Diffusion tensor imaging of the brain in a healthy adult population: Normative values and measurement reproduc-ibility at 3 T and 1.5 T. Acta Radiol. 2010;51(7):800–807. 21. McGraw KO, Wong SP. Forming inferences about some intraclass
correlation coefficients. Psychol Meth. 1996;1(1):30–46. 22. Bland JM, Altman DG. Statistical methods for assessing
agree-ment between two methods of clinical measureagree-ment. Lancet. 1986;1(8476):307–10.
23. Shrout PE, Fleiss JL. Intraclass correlations: uses in assessing rater reliability. Psychol Bull. 1979;86(2):420–8.
24. Shrout PE. Measurement reliability and agreement in psychiatry. Stat Methods Med Res. 1998;7(3):301–17.
25. Khalil C, Hancart C, Le Thuc V, Chantelot C, Chechin D, Cotten A. Diffusion tensor imaging and tractography of the median nerve in carpal tunnel syndrome: preliminary results. Eur Radiol. 2008;18(10):2283–91.
26. Khalil C, Budzik JF, Kermarrec E, Balbi V, Le Thuc V, Cotten A. Tractography of peripheral nerves and skeletal muscles. Eur J Radiol. 2010;76(3):391–7.
27. Lehmann HC, Zhang J, Mori S, Sheikh KA. Diffusion tensor imaging to assess axonal regeneration in peripheral nerves. Exp Neurol. 2010;223(1):238–44.
28. Meek MF, Stenekes MW, Hoogduin HM, Nicolai JP. In vivo three-dimensional reconstruction of human median nerves by diffusion tensor imaging. Exp Neurol. 2006;198 (2):479–82.
29. Kakuda T, Fukuda H, Tanitame K, Takasu M, Date S, Ochi K, et al. Diffusion tensor imaging of peripheral nerve in patients with chronic inflammatory demyelinating polyradiculoneuropathy: a feasibility study. Neuroradiology. 2011. doi: 10.1007/s00234-010-0833-z.
30. Stein D, Neufeld A, Pasternak O, Graif M, Patish H, Schwimmer E, et al. Diffusion tensor imaging of the median nerve in healthy and carpal tunnel syndrome subjects. J Magn Reson Imag. 2009;29(3):657–62.