. . . .
A clinical prediction rule for the diagnosis
of coronary artery disease: validation,
updating, and extension
Tessa S.S. Genders
1,2, Ewout W. Steyerberg
3, Hatem Alkadhi
4, Sebastian Leschka
4,
Lotus Desbiolles
4, Koen Nieman
2,5, Tjebbe W. Galema
5, W. Bob Meijboom
2,5,
Nico R. Mollet
2,5, Pim J. de Feyter
2,5, Filippo Cademartiri
2,6, Erica Maffei
6,
Marc Dewey
7, Elke Zimmermann
7, Michael Laule
8, Francesca Pugliese
9,10,
Rossella Barbagallo
9, Valentin Sinitsyn
11, Jan Bogaert
12, Kaatje Goetschalckx
13,
U. Joseph Schoepf
14, Garrett W. Rowe
14, Joanne D. Schuijf
15, Jeroen J. Bax
15,
Fleur R. de Graaf
15, Juhani Knuuti
16, Sami Kajander
16, Carlos A.G. van Mieghem
17,
Matthijs F.L. Meijs
18,19, Maarten J. Cramer
18, Deepa Gopalan
20, Gudrun Feuchtner
21,
Guy Friedrich
22, Gabriel P. Krestin
2, and M.G. Myriam Hunink
1,2,23*
,
The CAD Consortium
1Department of Epidemiology, Erasmus University Medical Center, PO Box 2040, 3000 CA, Rotterdam, The Netherlands;2
Department of Radiology, Erasmus University Medical
Center, PO Box 2040, 3000 CA, Rotterdam, The Netherlands;3
Department of Public Health, Erasmus University Medical Center, Rotterdam, The Netherlands;4
Institute of
Diagnostic Radiology, University Hospital Zurich, Switzerland;5
Department of Cardiology, Erasmus University Medical Center, Rotterdam, The Netherlands;6
Department of
Radiology, Azienda Ospedaliero-Universitaria, Parma, Italy;7
Department of Radiology, Charite´, Medical School, Humboldt University, Berlin, Germany;8
Department of Cardiology,
Charite´, Medical School, Humboldt University, Berlin, Germany;9
The Essex Cardiothoracic Centre, Basildon University Hospital, Essex, UK;10
Centre for Advanced Cardiovascular Imaging, Barts and The London NIHR Biomedical Research Unit, William Harvey Research Institute, Queen Mary University of London, The London Chest Hospital, London, UK; 11
Department of Radiology, Federal Center of Medicine and Rehabilitation, Moscow, Russia;12
Department of Radiology, University Hospital Leuven, Belgium;13
Department of
Cardiology, University Hospital Leuven, Belgium;14
Department of Radiology, Medical University of South Carolina, Charleston, SC, USA;15
Department of Cardiology, Leiden
University Medical Center, Leiden, The Netherlands;16
Turku PET Centre, Turku University Hospital, Turku, Finland;17
Department of Cardiology, Maasstad Hospital, Rotterdam,
The Netherlands;18
Department of Cardiology, University Medical Center Utrecht, Utrecht, The Netherlands;19
Department of Radiology, University Medical Center Utrecht,
Utrecht, The Netherlands;20
Department of Radiology, Papworth Hospital NHS Trust, Cambridge, UK;21
Department of Radiology, Innsbruck Medical University, Austria; 22
Department of Cardiology, Innsbruck Medical University, Austria; and23
Department of Health Policy and Management, Harvard School of Public Health, Harvard University, Boston, MA, USA
Received 18 June 2010; revised 8 December 2010; accepted 19 January 2011; online publish-ahead-of-print 2 March 2011
See page 1311 for the editorial comment on this article (doi:10.1093/eurheartj/ehr015)
Aims The aim was to validate, update, and extend the Diamond – Forrester model for estimating the probability of obstruc-tive coronary artery disease (CAD) in a contemporary cohort.
Methods and results
Prospectively collected data from 14 hospitals on patients with chest pain without a history of CAD and referred for conventional coronary angiography (CCA) were used. Primary outcome was obstructive CAD, defined as≥50% ste-nosis in one or more vessels on CCA. The validity of the Diamond – Forrester model was assessed using calibration plots, calibration-in-the-large, and recalibration in logistic regression. The model was subsequently updated and extended by revising the predictive value of age, sex, and type of chest pain. Diagnostic performance was assessed by calculating the area under the receiver operating characteristic curve (c-statistic) and reclassification was deter-mined. We included 2260 patients, of whom 1319 had obstructive CAD on CCA. Validation demonstrated an over-estimation of the CAD probability, especially in women. The updated and extended models demonstrated a c-statistic of 0.79 (95% CI 0.77 – 0.81) and 0.82 (95% CI 0.80 – 0.84), respectively. Sixteen per cent of men and 64% of women were correctly reclassified. The predicted probability of obstructive CAD ranged from 10% for 50-year-old females
*Corresponding author. Tel:+31 10 7043489, Fax: +31 10 7044657, Email:m.hunink@erasmusmc.nl
. . . . with non-specific chest pain to 91% for 80-year-old males with typical chest pain. Predictions varied across hospitals due to differences in disease prevalence.
Conclusion Our results suggest that the Diamond – Forrester model overestimates the probability of CAD especially in women.
We updated the predictive effects of age, sex, type of chest pain, and hospital setting which improved model per-formance and we extended it to include patients of 70 years and older.
-Keywords Coronary artery disease † Stable chest pain † Angina pectoris † Pre-test probability † Prediction model †
Validation
Introduction
In patients presenting with chest pain suggestive of stable angina pectoris, numerous diagnostic strategies can be used. The refer-ence standard for diagnosing coronary artery disease (CAD) is conventional coronary angiography (CCA). However, CCA is expensive and involves a small risk of complications and death.1 Therefore, non-invasive testing is recommended to select patients who will benefit from CCA.2–4The clinical value of non-invasive diagnostic tests depends on the test sensitivity, the specificity, the potential gain from making the correct diagnosis, the potential harm caused by false-positive test results, and the pre-test (prior) probability of the suspected disease.5–7In choosing the appropri-ate test for a particular patient with chest pain suggestive of CAD, the pre-test probability of CAD is crucial.7
Diamond and Forrester8demonstrated the importance of the pre-test probability on interpreting test results in their classic paper in 1979. Using estimates from autopsy and cross-sectional studies, they developed a simple but elegant model that considers age, sex, and type of chest pain to estimate the probability of obstructive CAD in patients between 30 and 70 years old. In spite of its limitations, the Diamond – Forrester model is still used in current guidelines.2–4Although other cardiovascular risk factors such as diabetes, smoking and dyslipidaemia have been included in, e.g. the Duke Clinical Score,9,10the predictive effects of other risk factors in diagnostic models are often small compared with the predictive effects of age, sex, and type of chest pain. Fur-thermore, complicated models are less likely to be used by phys-icians in clinical practice especially since non-invasive diagnostic tests are commonly ordered immediately at the first visit. The Diamond – Forrester model allows the immediate calculation of an estimate of the patients’ pre-test risk of CAD, without the need to wait for laboratory findings or exercise test results.
Since the Diamond – Forrester model was developed .30 years ago and based on data from the USA only, our aims were to study the validity of the Diamond – Forrester predictions in estimating the probability of obstructive CAD, to update the predictions using recently collected data, and to extend the model for patients beyond the age of 70, using data from contemporary cohorts.
Methods
The CAD Consortium
The CAD Consortium is part of the European network for the Assess-ment of Imaging in Medicine (EuroAIM), which is an initiative of the
European Institute of Biomedical Imaging Research (EIBIR).11 The
main goal of EuroAIM is to perform pooled analyses of existing pro-spectively collected data, which will improve power of the studies and increase generalizability of the results obtained.
Data collection
A consortium of researchers from various countries in Europe and the USA was formed. An existing database with prospectively collected data on 80 or more eligible patients was required for participation in this consortium. All patients included in this consortium had to be enrolled in single-centre studies, for which local approval from the Insti-tutional Review Board and signed informed consent had been obtained. Participation in the consortium did not involve any financial incentives.
Patient population
Our patient population consists of patients with chest pain, suggestive of stable angina pectoris. Patients were eligible for the analysis if they presented with stable chest pain (typical, atypical, or non-specific chest pain) and if CCA was performed. Patients were excluded if they met one of the following criteria: (i) acute coronary syndrome or unstable chest pain, (ii) history of myocardial infarction or previous revascular-ization (percutaneous coronary intervention or coronary artery bypass graft surgery), and (iii) no informed consent.
Only patients who underwent CCA were eligible for this analysis, implying that our population was highly selected. To explore the effect of selection bias (i.e. verification bias) in this study population, we performed a separate analysis using inverse probability weighting on each patient in the data set. Based on an independent registry data set (not included in our consortium) consisting of unselected out-patients presenting to the cardiologist who were intended to undergo both stress-ECG and coronary CT angiography (CCTA) for the evalu-ation of chest pain,12,13a logistic regression analysis was performed to calculate the probability of undergoing CCA (i.e. the probability of ver-ifying the presence of CAD with CCA) depending on age, sex, and type of chest pain. Each patient was subsequently weighted with the inverse of the probability of verification which corrects for verification bias (Appendix, Correction for verification bias).14,15
Clinical definitions
Data on age, sex, type of chest pain, and the presence of CAD were collected. Type of chest pain was classified as being typical, atypical, or non-specific. Typical chest pain was defined as having (i) substernal chest pain or discomfort, that is (ii) provoked by exertion or emotional stress and (iii) relieved by rest and/or nitroglycerine. Atypical chest pain was defined as having two of the before-mentioned criteria. If one or none of the criteria was present, the patient was classified as having non-specific chest pain.4,16
The presence of obstructive CAD was defined as one or more vessels with ≥50% lumen diameter reduction on CCA. As we used
existing databases, CCA was performed at each institution according to local protocols; both visual assessment and quantitative assessment were allowed for interpretation of the CCA. Indicator variables for hospital were used to allow adjustment for hospital.
Data analysis
Validation and updating of the Diamond–Forrester model was per-formed using state-of-the-art methods,17–19 by one of the authors (T.S.S.G.). See Appendix for a more detailed description of the methods. Validation
The Diamond – Forrester model takes into account age, sex, and type of chest pain and was developed for patients between 30 and 70 years. For validation, we therefore excluded both patients below the age of 30 and patients above the age of 69.
The observed frequency of CAD in our data set was calculated stra-tifying for 10-year age category, sex, and type of chest pain (i.e. equiv-alent to the Diamond – Forrester categories). Observed frequencies of CAD were compared with the estimates according to Diamond and Forrester and subsequently tabulated and presented by means of calibration plots.
Calibration-in-the-large
When assessing the validity of a prediction model, the first step is to check whether the average prediction is equal or close to the average observed outcome. This concept is referred to as ‘calibration-in-the-large’. Hereto, we compared the mean observed frequency of CAD with the mean prediction according to Diamond and Forrester.
Recalibration
The second step is to test whether the overall effect of the predictors in the Diamond – Forrester model is valid for the consortium data. Re-estimation
The third step is to re-estimate the predictor effects in the consortium data and to compare the effects with the original effects according to Diamond and Forrester. Subsequently, we calculated the difference between the re-estimated and the original effects (Appendix, Table A1). Updating and extension
For updating the Diamond – Forrester model, we used all data including patients ,30 and .69 years. Age, sex, and type of chest pain were entered simultaneously in a logistic regression model. All analyses were performed both unadjusted and adjusted for hospital.
Separately, we extended the model with a random intercept to allow for heterogeneity in CAD prevalence across different hospitals (Appendix, Table A3). Because of potential differences in symptom classification across hospitals, we also tested random effects for type of chest pain between different hospitals.
Diagnostic performance was quantified by calculating the area under the receiver operating curve (c-statistic). Calibration was assessed using the Hosmer – Lemeshow goodness-of-fit test and a calibration plot (Appendix, Figure A2).
Reclassification was assessed by cross-tabulating the probability classi-fication of patients according to the Diamond–Forrester model vs. the updated model. We analysed reclassification with the commonly used cutoffs of 30 and 70% (Appendix, Table A4, A6).20In a second reclassifi-cation analysis, we analysed the cutoff 40% (Appendix, Table A5, A7), which is the threshold below which CCTA is cost-effective.7 Further-more, we determined the reclassification calibration statistic and the net reclassification improvement (Appendix, Table A8).21,22
Validation of the updated model
As mentioned, the CAD Consortium population is highly selected based on referral to CCA. To assess the performance of the updated model in a low-risk population, we validated the updated model in an independent data set (not included in our consortium) consisting of outpatients presenting to the cardiologist who were intended to undergo both stress-ECG and CCTA for the evaluation of chest pain.12,13These data were also used to perform the ‘correc-tion for verifica‘correc-tion bias’. We followed the step-wise approach as described above. Since not all patients in this population underwent CCA, the CCTA results were used as a proxy for the reference stan-dard in patients who did not undergo CCA.
A P-value ,0.05 was considered statistically significant. Statistical analyses were performed using Stata/SE 10.1 (StataCorp, TX, USA). Reclassification was assessed by using syntax made available by Cook et al.22in SAS Enterprise Guide v3 (SAS, Inc., NC, USA).
Results
Data collection and study population
Existing databases with prospectively collected data were retrieved from 14 hospitals (Table1). After excluding 12 cases because of missing values, the total study population consisted of 2260 patients [1521 men, 739 women, mean age 62 (range 21 – 93, IQR 55 – 70)], of whom 1319 (58.4%) were found to have obstructive CAD on CCA.
For validation, we excluded patients below the age of 30 (n ¼ 7) and above the age of 69 (n ¼ 570). Therefore, 1683 patients [1159 (68.9%) men, 524 women] and 937 (55.7%) with obstructive CAD were left for validation.
Data analysis
Validation
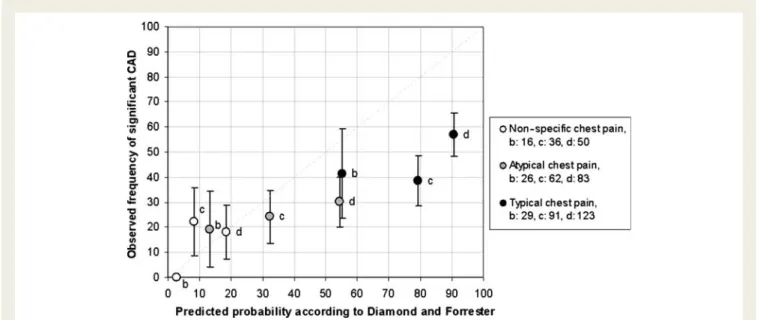
Table2and Figures1and2show the average observed frequency of CAD in men and women, respectively, as observed in our data set, compared with the prediction according to Diamond and For-rester. In men, we observed a slight overestimation of the prob-ability of CAD by Diamond and Forrester for patients with atypical and typical chest pain. In women, the overestimation was more pronounced. The validation of predictions for men ,40 and women ,50 years old was less reliable, due to the limited number of patients in these subgroups.
Calibration-in-the-large
We found that the average predicted probability according to Diamond and Forrester was higher compared with the CAD frequency in the consortium data (P , 0.001).
Recalibration
Recalibration demonstrated that the overall effect of the predic-tors in the Diamond – Forrester model was higher compared with the overall effect of the predictors in the consortium data (P , 0.001).
Re-estimation
The effects of age (P , 0.001) and type of chest pain (P , 0.001) were significantly larger in the Diamond – Forrester model,
. . . .
. . . .
. . . .
Table 1 Patient characteristics, ordered according to the prevalence of coronary artery disease
Hospital, country Medical University of South Carolina, Charleston, USA Turku University Hospital, Finland Innsbru¨ck Medical University, Austria Maasstad Ziekenhuis, Rotterdam, The Netherlands Leiden University Medical Center, The Netherlands Erasmus University Medical Center, The Netherlands Charite´ Medical School, Berlin, Germany University Medical Center Utrecht, The Netherlands Papworth Hospital NHS Foundation Trust, Cambridge, UK n 99 98 101 90 99 289 186 85 83 Mean age (SD) 60.3 (10.4) 64.4 (6.8) 61.2 (8.6) 59.0 (9.9) 62.1 (10.9) 59.4 (10.6) 62.7 (9.4) 60.5 (5.4) 65.5 (10.8) Male sex (%) 49.5 58.2 58.4 58.9 56.6 68.5 71.0 67.1 65.1 Typical CP (%) 76.8 50.0 21.8 10.0 62.6 50.2 57.0 55.3 41.0 Atypical CP (%) 20.2 42.9 78.2 27.8 35.4 26.0 29.0 18.8 36.1 Non-specific CP (%) 3.0 7.1 0 62.2 2.0 23.9 14.0 25.9 22.9 CAD on CCA (%) 39.4 42.9 45.5 50.0 51.5 52.2 54.8 57.6 59.0
Hospital, country University Hospital Parma, Italy The Essex Cardiothoracic Centre, UK University Hospital Leuven, Belgium University Hospital Zurich, Switzerland
Federal Center for Medicine and Rehabilitation, Moscow, Russia
Total (CAD1)
Total (CAD2) Total
n 277 110 100 549 106 1325 947 2272 Mean age (SD) 59.9 (11.4) 63.2 (9.5) 64.0 (10.7) 65.6 (10.9) 59.7 (8.4) 63.8 60.3 (10.9) 62.3 (10.4) Male sex (%) 67.9 68.2 59.0 74.5 76.4 78.0 52.2 67.2 Typical CP (%) 65.0 52.7 58.0 53.4 56.6 69.3 30.2 53.0 Atypical CP (%) 35.0 24.5 28.0 10.9 24.5 19.1 37.3 26.7 Non-specific CP (%) 0 22.7 14.0 35.7 18.9 11.6 32.5 20.3 CAD on CCA (%) 60.0 61.8 63.0 68.1 75.5 100 0 58.3
SD, standard deviation; CP, chest pain; CAD, coronary artery disease; CCA, conventional coronary angiography.
Clinical pred iction rule for the diagnosis of CAD
1319
. . . .
. . . .
. . . .
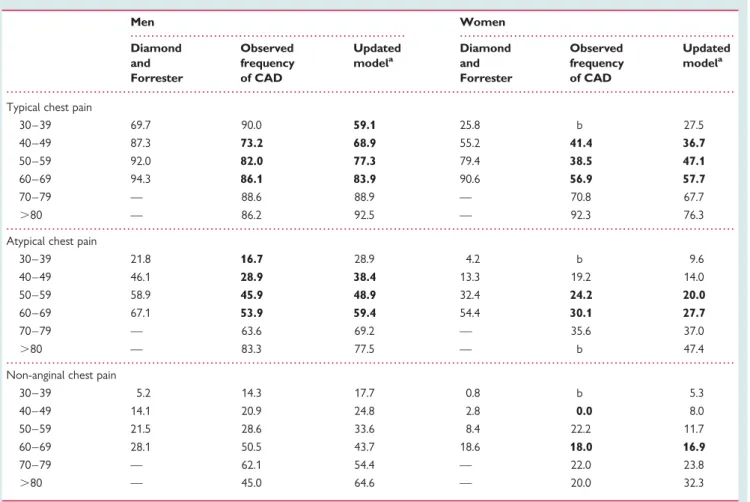
. . . . Table 2 Head-to-head comparison of the pre-test probability according to Diamond and Forrester
Men Women Diamond and Forrester Observed frequency of CAD Updated modela Diamond and Forrester Observed frequency of CAD Updated modela
Typical chest pain
30 – 39 69.7 90.0 59.1 25.8 b 27.5 40 – 49 87.3 73.2 68.9 55.2 41.4 36.7 50 – 59 92.0 82.0 77.3 79.4 38.5 47.1 60 – 69 94.3 86.1 83.9 90.6 56.9 57.7 70 – 79 — 88.6 88.9 — 70.8 67.7 .80 — 86.2 92.5 — 92.3 76.3
Atypical chest pain
30 – 39 21.8 16.7 28.9 4.2 b 9.6 40 – 49 46.1 28.9 38.4 13.3 19.2 14.0 50 – 59 58.9 45.9 48.9 32.4 24.2 20.0 60 – 69 67.1 53.9 59.4 54.4 30.1 27.7 70 – 79 — 63.6 69.2 — 35.6 37.0 .80 — 83.3 77.5 — b 47.4
Non-anginal chest pain
30 – 39 5.2 14.3 17.7 0.8 b 5.3 40 – 49 14.1 20.9 24.8 2.8 0.0 8.0 50 – 59 21.5 28.6 33.6 8.4 22.2 11.7 60 – 69 28.1 50.5 43.7 18.6 18.0 16.9 70 – 79 — 62.1 54.4 — 22.0 23.8 .80 — 45.0 64.6 — 20.0 32.3
The observed frequency of CAD in the CAD consortium data and the prediction according to the updated model. Subgroup estimates that are overestimated by the Diamond – Forrester model are printed in boldface.
a
Probabilities shown reflect the estimates for patients aged 35, 45, 55, 65, 75, and 85 years. b
Data on subgroups with less than five observations are not shown.
Figure 1 Predicted probability of obstructive coronary artery disease in men (triangles) for the Diamond – Forrester age categories a: 30 – 39, b: 40 – 49, c: 50 – 59, and d: 60 – 69, vs. the observed frequency of obstructive coronary artery disease in our data. The legend provides the number of patients per age category for each type of chest pain. The bars indicate the 95% confidence interval of the observed frequency.
compared with the effects in the consortium data. We conclude that these predictors require updating.
Updating and extension
The updated model (Table3) showed highly significant effects for age, sex, and type of chest pain, with similar effect sizes after adjustment for hospital (not shown). The area under the receiver operating characteristic curve demonstrated good performance (c-statistic: 0.79, 95 CI: 0.77 – 0.81). After correction for verification bias, the regression coefficients were similar (Appendix, Table A3). Interactions between the main effects did not show statistical significance (not shown). We found significant interactions between ‘typical chest pain’ and hospital (not shown), implying that the effect of having typical chest pain on the predicted prob-ability is different across hospitals.
Finally, a random effects logistic regression model showed that there was substantial heterogeneity in disease prevalence across hospitals. The model could not be improved by adding a random effect for atypical chest pain, whereas a random effect for typical chest pain showed statistical significance (Appendix, Table A3). The random effects model is available for online use (Figure 3). The test for a non-linear age effect was not statistically significant, which is why we assumed a linear effect for age in all models.
Analysis of reclassification in 30 – 69-year-old patients demon-strated that 16% of men and 64% of women reclassified cor-rectly, when using the probability categories ,30, ≥30–70, and ≥70% (Figures4 and5). The net reclassification index was negative for both men and women, which is explained by the fact that the updated model predicts less high probabilities com-pared with Diamond and Forrester, resulting in down-classification of patients among both cases and non-cases (Appendix, Table A8).
Validation of the updated model Calibration-in-the-large
The average predicted probability according to our updated model was significantly higher compared with the CAD frequency in the independent data set (P , 0.001).
Recalibration
Recalibration demonstrated that the overall effect of the predic-tors in the updated model is similar to the overall effect of the pre-dictors in the independent registry of outpatients (P ¼ 0.79). From
. . . .
. . . .
Table 3 Updating and extension of the Diamond –
Forrester model (random effects model)
Coefficient Odds ratio 95 % CI lower limit 95 % CI upper limit Age 0.04 1.04 1.03 1.05 Male sex 1.34 3.82 3.08 4.74 Typical chest pain 1.91 6.72 3.97 11.37 Atypical chest pain 0.64 1.89 1.38 2.59 Non-specific chest paina — — Intercept 24.37 — c-Statistic (95% CIb) 0.82 0.80 0.84 a Reference category. b
Estimated by bootstrapping with 1000 repetitions.
Figure 2 Predicted probability of obstructive coronary artery disease in women (circles) for the Diamond – Forrester age categories a: 30 – 39, b: 40 – 49, c: 50 – 59, and d: 60 – 69, vs. the observed frequency of obstructive coronary artery disease in our data. The legend provides the number of patients per age category for each type of chest pain. Data on subgroups with less than five observations are not shown. The bars indicate the 95% confidence interval of the observed frequency.
this, we conclude that the predictor effects are valid and do not require updating (Appendix, Table A9).
The model, adjusted for the lower disease prevalence, is avail-able for online use (Figure3).
Discussion
Using recently collected data and modern statistical methods, we assessed whether the Diamond – Forrester model is valid in a con-temporary mainly European cohort (Box 1). Furthermore, we updated and extended the model by re-estimating the predictive effects of age, sex, and type of chest pain. We observed that the prevalence of CAD was different across hospitals and adjusted for this difference.
Box 1 Study strengths and weaknesses
Strengths
† A large contemporary cohort was studied. † Multicentre collaboration of 14 hospitals.
† Modern statistical methods were used for validation, updating, and extension of the Diamond – Forrester model.
† In contrast to the Diamond –Forrester model, the updated model uses age as a continuous predictor and also predicts probabilities for patients 70 years and older. † An easy-to-use online probability calculator was
developed. Weaknesses
† Only age, sex, and type of chest pain were considered predictors.
† The primary outcome was limited to obstructive CAD vs. no obstructive CAD.
† Existing databases designed for other research objectives were combined.
† A high-risk population was selected by including only patients referred for coronary angiography.
† Heterogeneity across hospitals with respect to the assess-ment of chest pain, adherence to guidelines, and interpretation of the coronary angiographies.
In short, we validated the Diamond – Forrester predictions in patients between 30 and 70 years old. By comparing the Diamond – Forrester predicted probabilities with the average observed frequencies of obstructive CAD in our data using cali-bration plots, we demonstrated that there is a tendency for the Diamond – Forrester model to overestimate the prevalence of CAD in a contemporary cohort. We showed that the Diamond – Forrester model needs to be updated according to the overall disease prevalence for the current European situation. Furthermore, we demonstrated that the predictor effects in the consortium data are not as extreme as the model by Diamond and Forrester suggests.
It is important to note that the Diamond – Forrester model is based on 30 – 40-year-old data from the USA. To some extent,
Figure 3 Online calculator example. Here, the probability of obstructive coronary artery disease is calculated for a 60-year-old male with typical chest pain. The calculator is based on the random effects model (Table 3) and is available for online use via http://rcc.simpal.com/RCEval.cgi?Owner= tgenders&RCName=CAD%20consortium. The recalibrated model for the low-risk populations is available via http://rcc. simpal.com/RCEval.cgi?RCID=7TO293.
Figure 5 Reclassification flow chart for women between 30 and 70 years old. See Appendix, Table A8 for reclassification statistics.
Figure 4 Reclassification flow chart for men between 30 and 70 years old. See Appendix, Table A8 for reclassification statistics.
the differences we demonstrated are explained by changes in the risk factor distributions over the past decades, as well as by the differences between populations from the USA and Europe.
All-in-all, we demonstrated that the validity of the Diamond – Forrester model for current practice is limited, which justifies updating. Furthermore, Diamond and Forrester did not provide any estimates for patients above the age of 69. Nowadays, a substantial proportion of patients with chest pain will be at least 70 years old, which motivated the extension of the Diamond – Forrester model. Therefore, we re-estimated the pre-dictive effect of age, sex, and type of chest pain in all patients and confirmed the importance of these in the prediction of obstructive CAD. We also demonstrated that predictions may vary across different hospitals. The performance of the updated model improved discrimination and calibration, as indicated by the c-statistic and the non-significant Hosmer – Lemeshow test. Measures of reclassification indicated correct reclassification by the updated model of a substantial proportion of patients, especially in women. Updated predicted probabilities of obstruc-tive CAD ranged from 10% for a 50-year-old female with non-specific chest pain to 91% for an 80-year-old man with typical chest pain. Prior studies assessed the performance of the Diamond – Forrester model23 or developed new models to esti-mate the pre-test probability of CAD.9,10,24However, in spite of efforts to develop new prediction models, the Diamond – Forrester model remains a common method for estimating the probability of obstructive CAD.2,4
Limitations
The study population was derived from existing databases, some of which were designed for other research objectives (e.g. to investi-gate the diagnostic accuracy of non-invasive imaging tests for CAD). In some studies, all patients underwent the reference stan-dard test, whereas in other studies, patients were selected for CCA based on the results of an index non-invasive test. When evaluating the diagnostic performance of the index non-invasive test, selection based on the test results may lead to ‘verification bias’ or ‘referral bias’ which may bias estimates of sensitivity and specificity of such a test. In the current study, however, we did not assess the diagnostic performance of a non-invasive test, making bias less likely. To explore the potential effect of verifica-tion bias, we used inverse probability weighting on each individual with the probability of verification based on age, sex, and type of chest pain. The analyses with or without correction for verification bias yielded similar results, indicating that our results are unlikely to be biased by selected verification.
The fact that we only included patients who underwent CCA indicates the selection process that occurred in this study. Some of the patients will have had prior positive stress testing or another non-invasive imaging test. However, the association between age, sex, type of chest pain, and the presence of obstruc-tive CAD on CCA does not depend on whether another diagnos-tic imaging test was performed and whether it was positive or not. The elderly, males, and patients with typical chest pain are more likely to undergo stress testing. Such patients are therefore over-represented in our population. Incorporating the test results from the non-invasive test in the prediction model would influence
the prediction of the probability of obstructive CAD. However, our aim was to predict the presence of obstructive CAD on initial presentation prior to diagnostic testing to provide decision support for the decision to test.
The presence of obstructive CAD was determined by CCA. As existing databases were used, CCAs were carried out at each individual hospital according to local protocols. Some institutions used quantitative coronary angiography to determine the degree of stenosis, whereas others used visual assessment. All in all, het-erogeneity due to differences between protocols and guidelines across hospitals could have influenced our results.
One could argue that our study population does not represent the target population of the Diamond – Forrester model because of the high prevalence of CAD. It might be more reasonable to apply the model in patients without a clinical indication for CCA and a lower probability of disease. However, despite the overall high prevalence of disease in our study population, we showed that the Diamond – Forrester model tends to overestimate the prob-ability of CAD. The overestimation will be even larger, if the model would be applied to lower risk populations. As expected, validation of the updated model in the independent data consisting of outpatients presenting with chest pain demonstrated an overes-timation of the probability of CAD, although to a lesser extent than the overestimation by Diamond and Forrester would be. Recalibration results did not justify updating of the predictor effects, suggesting that after adjusting the intercept, our updated model would be valid for the estimation of the pre-test probability of CAD in this low-risk population.
Furthermore, the Diamond – Forrester model predicts the prob-ability of the presence vs. the absence of obstructive CAD. In vali-dation and updating, we focused on this dichotomous outcome. This is a limitation of our study design, since detecting severe CAD (e.g. ≥70% stenosis, multi-vessel disease, left main disease) would have different clinical implications, as those patients would be eligible for revascularization.
Although our total sample size was large, some analyses involved stratification for several variables. This resulted in small numbers of patients in the lower age categories, especially for women because women represented only 30% of the total population.
Clinical implications
According to our analysis, the Diamond – Forrester model overes-timates the probability of obstructive CAD in a contemporary cohort. Thus, the pre-test probability for today’s patients can be estimated with more precision if the updated model is used.
The clinical value of a diagnostic test depends largely on the pre-test probability. A better estimate of the pre-test probability will therefore help clinicians make better decisions as to whether and which diagnostic test is indicated in a particular patient and to decide on further management based on the results of such tests. In patients with a (very) low pre-test probability of disease, a wait-and-see strategy without any testing is preferable. In patients with a high pre-test probability of disease, a direct invasive strategy is optimal. The main benefit of testing is in patients with an inter-mediate pre-test probability, in which a negative test rules out the presence of obstructive CAD, whereas a positive test justifies further testing.
Since the updated model predicts less high probabilities com-pared with the Diamond – Forrester model, using the updated model could lead to decreased referral to CCA, a higher yield of angiography, and increased use of non-invasive testing for risk stra-tification. This would be a welcome response to the issue brought to light by Patel et al.,25who reported that the diagnostic yield of elective coronary angiography in the USA was only 41% (i.e. only 41% was found to have obstructive CAD) and concluded that better risk-stratification tools are needed.
Finally, the revised model is user-friendly and requires only three inputs from the physician. The model can be used via the website, or it could be implemented in electronic patient records or elec-tronic order entry systems.
Future research
Our study focused on the prediction of obstructive CAD accord-ing to age, sex, type of chest pain, and hospital only. Other risk factors such as smoking, diabetes, hypertension and dyslipidaemia have previously been demonstrated to be associated with the pres-ence of CAD.26Therefore, other known cardiovascular risk factors should be considered in future prediction models. On the other hand, the predictive effects of cardiovascular risk factors (in diag-nostic models) are probably small in comparison with the predic-tive effects of age, sex, and type of chest pain, and care should be taken to minimize the number of variables, because simple predic-tion tools are more likely to be used by physicians in clinical practice.
Prospective data should be collected for the development and validation of prediction models, including a more heterogeneous study population. For example, including populations with a lower overall probability of obstructive CAD would improve the generalizability of the results.
Conclusion
All-in-all, we updated and extended the predictive effects of age, sex, and type of chest pain, based on a contemporary cohort and using modern statistical methods. We demonstrated that the Diamond – Forrester model can be improved for the current European situation. The updated model is available online.
Funding
This work was supported by a Health Care Efficiency grant from the Erasmus University Medical Center, Rotterdam. The authors’ work was independent of the funding organizations. The funding organiz-ations had no involvement in the design or conduct of this study; data management and analysis; or manuscript preparation and review or authorization for submission.
Conflict of interest: M.D.: Research Grants—European Regional Development Fund, German Heart Foundation/German Foundation of Heart Research, GE Healthcare (Amersham), Bracco, Guerbet, and Toshiba Medical Systems. Speakers Bureau—Toshiba Medical Systems, Guerbet, and Bayer-Schering. Other—Cardiac CT Workshops: www.ct-kurs.de. Book Author-ship: Coronary CT Angiography, Springer, 2008. Institutional research
collaboration—Siemens Medical Solutions, Philips Medical Systems, and Toshiba Medical Systems. U.J.S. is a consultant for and receives research support from Bayer-Schering, Bracco, General Electric, Medrad, and Siemens. J.J.B. has research grants from Biotronik (Berlin, Germany), BMS Medical Imaging (North Billerica, MA, USA), Boston Scientific (Natick, MA, USA), Edwards Lifesciences (Irvine, CA, USA), GE Healthcare (Buckinghamshire, UK), Medtronic (Minneapolis, MN, USA), and St Jude Medical (St Paul, MN, USA). F.R.G.: No conflicts of interests. F.R.G. is co-supported by the Dutch Technology Foundation STW (Utrecht, The Netherlands), applied science division of NWO, and the Technology Program of the Ministry of Economic Affairs, grant no. 10084. F.P.: This work forms part of the research themes contributing to the translational research portfolio of Barts and The London Cardiovascular Bio-medical Research Unit, which is supported and funded by the National Institute for Health Research. All other authors do not have any potential conflicts of interest, including specific financial interests and relationships and affiliations relevant to the subject matter or materials discussed in the manuscript. The principal investigator, M.G.M.H., had full access to all the data in the study and takes responsibility for the integrity of the data and the accuracy of the data analysis.
Appendix
Validation and updating of the Diamond – Forrester model was performed by T.S.S.G., using state-of-the-art methods.17–19
Validation
The Diamond – Forrester model takes into account age, sex, and type of chest pain and was designed for patients between 30 and 70 years only. For the validation of the Diamond – Forrester model, we therefore excluded both patients below the age of 30 and patients above the age of 69.
‘Original’ Diamond – Forrester coefficients
The Diamond – Forrester model8is based on a Bayesian analysis. Therefore, it does not provide regression coefficients for the effects of age, sex, and type of chest pain on the probability of CAD. To unravel the implicit coefficients of the predictors in this model, we performed a weighted linear regression on the log odds of the Diamond – Forrester predictions per subgroup. The weights were proportional to the inverse of the standard errors reported by Diamond and Forrester. The coefficients obtained by the weighted linear regression are further referred to as the ‘original coefficients’ of Diamond and Forrester.
The observed frequency of CAD in our data set was calculated stratifying for 10-year age category, sex, and type of chest pain (i.e. equivalent to the Diamond – Forrester categories). Observed fre-quencies of CAD were compared with the predicted probabilities of CAD according to Diamond and Forrester and were sub-sequently tabulated (Table 2) and presented by means of cali-bration plots (Figures1and2).
Calibration-in-the-large
In the consortium data, patients aged 30 – 69 (Diamond – Forrester age range) were assigned the log odds of obstructive CAD as esti-mated by the weighted linear regression model, i.e. the linear pre-dictor. A model (Equation 1 in Figure A1) was fitted to calculate the log odds of obstructive CAD as observed in our data set. The linear predictor of Diamond and Forrester (lpD&F) was included in the model and its coefficient was fixed at unity. In this way, the original absolute and relative effects of the original Diamond – Forrester model are maintained. The intercept (anew) is the only free parameter in the model, which allows us to quantify the ‘calibration-in-the-large’ and adjust for difference in disease prevalence. The intercept (anew) can be interpreted as the differ-ence in log odds between the mean observed outcome and the mean predicted probability of CAD according to Diamond and Forrester.19 In other words, we assessed calibration-in-the-large by comparing the mean observed frequency of CAD with the
Figure A1 Equations. Logit, natural log odds of the probability; pCAD, probability of obstructive coronary artery disease;a, intercept of logistic regression model; offset, regression coefficient fixed at unity;b, regression coefficient;d, difference betweenbnewandboriginal(See Table A1 for ‘original’ coefficients); lpD&F, linear predictor of Diamond and Forrester; *, random effect.
Figure A2 Calibration plot of the updated model (See Table A3, Model 1).
. . . . . . . .
. . . .
Table A1 Validation of the Diamond – Forrester model
Model Diamond and Forrester (weighted linear regressiona) ‘original’ regression coefficients
dcoefficientsb(Equation 3 in Figure A1)
(in patients aged 30 – 69, n 5 1683)
Coefficient P-value Coefficient P-value
Baseline analysis a 27.52 — d a 2.97 ,0.001
Age 0.09 — dAge 20.04 ,0.001
Male sex 1.35 — dMale sex 0.05 0.67 Typical CP 3.77 — dTypical CP 21.78 ,0.001 Atypical CP 1.70 — dAtypical CP 21.20 ,0.001 c-Statistic (95% CIc) 0.78 (0.76 – 0.79) 0.78 (0.76– 0.81)
HL P-value ,0.001 0.36
Analyses adjusted for hospitald d a 2.05 ,0.001
dAge 20.04 ,0.001 dMale sex 20.02 0.88 dTypical CP 21.21 ,0.001 dAtypical CP 20.96 ,0.001 c-Statistic (95% CIc) 0.81 (0.79– 0.83) HL P-value 0.06
CP, chest pain; HL, Hosmer – Lemeshow goodness-of-fit test (significant result indicates lack of model fit, poor calibration); a, intercept; lpD&F, linear predictor of Diamond and
Forrester. a
Regression coefficients were approximated by weighted linear regression (see Appendix, Original Diamond-Forrester coefficients). b
Difference between Diamond – Forrester coefficients and refitted coefficients. c
Estimated by bootstrapping with 1000 repetitions. d
Reference category is Erasmus University Medical Center.
mean of the predicted probabilities according to Diamond and Forrester in a logistic regression model. We tested whether the difference (i.e. the intercept) was significantly different from zero.
Recalibration
Next, we recalibrated the model by comparing the average regression slope of Diamond and Forrester with the average regression slope in the consortium data. A second linear predictor variable was added to the model (while maintaining both the pre-vious linear predictor as offset variable and the new intercept), and its coefficient bmiscalibration(Equation 2 in Figure A1) was estimated. This coefficient reflects the miscalibration of the Diamond – Forres-ter predictor effects when compared with the predictor effects in the consortium data.19We tested whether bmiscalibration¼ 0, cor-responding to the hypothesis that the Diamond – Forrester predic-tion (adjusted for calibrapredic-tion-in-the-large) fits the data well. If significant, we conclude that the overall effects of age, sex, and type of chest pain together are different in our data and that model revision is justified.
Re-estimation
Finally, we re-estimated the predictor effects in a model including the linear predictor as offset and the new intercept (Equation 3 in Figure A1). The coefficients from this analysis refer to the difference between the re-estimated and the original coefficients (i.e. d-coefficients). We tested whether these differences were signifi-cantly different from zero. From these analyses, we can judge which predictor effects are different in our data compared with the model according to Diamond and Forrester.
All analyses were performed both unadjusted and adjusted for hospital.
Updating and extension
To update the Diamond – Forrester model, we performed a logis-tic regression analysis (Equation 4 in Figure A1), using all data, including patients below the age of 30 and above the age of 69. All variables (age, sex, and type of chest pain) were entered sim-ultaneously in the model (‘baseline analysis’) (Table A3). To judge whether interaction terms should be considered, we performed an overall test for interaction using second-order interactions of the main effects (i.e. age, sex, and type of chest pain). Significant interaction terms were tested one-by-one and omitted if non-significant. Similarly, interactions between main effects and hospital were tested.
Separately, we extended the model with a random intercept to allow for heterogeneity in CAD prevalence across different hospitals (Equation 5 in Figure A1). Because of potential differ-ences in symptom classification across hospitals, we also tested random effects for type of chest pain across different hos-pitals (Equation 6 in Figure A1). The linearity assumption for the continuous variable age was checked graphically and tested stat-istically by including a restricted cubic spline function (with three knots (2 d.f.).
Diagnostic performance was quantified by calculating the area under the receiver operating curve (c-statistic), and confidence intervals were obtained by bootstrapping with 1000 repetitions. Calibration was estimated by the Hosmer – Lemeshow goodness-of-fit test and by constructing a calibration plot (Figure A2).
. . . .
. . . .
. . . .
Table A3 Updating and extension of the Diamond – Forrester model Coefficient Odds ratio 95% CI lower limit 95% CI upper limit
Model 1: Baseline analysis
Age 0.04 1.04 1.03 1.05 Male sex 1.34 3.82 3.11 4.70 Typical chest pain 1.99 7.33 5.69 9.43 Atypical chest pain 0.50 1.65 1.26 2.16 Non-specific chest paina — — Intercept 24.32 — c-Statistic (95% CIb) 0.79 0.77 0.81 HL P-value 0.52 Model 2: Corrected for verification bias
Age 0.04 1.04 1.02 1.06 Male sex 1.16 3.20 2.47 4.15 Typical chest pain 1.99 7.31 5.62 9.52 Atypical chest pain 0.63 1.87 1.40 2.51 Non-specific chest
paina
— —
Intercept 24.09 —
c-Statistic (95% CIb) 0.78 0.76 0.80 Model 3: Random intercept+ random slope ‘typical chest pain’c Age 0.04 1.04 1.03 1.05 Male sex 1.34 3.82 3.08 4.74 Typical chest pain 1.91 6.72 3.97 11.37 Atypical chest pain 0.64 1.89 1.38 2.59 Non-specific chest paina — — Intercept 24.37 — c-Statistic (95% CIb) 0.82 0.80 0.84 a Reference category. b
Estimated by bootstrapping with 1000 repetitions. c
Group variable is ‘hospital’.
. . . .
Table A2 Logistic regression predicting the probability of verification with conventional coronary angiography
Variable Odds ratio 95% CI P-value
Age 1.04 1.02 1.07 ,0.01 Male sex 2.18 1.34 3.55 ,0.01 Typical chest pain 3.09 1.47 6.50 ,0.01 Atypical chest pain 1.23 0.58 2.61 0.58 Non-specific chest pain Reference
A P-value ,0.05 was considered statistically significant. Statisti-cal analyses were performed using Stata/SE 10.1, StataCorp, TX, USA.
Correction for verification bias
To correct for verification bias in our study population, we per-formed inverse probability weighting on each individual in our data set, using the probability of verification.
For this purpose, we used registry data12,13of 471 outpatients who presented to the cardiologist for the evaluation of chest pain. All patients in this registry were intended to undergo both stress-ECG and CT coronary angiography. Of the 471 patients, 98 were referred for CCA based on clinical parameters and the non-invasive test results.
A logistic regression analysis was performed, predicting the probability of undergoing CCA based on age, sex and type of chest pain (Table A2). Subsequently, the probability of verification was calculated for each individual in the CAD Consortium. The inverse of the probability of verification was used to weigh each individual, which corrects for verification bias.
Reclassification
To assess the clinical utility of the updated Diamond – Forres-ter model, we assessed reclassification of patients between the ages of 30 and 69 for men (Table A4, A5) and women (Table A6, A7) separately, comparing the original Diamond – Forrester probability prediction (i.e. according to age category, sex, and type of chest pain) with the updated model in the
. . . .
. . . .
. . . .
. . . .
Table A5 Reclassification table using probability categories <40 and≥40% (men)
Probability category based on Diamond and Forrester
Probability category based on updated model Total 0 – 40% 40 – 100% 0 – 40% n (%) 150 (67.0) 74 (33.0) 224 (19.3) Observed probability, % 26.0 54.1 35.5 40 – 100% n (%) 22 (2.4) 913 (97.6) 935 (80.7) Observed probability, % 27.3 73.5 72.4 Total n (%) 172 (14.8) 987 (85.2) 1159 (100.0) Observed probability, % 26.2 72.0 65.2 . . . . . . . . . . . . . . . . . . . .
Table A4 Reclassification table using probability categories <30,≥30–70, and ≥70% (men)
Probability category based on Diamond and Forrester
Probability category based on updated model Total 0 – 30% 30 – 70% 70 – 100% 0 – 30% n (%) 62 (27.7) 162 (72.3) — 224 (19.3) Observed probability, % 17.7 42.0 — 35.3 30 – 70% n (%) — 294 (100.0) — 294 (25.4) Observed probability, % — 48.3 48.3 70 – 100% n (%) — 25 (3.9) 616 (96.1) 641 (55.3) Observed probability, % — 64.0 84.3 83.5 Total n (%) 62 (5.4) 481 (41.5) 616 (53.2) 1159 (100.0) Observed probability, % 17.7 47.0 84.3 65.2
. . . .
. . . .
. . . .
. . . .
Table A7 Reclassification table using probability categories <40 and≥40% (women)
Probability category based on Diamond and Forrester
Probability category based on updated model Total 0 – 40% 40 – 100% 0 – 40% n (%) 198 (100.0) — 198 (37.8) Observed probability, % 19.7 — 19.7 40 – 100% n (%) 105 (32.2) 221 (67.8) 326 (62.2) Observed probability, % 32.4 48.9 43.6 Total n (%) 303 (57.8) 221 (42.2) 524 (100.0) Observed probability, % 24.1 48.9 34.5 . . . .
Table A8 Reclassification statistics
Cutoffs Overall reclassification percentage
%Correcta x2
model 1b
P-value x2
model 2c
P-value NRId, % P-value for NRI
,30,≥30–70, ≥70% Men 16.1 100.0 125.5 0 10.9 0.01 214 ,0.001 Women 64.1 100.0 261.7 0 4.25 0.12 219 0.02
,40,≥40% Men 8.3 100.0 99.1 0 6.98 0.03 0 0.99
Women 20.0 100.0 24.0 0 4.0 0.04 2 0.64
NRI, net reclassification improvement. a
If the predicted probability of obstructive CAD of the updated model was closer to the observed probability of CAD compared with the prediction of the original model, the reclassification was considered to be correct.
b
Reclassification calibration (Hosmer – Lemeshow) statistic for the original model, using cells from the reclassification table with at least 20 observations. The significant P-value indicates poor calibration of the original model.
c
Reclassification calibration statistic for the updated model, using cells from the reclassification table with at least 20 observations. The higher P-value indicates better fit of the updated model compared with the original model.
d
The net reclassification improvement is defined as the difference in proportions of patients moving up and down for cases and non-cases separately and it is interpreted as the percentage reclassified, adjusted for the reclassification direction. Here, the net reclassification index is negative because, on average, most individuals are being downclassified by the updated model (i.e. less overestimation by the updated model compared with the Diamond – Forrester model), irrespective or their disease status.
. . . .
. . . .
. . . .
. . . .
. . . .
Table A6 Reclassification table using probability categories <30,≥30–70, and ≥70% (women)
Probability category based on Diamond and Forrester
Probability category based on updated model Total 0 – 30% 30 – 70% 70 – 100% 0 – 30% n (%) 136 (100.0) — — 136 (25.9) Observed probability, % 17.6 — — 17.6 30 – 70% n (%) 122 (70.1) 52 (29.9) — 174 (33.2) Observed probability, % 27.0 36.5 — 29.9 70 – 100% n (%) — 214 (100.0) — 214 (40.8) Observed probability, % — 49.1 — 49.1 Total n (%) 258 (49.2) 266 (50.8) — 524 (100.0) Observed probability, % 22.1 46.6 — 34.5
online calculator [i.e. according to age (continuous), sex and type of chest pain; Table A3, Model 3].
Validation of the updated model
The CAD Consortium population is highly selected based on referral to CCA. To assess the performance of the updated model in a lower risk population, we attempted to validate the model in an independent registry data set (not included in our con-sortium) consisting of unselected outpatients presenting to the cardiologist who were intended to undergo both stress-ECG and CCTA for the evaluation of chest pain.12,13 (This data set was also used to perform the correction for verification bias.)
For this purpose, we followed the step-wise approach as described above (Table A9). Since not all patients in this population underwent CCA, the CCTA results were used as proxy for the reference standard in patients who did not undergo CCA. Out of 471 patients, 17 did not undergo either CCTA or CCA and were therefore excluded from the analysis.
References
1. Noto TJ Jr, Johnson LW, Krone R, Weaver WF, Clark DA, Kramer JR Jr, Vetrovec GW. Cardiac catheterization 1990: a report of the Registry of the Society for Cardiac Angiography and Interventions (SCA&I). Cathet Cardiovasc Diagn 1991;24:75 – 83.
2. Gibbons RJ, Balady GJ, Bricker JT, Chaitman BR, Fletcher GF, Froelicher VF, Mark DB, McCallister BD, Mooss AN, O’Reilly MG, Winters WL Jr, Gibbons RJ, Antman EM, Alpert JS, Faxon DP, Fuster V, Gregoratos G, Hiratzka LF, Jacobs AK, Russell RO, Smith SC Jr. ACC/AHA 2002 guideline update for exercise testing: summary article: a report of the American College of Cardiology/American Heart Association Task Force on Practice Guidelines (Committee to Update the 1997 Exercise Testing Guidelines). Circulation 2002; 106:1883 – 1892.
3. Hendel RC, Berman DS, Di Carli MF, Heidenreich PA, Henkin RE, Pellikka PA, Pohost GM, Williams KA, Wolk MJ, Alagona P Jr, Bateman TM, Cerqueira MD, Corbett JR, Dean AJ, Dehmer GJ, Goldbach P, Gordon L, Kushner FG, Kwong RY, Min J, Quinones MA, Ward RP, Yang SH, Allen J, Brindis RG, Douglas PS, Patel M, Peterson E. ACCF/ASNC/ACR/AHA/ASE/SCCT/SCMR/ SNM 2009 appropriate use criteria for cardiac radionuclide imaging: a report of the American College of Cardiology Foundation Appropriate Use Criteria Task Force, the American Society of Nuclear Cardiology, the American College of Radiology, the American Heart Association, the American Society of Echocardio-graphy, the Society of Cardiovascular Computed TomoEchocardio-graphy, the Society for Cardiovascular Magnetic Resonance, and the Society of Nuclear Medicine: endorsed by the American College of Emergency Physicians. Circulation 2009; 119:e561 – e587.
4. Hendel RC, Patel MR, Kramer CM, Poon M, Hendel RC, Carr JC, Gerstad NA, Gillam LD, Hodgson JM, Kim RJ, Kramer CM, Lesser JR, Martin ET, Messer JV, Redberg RF, Rubin GD, Rumsfeld JS, Taylor AJ, Weigold WG, Woodard PK, Brindis RG, Hendel RC, Douglas PS, Peterson ED, Wolk MJ, Allen JM,
Patel MR. ACCF/ACR/SCCT/SCMR/ASNC/NASCI/SCAI/SIR 2006
appropriateness criteria for cardiac computed tomography and cardiac magnetic resonance imaging: a report of the American College of Cardiology Foundation Quality Strategic Directions Committee Appropriateness Criteria Working Group, American College of Radiology, Society of Cardiovascular Computed Tomography, Society for Cardiovascular Magnetic Resonance, American Society of Nuclear Cardiology, North American Society for Cardiac Imaging, Society for Cardiovascular Angiography and Interventions, and Society of Inter-ventional Radiology. J Am Coll Cardiol 2006;48:1475 – 1497.
5. Pauker SG, Kassirer JP. The threshold approach to clinical decision making. N Engl J Med 1980;302:1109 – 1117.
6. Hunink MGM, Glasziou PP, Siegel JE, Weeks J, Pliskin J, Elstein A, Weinstein M. Decision Making in Health and Medicine: Integrating Evidence and Values. Cambridge: Cambridge University Press; 2001.
7. Genders TS, Meijboom WB, Meijs MF, Schuijf JD, Mollet NR, Weustink AC, Pugliese F, Bax JJ, Cramer MJ, Krestin GP, de Feyter PJ, Hunink MG. CT coronary angiography in patients suspected of having coronary artery disease: decision making from various perspectives in the face of uncertainty. Radiology 2009; 253:734 – 744.
8. Diamond GA, Forrester JS. Analysis of probability as an aid in the clinical diagnosis of coronary-artery disease. N Engl J Med 1979;300:1350 – 1358.
9. Pryor DB, Harrell FE Jr, Lee KL, Califf RM, Rosati RA. Estimating the likelihood of significant coronary artery disease. Am J Med 1983;75:771 – 780.
10. Pryor DB, Shaw L, McCants CB, Lee KL, Mark DB, Harrell FE Jr, Muhlbaier LH, Califf RM. Value of the history and physical in identifying patients at increased risk for coronary artery disease. Ann Intern Med 1993;118:81 – 90.
11. EIBIR. European Institute for Biomedical Imaging Research.http://www.eibir.org/
cms/website.php.
12. Nieman K, Galema T, Weustink A, Neefjes L, Moelker A, Musters P, de Visser R, Mollet N, Boersma H, de Feijter PJ. Computed tomography versus exercise elec-trocardiography in patients with stable chest complaints: real-world experiences from a fast-track chest pain clinic. Heart 2009;95:1669 – 1675.
13. Nieman K, Galema TW, Neefjes LA, Weustink AC, Musters P, Moelker AD, Mollet NR, de Visser R, Boersma E, de Feijter PJ. Comparison of the value of coronary calcium detection to computed tomographic angiography and exercise testing in patients with chest pain. Am J Cardiol 2009;104: 1499 – 1504.
14. Begg CB, Greenes RA. Assessment of diagnostic tests when disease verification is subject to selection bias. Biometrics 1983;39:207 – 215.
15. Hunink MG, Polak JF, Barlan MM, O’Leary DH. Detection and quantification of carotid artery stenosis: efficacy of various Doppler velocity parameters. AJR Am J Roentgenol 1993;160:619 – 625.
16. Diamond GA. A clinically relevant classification of chest discomfort. J Am Coll Cardiol 1983;1(2 Pt 1):574 – 575.
17. Harrell FE. Regression Modeling Strategies: With Applications to Linear Models, Logistic Regression, and Survival Analysis. New York: Springer; 2001.
18. Steyerberg EW, Borsboom GJ, van Houwelingen HC, Eijkemans MJ, Habbema JD. Validation and updating of predictive logistic regression models: a study on sample size and shrinkage. Stat Med 2004;23:2567 – 2586.
19. Steyerberg EW. Clinical Prediction Models: A Practical Approach to Development, Validation and Updating. New York: Springer; 2008.
20. Meijboom WB, van Mieghem CA, Mollet NR, Pugliese F, Weustink AC, van Pelt N, Cademartiri F, Nieman K, Boersma E, de Jaegere P, Krestin GP, de Feyter PJ. 64-slice computed tomography coronary angiography in patients with high, intermediate, or low pretest probability of significant coronary artery disease. J Am Coll Cardiol 2007;50:1469 – 1475.
21. Pencina MJ, D’Agostino RB Sr, D’Agostino RB Jr, Vasan RS. Evaluating the added predictive ability of a new marker: from area under the ROC
. . . . . . . .
. . . .
Table A9 Validation of the updated model
Calibration-in-the-large Recalibration
Coefficient P-value Coefficient P-value
a 20.92 ,0.001 20.92 ,0.001
lpconsortium 1 — 20.03 0.79
lpconsortium 1 —
c-Statistic (95% CIa) 0.76 (0.71 – 0.81) 0.76 (0.71 – 0.81)
a, intercept; lpconsortium, linear predictor of the updated model (random effects model, see Table3).
a
Estimated by bootstrapping with 1000 repetitions.
curve to reclassification and beyond. Stat Med 2008;27:157 – 172; Discussion 207 – 212.
22. Cook NR, Ridker PM. Advances in measuring the effect of individual predictors of cardiovascular risk: the role of reclassification measures. Ann Intern Med 2009;150: 795 – 802.
23. Morise AP, Haddad WJ, Beckner D. Development and validation of a clinical score to estimate the probability of coronary artery disease in men and women presenting with suspected coronary disease. Am J Med 1997;102:350 – 356.
24. Morise AP, Bobbio M, Detrano R, Duval RD. Incremental evaluation of exercise capacity as an independent predictor of coronary artery disease presence and extent. Am Heart J 1994;127:32 – 38.
25. Patel MR, Peterson ED, Dai D, Brennan JM, Redberg RF, Anderson HV, Brindis RG, Douglas PS. Low diagnostic yield of elective coronary angiography. N Engl J Med 2010;362:886 – 895.
26. Chun AA, McGee SR. Bedside diagnosis of coronary artery disease: a systematic review. Am J Med 2004;117:334 – 343.
CARDIOVASCULAR FLASHLIGHT
. . . .
doi:10.1093/eurheartj/ehq461
Online publish-ahead-of-print 17 December 2010
Saphenous vein graft aneurysm connected to lung parenchyma: a very
unusual cause of haemoptysis
Juan Jime´nez-Ja´imez*, Eduardo Molina, and Rafael Melgares
Cardiology Department, Virgen de las Nieves Universitary Hospital, Granada, Spain
*Corresponding author. Tel:+34 667 242 021, Fax: +34 958 020 158, Email:jimenez.jaimez@gmail.com
A 74-year-old man, with a coronary artery bypass surgery 12 years before, was referred for a life-threatening episode of haemoptysis. Chest X-ray showed mild cardiome-galy and a right pulmonary mass (Panel A, arrow) located close to the pulmonary hilum. Computed tomography angiogram (Panel B) demonstrated an aortic pseudoa-neurysm with thrombus (arrow) placed at the proximal anastomosis of a saphenous vein graft to circum-flex artery that was occluded. Three-dimensional computed tomography reconstruction (Panel C) showed the anterolateral position of the aneurysm (long arrow) that was con-nected to lung parenchyma (short arrow) with no evidence of aorto-bronchial fistula. This was also observed in aortography where we could appreciate complete absence of blood flow to lung or bronchi after injection of contrast (Panel D). Surgery was performed and intrao-peratory transoesophageal echocar-diography showed the ascending aortic dilatation (Panel E); Panels F
and G show the large saphenous vein graft aneurysm at the proximal anastomosis connected to lung parenchyma corrected with a Gore Tex patch.