COHORT PROFILE
Cohort Profile: The Swiss National Cohort—a
longitudinal study of 6.8 million people
Matthias Bopp,1 Adrian Spoerri,2 Marcel Zwahlen,2 Felix Gutzwiller,1 Fred Paccaud,3 Charlotte Braun-Fahrla¨nder,4 Andre´ Rougemont5 and Matthias Egger2*
Accepted 11 February 2008
How did the study come about?
For many years research on socio-economic inequal-ities in health in Switzerland was based on cross-sectional data.1–3 Cross-sectional studies are problematic for several reasons. For example, results may be affected by numerator/denominator bias.4 Furthermore, occupational information from death certificates was used to describe the socio-economic position of individuals. However, this meant that those who do not work, older men and a substantial proportion of women, had to be excluded.
Decennial censuses, conducted at the beginning of December every 10 years, have been done in Switzerland since 1850 (exceptions were 1890 and 1940, which were replaced by a census in 1888 and 1941, respectively). Deaths and causes of death have been registered since 1876, with data stored electro-nically since 1969. Death registration is anonymous. However, the date of death and birth are available, as well as gender, marital status, place of residence, date of birth of spouse and other variables. The 1990 census for the first time included the exact date of birth, which opened the possibility of linking census and mortality data. Based on the promising results of
a pilot study that was done for one Canton at University of Zurich, the project was extended to cover the whole of Switzerland, linking the 1990 census with mortality records up to the end of 1997.5 The results indicated that linkage was less successful for foreign nationals and young adults, and led to the inclusion of additional data sources, including data on immigrants and emigrants and, importantly, the 2000 census.6In 2005, an application by all five University Institutes of Social and Preventive Medicine (ISPMs) to obtain long-term funding for a Swiss National Cohort study (SNC) was successful within the frame-work of a Swiss National Science Foundation initia-tive to support longitudinal studies. Approval was obtained from the Ethics Committees of the Cantons of Zurich and Bern and a data centre was established at ISPM Bern.
What does the study cover?
The SNC is a national longitudinal research platform with an evolving, multi-faceted research programme. Ongoing research projects include examining to what extent variations in all-cause and cause-specific mortality across municipalities can be explained by differences in their socio-economic profile; developing an area-based indicator of socio-economic status for use in health research in Switzerland; a life-course approach to mortality differentials, using data from the 1970 and 1980 censuses; examining the socio-economic determinants of mortality in the old and very old; and the epidemiology of specific causes of death (e.g. road traffic accidents, suicides, perinatal deaths, lung cancer and coronary heart disease).
The SNC also provides support to other cohort studies, for example the Swiss HIV Cohort Study,7the Swiss Hepatitis C Cohort Study,8the Swiss Childhood Cancer Registry9,10 or the Swiss Cohort Study on Air Pollution and Lung Diseases in Adults (SAPALDIA).11 This involves, for example, dedicated linkage studies to increase the completeness of follow-up for vital * Corresponding author. Institute of Social and Preventive
Medicine (ISPM), Finkenhubelweg 11, CH-3012 Bern, Switzerland. E-mail: [email protected]
Matthias Bopp and Adrian Spoerri contributed equally to this work.
1
Institute of Social and Preventive Medicine (ISPM), University of Zurich, Zurich, Switzerland.
2
Institute of Social and Preventive Medicine (ISPM), University of Bern, Bern, Switzerland.
3Institute of Social and Preventive Medicine (IUMSP), University Hospital and Faculty of Biology and Medicine, Lausanne, Switzerland.
4
Institute of Social and Preventive Medicine (ISPM), University of Basle, Basle, Switzerland.
5
Institut de Me´dicine Sociale et Pre´ventive (IUMSP), University of Geneva, Geneva, Switzerland.
status and causes of death, or the provision of data on the representativeness of study populations enrolled in other cohorts. Finally, we are exploring the possibility of linking the SNC with the Swiss data of the Multinational MONItoring of trends and determi-nants in CArdiovascular disease (MONICA) study12 and other Swiss health surveys13,14 that include infor-mation on attitudes, behaviours, life styles, as well as self-reported health status, uptake of preventive interventions and utilization of health services.
What has been measured?
All variables from the 1990 census are available in the SNC, and additional questions were introduced in 2000. The census consists of three questionnaires: one for every individual living in the household (102 variables in 1990, 172 in 2000), a household questionnaire (161 variables in 1990, 204 in 2000), which also covers characteristics of the dwelling and a further questionnaire on the building (66 variables 1990, 48 in 2000). The questionnaires (in German, French, Italian and English) and variable lists (in German and French) are available from the SNC’s website, at www.swissnationalcohort.ch. Table 1 gives an overview of the information collected in the 1990 census. Causes of death were coded according to the eighth revision of the International Classification of Diseases, Injuries and Causes of Death (ICD-8) until 1994. Since 1995 the 10th revision (ICD-10) has been used. In addition to the date and cause of death and socio-demographic data, information on the time and
place of death is included in the mortality file. Registration of deaths is near complete for people dying in Switzerland, but less complete for deaths among immigrants who returned to their countries after retirement.6
Who is in the sample?
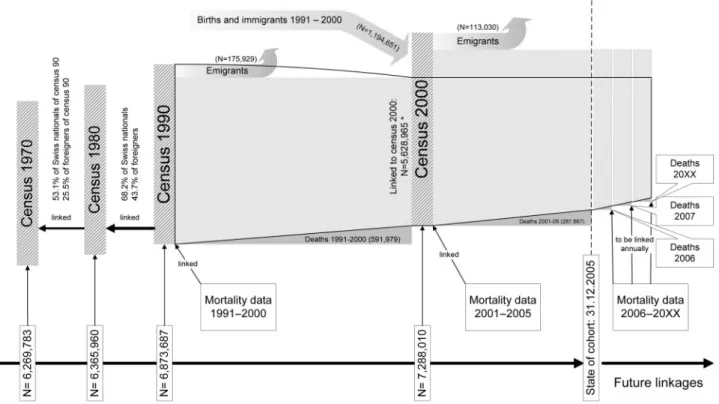
The anatomy of the SNC is shown in Figure 1. The core cohort consists of the 6.874 million residents who participated in the 1990 census. Participation in the census is mandatory in Switzerland and enumera-tion is virtually complete. The Federal Office of Statistics assessed non-participation in the 2000 census and estimated coverage at 98.6%.15 At the time of writing (September 2007), census data from 2000, mortality and migration files up to 2005 had been linked with the 1990 census, resulting in 96.7 million person-years of follow up during which 875 269 deaths occurred. The database is continuously updated with the latest mortality and migration files. Table 2 shows the characteristics of the study population: 82% were Swiss nationals, 51% were females, the mother tongue was German in 64% and 46% were aged 30–64 years. The largest religious group was catholic (46%). Among indivi-duals aged 525, vocational education was most common (45%).
How were records linked?
In the absence of a unique personal identifier, both deterministic and probabilistic methods of record linkage were used to link records from the 1990 census to a death record, a 2000 census record or an emigration record. In the first step, pairs of records that were matched on sex, date of birth, marital status, nationality, religion and place of residence were identified. In subsequent steps, probabilistic record linkage was used, which estimates the prob-ability that a pair of records from different datasets relates to the same person.16 Additional variables, in particular information on the spouse and family structure were used in this process. Based on probability weights, possible matches were accepted or rejected. Linkage was recently automated using the Generalized Record Linkage System (GRLS) package developed by Statistics Canada.17GRLS is an iterative procedure with predefined criteria for blocking and rules for how linkage variables are compared and weighted. GRLS is used each year to include the latest published mortality data.
Of 6 873 687 individuals registered in the 1990 census, 5 628 965 (81.9%) could be linked to a 2000 census record and, during the period 1990–2000, 175 929 (2.6%) to an emigration record and 591 979 (8.6%) to a mortality record (Figure 1). For the remaining 476 814 individuals with a 1990 census
Table 1 Summary of key variables from 1990 census Key variables
Individual Sex; date of birth; place of birth; nationality; marital status; religion; mother tongue; language used at home, work and school; place of residence; place of residence 5 years ago; educational level; current and learned profession(s); employ-ment status; occupational status; place of work and type of transport to work.
Household and characteristics of dwelling
Household type; number of persons living in household; children and other relatives living in household; floor; number of rooms; surface area; type of kitchen; owned or rented accommodation and rent per month.
Building characteristics Type of building; number of flats in same building; number of floors; age of building, renovations; own-ership of building; type of hot water supply, sewerage and heating and geographical coordinates.
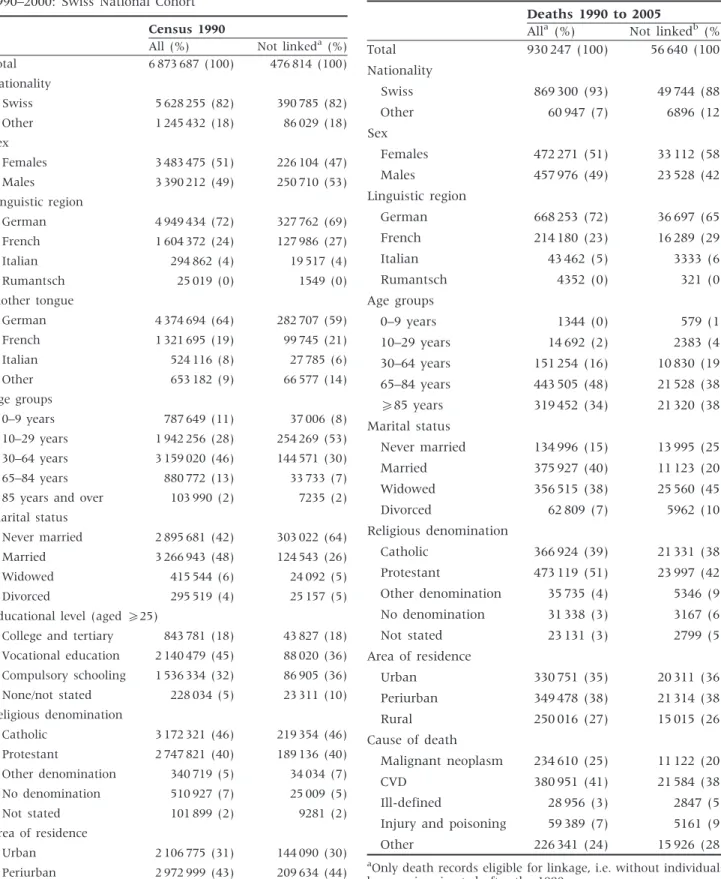
records (6.9%) no satisfactory link could be found. Table 2 compares unlinked census records with all records from census 1990. The majority of unlinked records related to individuals aged 10–29 years. The lower linkage rates among young adults are probably due to their high mobility and residence in larger cities, which makes linkage more difficult. Also, a large proportion of young adults live in single house-holds, which precludes the use of information on the spouse and family as additional linkage variables.
Of the 937 637 deaths recorded from December 5, 1990 (the day after the census) to the end of 2005, 875 269 (93.3%) could be linked to a 1990 census record. Table 3 compares the characteristics of all deaths from the census 1990 up to 2005 with those, which could be reasonably linked to a census record. Deaths that could not be linked were younger at death, less likely to be Swiss nationals and more likely to be women and single. Injury and poisoning, ill-defined causes and other causes were more common among unlinked deaths, and malignancies and cardiovascular causes more common among linked deaths.
Of note, people recorded in the 1990 census were also traced back to the censuses of 1980 and 1970. Despite the fact that in the earlier censuses only the year of birth, rather than exact birth dates are available, a substantial proportion of records could be linked: 82.2% of individuals born before 1940 could be found in the 1980 census and 74.3% also in the
1970 census (Figure 1). Similar results were obtained for the 2000 census.
What has the Swiss National
cohort found?
Recent analyses of SNC data focused on mortality differentials by level of education among men and women of Swiss nationality, based on mortality data up to 1997.18 Standardized mortality ratios for men aged 25–39 were 61 (95% confidence interval 54–70) among men with university education, compared with 196 (184–209) among men with compulsory schooling or less. Gradients in women were less pronounced. When expressed as differentials in life expectancy,19 men with university education aged 30, 50, 65 and 80 years lived 7.1, 5.4, 3.5 and 1.6 years, respectively longer than their counterparts with compulsory education only. In women the corresponding differ-ences were 3.6, 3.1, 2.7 and 2.2 years, respectively. During the years leading to the establishment of the SNC, mortality data from the German-speaking part of Switzerland were included in several analyses of the SEDHA project (Socio-Economic Determinants of Healthy Aging), which studied socio-economic differ-ences in morbidity and mortality in adults in different European countries. Swiss data contributed to ana-lyses of educational gradients in all-cause mortality20
Table 2 Socio-demographic characteristics of entire study population from 1990 census and persons not linked to either the 2000 census or a mortality or emigration record 1990–2000: Swiss National Cohort
Census 1990
All (%) Not linkeda(%)
Total 6 873 687 (100) 476 814 (100) Nationality Swiss 5 628 255 (82) 390 785 (82) Other 1 245 432 (18) 86 029 (18) Sex Females 3 483 475 (51) 226 104 (47) Males 3 390 212 (49) 250 710 (53) Linguistic region German 4 949 434 (72) 327 762 (69) French 1 604 372 (24) 127 986 (27) Italian 294 862 (4) 19 517 (4) Rumantsch 25 019 (0) 1549 (0) Mother tongue German 4 374 694 (64) 282 707 (59) French 1 321 695 (19) 99 745 (21) Italian 524 116 (8) 27 785 (6) Other 653 182 (9) 66 577 (14) Age groups 0–9 years 787 649 (11) 37 006 (8) 10–29 years 1 942 256 (28) 254 269 (53) 30–64 years 3 159 020 (46) 144 571 (30) 65–84 years 880 772 (13) 33 733 (7)
85 years and over 103 990 (2) 7235 (2)
Marital status
Never married 2 895 681 (42) 303 022 (64)
Married 3 266 943 (48) 124 543 (26)
Widowed 415 544 (6) 24 092 (5)
Divorced 295 519 (4) 25 157 (5)
Educational level (aged525)
College and tertiary 843 781 (18) 43 827 (18)
Vocational education 2 140 479 (45) 88 020 (36) Compulsory schooling 1 536 334 (32) 86 905 (36) None/not stated 228 034 (5) 23 311 (10) Religious denomination Catholic 3 172 321 (46) 219 354 (46) Protestant 2 747 821 (40) 189 136 (40) Other denomination 340 719 (5) 34 034 (7) No denomination 510 927 (7) 25 009 (5) Not stated 101 899 (2) 9281 (2) Area of residence Urban 2 106 775 (31) 144 090 (30) Periurban 2 972 999 (43) 209 634 (44) Rurual 1 793 913 (26) 123 090 (26) a
Not linked to census 2000 or a death or emigration record 1990–2000.
Table 3 Socio-demographic characteristics of all deaths 1990–2005 and unlinked deaths: Swiss National Cohort
Deaths 1990 to 2005
Alla (%) Not linkedb (%) Total 930 247 (100) 56 640 (100) Nationality Swiss 869 300 (93) 49 744 (88) Other 60 947 (7) 6896 (12) Sex Females 472 271 (51) 33 112 (58) Males 457 976 (49) 23 528 (42) Linguistic region German 668 253 (72) 36 697 (65) French 214 180 (23) 16 289 (29) Italian 43 462 (5) 3333 (6) Rumantsch 4352 (0) 321 (0) Age groups 0–9 years 1344 (0) 579 (1) 10–29 years 14 692 (2) 2383 (4) 30–64 years 151 254 (16) 10 830 (19) 65–84 years 443 505 (48) 21 528 (38) 585 years 319 452 (34) 21 320 (38) Marital status Never married 134 996 (15) 13 995 (25) Married 375 927 (40) 11 123 (20) Widowed 356 515 (38) 25 560 (45) Divorced 62 809 (7) 5962 (10) Religious denomination Catholic 366 924 (39) 21 331 (38) Protestant 473 119 (51) 23 997 (42) Other denomination 35 735 (4) 5346 (9) No denomination 31 338 (3) 3167 (6) Not stated 23 131 (3) 2799 (5) Area of residence Urban 330 751 (35) 20 311 (36) Periurban 349 478 (38) 21 314 (38) Rural 250 016 (27) 15 015 (26) Cause of death Malignant neoplasm 234 610 (25) 11 122 (20) CVD 380 951 (41) 21 584 (38) Ill-defined 28 956 (3) 2847 (5) Injury and poisoning 59 389 (7) 5161 (9) Other 226 341 (24) 15 926 (28)
a
Only death records eligible for linkage, i.e. without individuals born or immigrated after the 1990 census.
b
and cause-specific mortality,21 including mortality from cancer,22,23 cardiovascular disease,24,25 traffic accidents 26 and suicide.27 Another study examined the influence of marital status on suicide risk.28 The results showed that despite a comparatively low overall mortality, Swiss men, and particularly young men, tended to show steeper educational mortality gradients than men in other European countries. In contrast, gradients in Swiss women were below average. More recently, the SNC contributed data to the EUROTHINE project (Tackling Health Inequalities in Europe: an integrated approach). A recent analysis of alcohol related cancer mortality showed that gradients in Swiss men were among the steepest in Western European populations.29
What are the main strengths and
weaknesses?
Based on the entire Swiss population in 1990, i.e. 6.8 million men, women and children and a follow-up of currently 15 years, the SNC is one of the largest longitudinal datasets worldwide. Value is added by the fact that Switzerland includes several distinct cultural, linguistic and geographical regions and populations within the same country and health system. We believe the SNC has considerable poten-tial, considering the wealth of data that is available from the census, which included separate and detailed questionnaires at the level of the person, household and dwelling, with information that is not generally available in longitudinal studies. Because each building is geo-referenced, the SNC also allows the study of environmental exposures, for example electromagnetic fields from power lines. Finally, the linkage of the census with other existing databases means that the SNC is very cost-effective.
An important limitation is the SNC’s reliance on routine mortality data for outcomes, and the lack of information on lifestyle and other exposures. Swiss mortality records are virtually complete for deaths that occurred in Switzerland. However, deaths among immigrants are under ascertained, particularly in older individuals who tend to return to their countries after retirement.6 The accuracy of death certificates was estimated in a comparison of information on cause of death from hospital discharge records with the data available from the routine mortality statistics in Switzerland in 1989.30There was good concordance (485%) for most of the malignant neoplasms, cerebrovascular diseases, ischaemic heart disease and accidents, but low concordance (<65%) for diseases of nervous system, chronic respiratory diseases and other forms of heart diseases. More recent interna-tional studies support these results: routine cause of death information is generally accurate for clearly defined diagnoses including, for example, malignant neoplasms, but less accurate for less well defined
conditions such as chronic obstructive pulmonary disease (COPD).31–33
Can I get hold of the data and
where can I find out more?
The SNC database is open to collaborations with national and international researchers. Access to raw and tabulated data has to be approved by Swiss Federal Statistical Office, who owns the data. We invite interested parties to contact the study team ([email protected].) in order to discuss project ideas, data access and the submission of a concept to the study’s Scientific Board. Templates for concept sheets and further information on the study are available at www.swissnationalcohort.ch.
Acknowledgements
We are grateful to the Swiss National Science Foundation for funding this project (grant No. 3347C0-108806). We also thank Swiss Federal Statistical Office, whose support made the Swiss National Cohort possible.
Conflict of interest: None declared.
References
1Minder CE. Socio-economic factors and mortality in
Switzerland. Soz Praventivmed 1993;38:313–28.
2Beer V, Bisig B, Gutzwiller F. Social class gradients in
years of potential life lost in Switzerland. Soc Sci Med 1993;37:1011–18.
3Egger M, Minder CE, Davey Smith G. Health inequalities
and migrant workers in Switzerland. Lancet 1990;336:816.
4Kunst AE, Groenhof F, Borgan JK et al. Socio-economic
inequalities in mortality. Methodological problems illu-strated with three examples from Europe. Rev Epidemiol Sante Publique 1998;46:467–79.
5Bopp M, Gutzwiller F. Record Linkage von Volksza¨hlung
1990 und Todesursachenstatistik 1990–97 in der Schweiz. 2000. Forschung und Dokumentation No. 23. Zu¨rich: Institut fu¨r Sozial- und Pra¨ventivmedizin der Universita¨t, 2000.
6Bopp M, Gutzwiller F. Die Swiss National Cohort 1990–2000
– eine soziodemografische Datenbasis fu¨r longitudinale Gesundheitsanalysen. Swiss National Cohort Report Nr. 5, Forschung und Dokumentation 28. Zu¨rich: Institut fu¨r Sozial- und Pra¨ventivmedizin, 2007.
7
Egger M, Hirschel B, Francioli P et al. Impact of new antiretroviral combination therapies in HIV infected patients in Switzerland: prospective multicentre study. Br Med J 1997;315:1194–99.
8
Prasad L, Spicher VM, Zwahlen M, Rickenbach M, Helbling B, Negro F. Cohort Profile: the Swiss Hepatitis C Cohort Study (SCCS). Int J Epidemiol 2007;36:731–37.
9
Michel G, von der Weid NX, Zwahlen M, Redmond S, Strippoli MP, Kuehni CE. Incidence of childhood cancer
in Switzerland: the Swiss Childhood Cancer Registry. Pediatr Blood Cancer 2008;50:46–51.
10
Michel G, von der Weid NX, Zwahlen M, Adam M, Rebholz CE, Kuehni CE. The Swiss Childhood Cancer Registry: rationale, organisation and results for the years 2001–2005. Swiss Med Wkly 2007;137:502–9.
11
Ackermann-Liebrich U, Kuna-Dibbert B, Probst-Hensch NM et al. Follow-up of the Swiss Cohort Study on Air Pollution and Lung Diseases in Adults (SAPALDIA 2) 1991–2003: methods and characterization of participants. Soz Praventivmed 2005;50:245–63.
12
Rickenbach M, Gutzwiller F, Wietlisbach V, Martin J, Epstein FH. Switzerland’s participation in MONICA. Soz Praventivmed 1985;30:95–99.
13Gutzwiller F, La Vecchia C, Levi F, Negri E, Wietlisbach V.
Education, disease prevalence and health service utiliza-tion in the Swiss Nautiliza-tional Health Survey ‘‘SOMIPOPS’’. Prev Med 1989;18:452–59.
14
Eichholzer M, Bisig B. Daily consumption of (red) meat or meat products in Switzerland: results of the 1992/93 Swiss Health Survey. Eur J Clin Nutr 2000;54:136–42.
15
Bundesamt fu¨r Statistik. Eidgeno¨ssische Volksza¨hlung 2000. Abschlussbericht zur Volksza¨hlung 2000. Neuchaˆtel: Bundesamt fu¨r Statistik, 2005.
16
Fellegi IP, Sunter AB. A theory of record linkage. J Am Stat Assoc 1969;64:1183–210.
17
Fair M. Generalized record linkage system - Statistics Canada’s record linkage software. Austrian J Stat 2004;33:37–53.
18
Bopp M, Minder CE. Mortality by education in German speaking Switzerland, 1990–1997: results from the Swiss National Cohort. Int J Epidemiol 2003;32:346–54.
19Spoerri A, Zwahlen M, Egger M, Gutzwiller F, Minder C,
Bopp M. Educational inequalities in life expectancy in German speaking part of Switzerland 1990–1997: Swiss National Cohort. Swiss Med Wkly 2006;136:145–48.
20
Huisman M, Kunst AE, Andersen O et al. Socioeconomic inequalities in mortality among elderly people in 11 European populations. J Epidemiol Community Health 2004;58:468–75.
21
Huisman M, Kunst AE, Bopp M et al. Educational inequalities in cause-specific mortality in middle-aged and older men and women in eight western European populations. Lancet 2005;365:493–500.
22
Mackenbach JP, Huisman M, Andersen O et al. Inequalities in lung cancer mortality by the educational level in 10 European populations. Eur J Cancer 2004;40:126–35.
23
Strand BH, Kunst A, Huisman M et al. The reversed social gradient: higher breast cancer mortality in the higher educated compared to lower educated. A comparison of 11 European populations during the 1990s. Eur J Cancer 2007;43:1200–7.
24Avendano M, Kunst AE, Huisman M et al. Socioeconomic
status and ischaemic heart disease mortality in 10 western European populations during the 1990s. Heart 2006;92:461–67.
25Avendano M, Kunst AE, Huisman M et al. Educational
level and stroke mortality: a comparison of 10 European populations during the 1990s. Stroke 2004;35:432–37.
26Borrell C, Plasencia A, Huisman M et al. Education level
inequalities and transportation injury mortality in the middle aged and elderly in European settings. Inj Prev 2005;11:138–42.
27Lorant V, Kunst AE, Huisman M, Costa G, Mackenbach J.
Socio-economic inequalities in suicide: a European comparative study. Br J Psychiatry 2005;187:49–54.
28Lorant V, Kunst AE, Huisman M, Bopp M,
Mackenbach J. A European comparative study of marital status and socio-economic inequalities in suicide. Soc Sci Med 2005;60:2431–41.
29Menvielle G, Kunst AE, Stirbu I et al. Socioeconomic
inequalities in alcohol related cancer mortality among men: to what extent do they differ between Western European populations? Int J Cancer 2007;121:649–55.
30
Minder, C, Zingg W. Die Sterblichkeitsstatistik in der Schweiz. Amtliche Statistik der Schweiz No. 155. Bern: Bundesamt fu¨r Statistik, 1989.
31
Weinstock MA, Reynes JF. Validation of cause-of-death certification for outpatient cancers: the contrasting cases of melanoma and mycosis fungoides. Am J Epidemiol 1998;148:1184–86.
32
Lahti RA, Penttila A. Cause-of-death query in validation of death certification by expert panel; effects on mortality statistics in Finland, 1995. Forensic Sci Int 2003;131:113–24.
33
Jensen HH, Godtfredsen NS, Lange P, Vestbo J. Potential misclassification of causes of death from COPD. Eur Respir J 2006;28:781–85.