Heritability of The Retinal Microcirculation
in Flemish Families
Yan-Ping Liu,
1Tatiana Kuznetsova,
1Yu Jin,
1,2Lutgarde Thijs,
1Kei Asayama,
1,3Yu-Mei Gu,
1Murielle Bochud,
4Peter Verhamme,
5Harry A.J. Struijker-Boudier,
6and Jan A. Staessen
1,7Background
Few population studies have described the heritability and intrafamilial concordance of the retinal microvessels, or the genetic or environmen-tal correlations of the phenotypes of these vessels.
Methods
We randomly selected 413 participants from 70 families (mean age, 51.5 years; 50.1% women) from a Flemish population. We post-processed retinal images using IVAN software to generate the central retinal arteriole equivalent (CRAE), central retinal venule equivalent (CRVE), and arteriole-to-venule-ratio (AVR) from these images. We used SAGE version 6.2 and SAS version 9.2 to compute multivariate-adjusted estimates of heritability and intrafamilial correlations of the CRAE, CRVE, and AVR of the retinal microvessels in the images.
results
Sex, age, mean arterial pressure, and smoking explained up to 12.7% of the variance of the phenotypes of the retinal microvessels of the study participants. With adjustments applied for these covariates, the
heritability estimates of CRAE, CRVE, and AVR were 0.213 (P = 0.044), 0.339 (P = 0.010), and 0.272 (P = 0.004), respectively. The parent–off-spring correlations for CRAE, CRVE, and AVR were 0.118 (NS), 0.225 (P < 0.01), and 0.215 (P < 0.05), respectively. The corresponding values were 0.222 (P < 0.05), 0.213 (P < 0.05), and 0.390 (P < 0.001) for sib–sib correlations, respectively. The genetic and environmental correlations between CRAE and CRVE were 0.360 and 0.545 (P < 0.001 for both).
conclusion
Our study showed moderate heritability for CRAE, CRVE, and AVR, and a significant genetic correlation of CRAE with CRVE in the Flemish popu-lation of our study. These findings suggest that genetic factors influ-ence the diameter of the retinal microvessels, and that CRAE and CRVE share some genetic determinants.
Keywords: blood pressure; heritability; hypertension; micro circulation;
retina.
doi:10.1093/ajh/hps064
Nonmydriatic imaging systems allow easy and noninvasive visualization of the retinal microvessels, and thereby provide a “window” to assess the microcirculation in the central ner-vous system (CNS).1 Reduced arteriolar diameter predicts
the risk of hypertension,2 stroke,3 and cardiovascular death.4
Genome-wide linkage studies,5–8 although not consistent in
identifying specifically responsible loci, have suggested that genetic factors contribute substantially to interindividual variation in the diameter of the retinal microvessels.
Heritability refers to the concordance in phenotypic traits between related individuals. Twin studies6,9,10 have found a
range of from 56%–70% and of 62%–83% in the heritability of the central retinal arteriole equivalent (CRAE) and cen-tral retinal venule equivalent (CRVE), respectively. To the best of our knowledge, only one previous study assessed the familial aggregation of the CRAE and CRVE in a popula-tion–based cohort, of which 99% of the members were white Americans.11 In the present study, we assessed the
heritabil-ity, intrafamilial concordance, and genetic and environmen-tal correlations of the diameters of the central retinal vessels in complex pedigrees randomly recruited from a Flemish population.
1studies coordinating centre, division of hypertension and
cardiovascular rehabilitation, department of cardiovascular sciences, university of leuven, leuven, Belgium; 2department of cardiology, Maastricht university Medical centre, Maastricht, the netherlands; 3department of Planning for drug development and clinical evaluation, tohoku university graduate school of Pharmaceutical sciences, sendai, Japan; 4community Prevention unit, institute of social and Preventive Medicine, university of lausanne, lausanne, switzerland; 5centre for Molecular and Vascular Biology, department of cardiovascular sciences, university of leuven, leuven, Belgium ; 6department of Pharmacology, Maastricht university, Maastricht, the netherlands; 7department of epidemiology, Maastricht university, Maastricht, the netherlands
Correspondence: Jan A. Staessen (jan.staessen@med.kuleuven.be). Initially submitted August 13, 2012; date of first revision October 25, 2012; accepted for publication November 09, 2012.
© American Journal of Hypertension, Ltd 2013. All rights reserved. For Permissions, please email: journals.permissions@oup.com
Methods study population
Previous reports provide a detailed description of the recruitment of the participants in the Flemish Study on Environment, Genes and Health Outcomes
(FLEMENGHO).12 From August 1985 until November
1990, a random sample was taken of the households in a geographically defined area of Northern Belgium with the goal of enrolling, in each of six subgroups, an equal number of participants on the basis of sex and age (20–39, 40–59, and ≥ 60 years). All household members with a minimum age of 20 years were invited to participate in the study, pro-vided that the quotas for their groups in terms of sex and age had not yet been fulfilled. From June 1996 to January 2004, recruitment of families continued, with the participants in the 1985–1990 sample as index persons, with the added inclusion of subjects under 20 years of age. The participa-tion rate at enrolment was 65.0%.12 From November 2007 to
January 2012, we reinvited former participants to a follow-up examination at our field center, which included imaging of their retinal microvessels. We obtained written informed consent from 662 of the participants in the earlier study (a rate of 75.3%). We excluded 132 singletons (unrelated par-ticipants), and 117 participants in the earlier study because of poor-quality retinal images (n = 113), missing informa-tion on covariates (n = 1), or outlying data points exceeding 3 SD from the mean (n = 3). Our final analyses represented 413 participants.
clinical and biochemical measurements
For at least 3 hours before the retinal examination for the study, the participants refrained from heavy exercise, smok-ing, and intake of alcohol and caffeine-containing bever-ages. Trained nurses measured the subjects’ anthropometric characteristics and blood pressure (BP). Body mass index (BMI) was calculated as the subject’s weight in kilograms divided by the square of the subject’s height in meters. The nurses also administered a questionnaire designed to collect information about each participant’s recent medical history, smoking and drinking habits, and intake of medications.
Each subject’s BP was recorded as the average of five con-secutive readings taken after the subjects had rested in the sitting position for at least 5 minutes. Hypertension was defined as a BP of at least 140 mm Hg systolic or 90 mm Hg diastolic or the use of antihypertensive medication or both. Mean arterial pressure (MAP) was calculated as the diastolic BP (DBP) plus one third of the difference between the systolic BP and DBP. On the day of the retinal examin-ation, with the subjects fasting for at least 8 hours, venous blood samples were drawn. Using standardized automated methods, we measured plasma glucose and serum total and high-density lipoprotein (HDL) cholesterol. We computed the Homeostasis Model Assessment-insulin resistance index (HOMA-IR) as the fasting serum insulin tion multiplied by the fasting plasma glucose concentra-tion with the product divided by 22.5. Diabetes mellitus was defined as a fasting plasma glucose concentration of
6.99 mmol/l (126 mg/dl) or more or the use of antidiabetic medication.
Microvascular phenotyping
We phenotyped the subject’s retinal arterioles and venules as previously described.13 To dilate the pupil, retinal
imag-ing was done in a dimly lit examination room after the sub-jects had accommodated to darkness for at least 5 minutes. Trained observers made photographs of each eye of each sub-ject with a Canon Cr-DGi nonmydriatic retinal visualization system combined with a Canon D-50 digital camera (Canon, Kyoto, Japan). After converting JPEG to TIFF images, using the Phatch (http://photobatch.stani.be/) photographic and digital graphics processing system, two trained observers identified individual retinal arterioles and venules in each image, using the validated, computer-assisted IVAN pro-gram (Vasculo-matic ala Nicola, version 1.1, Department of Ophthalmology and Visual Science, University of Wisconsin–Madison, Madison, WI).14 This software
sys-tem combines individual measurements of retinal blood vessels into the CRAE and the CRVE, which are summary indexes based on formulas developed by Parr and Spears,15
Hubbard,16 and Knudtson.17 The arteriole-to-venule ratio
(AVR) is calculated as the CRAE divided by the CRVE. The intraclass correlation coefficients of CRAE, CRVE, and AVR were 0.81, 0.63 and 0.70 for observer 1, respectively, and 0.69, 0.71, and 0.70 for observer 2. The reproducibilities of CRAE, CRVE, and AVR were 13.2%, 8.4%, and 9.0%, respectively, for observer 1, and 10.3%, 10.8%, and 16.2, respectively, for observer 2.17 The interobserver reproducibilities of CRAE,
CRVE, and AVR were 10.8%, 9.9% and 14.6%, respectively.18 statistical analysis
For management of the study database and statistical anal-ysis, we used SAS software version 9.2 (SAS Institute, Cary, NC). We applied a logarithmic transformation to normalize the distributions of insulin and insulin resistance determined with the HOMA index. The central tendency and spread of the distributions were presented as the arithmetic mean (±SD) or geometric mean (interquartile range). We com-pared means and proportions through the use of Student’s
t-test and the chi-squared test, respectively. Our statistical
methods also included single and multiple linear regres-sions. We searched for possible covariates of the arterial phe-notypes through a stepwise regression procedure with the
P-values for independent variables to enter and to stay in the
model set at 0.15. As covariates we considered sex, age, BMI, MAP, the ratio of HDL to total cholesterol, the HOMA-IR, and design variables (0, 1), coding for current smoking, alco-hol intake, and the use of various classes of antihypertensive drugs (diuretics, beta-blockers, vasodilators, and inhibitors of the renin–angiotensin–aldosterone system). To estimate heritability and to calculate the intrafamilial and genetic and environmental correlations of the retinal vascular measures examined in the study, we used the 2012 Statistical Analysis for Genetic Epidemiology (S.A.G.E.) software pack-age, release 6.2 (http://darwin.cwru.edu/) (S.A.G.E., Case
Western Reserve University, Cleveland, OH). We applied the ASSOC and the FCOR procedures of S.A.G.E. software to respectively assess heritability and intrafamilial corre-lations in the narrow sense. We estimated heritability by assuming multivariate normality after a simultaneously esti-mated power transformation. The ASSOC procedure of the S.A.G.E. software uses a multiple linear regression model in which the residual variance is partitioned into the sum of an additive polygenic component, a sibling component, and an individual-specific random component. The FCOR pro-cedure estimates familial correlations and their asymptotic standard errors via the Pearson product-moment method. Heritability (h2) was estimated as the polygenic component
divided by the total residual variance.
We calculated the genetic and environmental correlations between CRAE and CRVE with adjustments applied for covariates. With the assumption of a lack of dominance vari-ance and no interaction between the genetic and environ-mental variance components, the variance of a trait is given by: V = G + E, where G is the additive polygenic component and E is the environmental component. The total phenotypic correlation between two traits (ρP) can be partitioned into a genetic (ρG) and an environmental (ρE) component given by the equation:
ρP = ρG√h12h22 + ρE√(1 – h12)(1 – h22)
where h12 and h22 represent the heritability of the two traits,
and ρG and ρE are the genetic and environmental correla-tions, respectively. The significance of ρG and ρE suggests the influence of shared genes and shared environmental fac-tors on two traits.19 We compared ρG and ρE using Fisher’s
Z transformation.
results
characteristics of study participants
Our study sample included 413 subjects from 70 com-plex pedigrees with sizes ranging from 2 to 37 individuals and encompassing from 1 to 3 generations. Table 1 lists the characteristics of the study participants by generation. Compared with the first generation, the second generation more frequently reported drinking but less frequently used antihypertensive drugs. As compared with the second gener-ation, the third generation had lower values of BMI, BP, and total cholesterol, but had a higher HDL-to-total cholesterol ratio, less frequently reported drinking alcohol. and had a lower prevalence of hypertension.
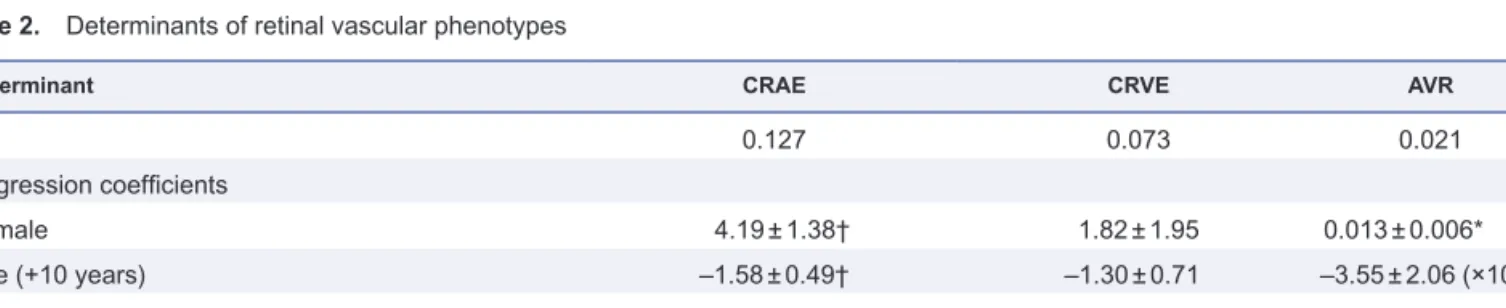
determinants of retinal microvascular phenotypes
In our stepwise regression analysis (Table 2), the covari-ates considered for entry into the model were sex, age, BMI, MAP, HDL-to-total cholesterol ratio, HOMA-IR value, smoking, drinking of alcohol, and antihypertensive drug treatment. Sex and age were forced into the model. The CRAE was larger in women than in men and in smokers than in nonsmokers, and was inversely and independently associated with age and MAP. The same tendencies were
observed for CRVE. The AVR was higher in women than in men and tended to decrease with age. The amount of vari-ance explained ranged from 2.1% to 12.7%.
heritability, genetic, and environmental correlation
We estimated the h2 of retinal-vessel diameters, using
incremental adjustments. Our model 1 included sex and age as covariates; model 2 was additionally adjusted for MAP; model 3 also included current smoking; and model 4 additionally accounted for antihypertensive drug treat-ment. The heritability estimates for CRAE, CRVE, and AVR were significant (h2 ≥ 0.213; P ≤ 0.044) with the
excep-tion of that for CRAE in model 1 (h2 ≥ 0.201; P = 0.064).
The heritability estimates ranged from 0.201 to 0.252 for CRAE, from 0.281 to 0.339 for CRVE, and from 0.272 to 0.310 for AVR. The heritability estimates for body height and weight, computed as a reference, were 0.389 and 0.492, respectively, and 0.754 and 0.531 when adjusted for sex and age (Table 3). The total adjusted phenotypic correla-tion (ρP) of CRAE with CRVE was significant (ρP = 0.490;
P < 0.001; Figure 1), and we therefore partitioned it into a genetic (ρG) and an environmental (ρE) component. The genetic correlation was significant (ρG = 0.360, P < 0.001), although weaker (P = 0.0008) than the environmental cor-relation (ρE = 0.545, P < 0.001).
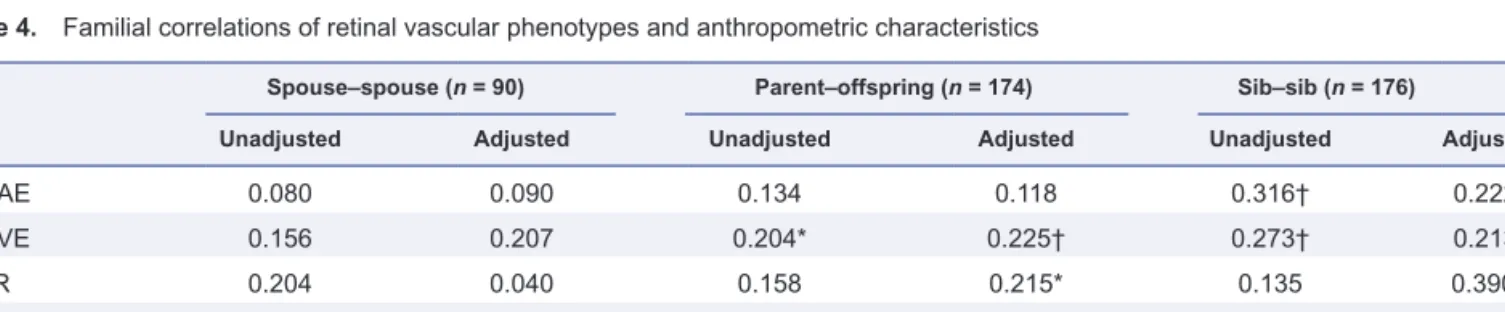
Familial correlation
With adjustment applied as in Table 3, the sib–sib corre-lations (n = 176) ranged from 0.213 to 0.390 (P ≤ 0.015) for the retinal phenotypes, and were 0.441 (P = 0.0001) and 0.391 (P = 0.0003) for body height and weight, respectively (Table 4). The adjusted parent–offspring correlations (n = 174) were significant for CRVE (r = 0.225; P = 0.009), AVR (r = 0.215;
P = 0.0154), body height (r = 0.397; P < 0.0001), and weight
(r = 0.325; P = 0.013).
discussion
In the family-based population study described here, we observed a moderate but significant heritability of retinal microvascular phenotypes. The sib–sib correlations were significant for all of the phenotypes that we assessed, but the parent–offspring correlations were significant only for CRVE and AVR, and not for CRAE. One possible interpre-tation of these findings is that all retinal microvascular phe-notypes are genetically determined, and that the influence of environmental factors is stronger for CRAE than for CRVE. Our study adds to the existing literature because: (i) in con-trast to twin studies,6,9,10 our participants represented an
unbiasedm randomly recruited population sample; (ii) we estimated both heritability and intrafamilial correlations in the same study participants,6,9–11 (iii) in contrast to previous
studies,6,10,11 we partitioned the total phenotypic correlation
between CRAE and CRVE into genetic and environmental components; (iv) our analyses were more comprehensively adjusted than those in other studies6,9–11; and (v) we used a
Table 2. Determinants of retinal vascular phenotypes
Determinant CRAE CRVE AVR
R2 0.127 0.073 0.021
Regression coefficients
Female 4.19 ± 1.38† 1.82 ± 1.95 0.013 ± 0.006*
Age (+10 years) –1.58 ± 0.49† –1.30 ± 0.71 –3.55 ± 2.06 (×10–2)
Mean arterial pressure (+10 mm Hg) –2.63 ± 0.66‡ –1.92 ± 0.93* …
Smoker 3.82 ± 1.61* 8.39 ± 2.27‡ …
*P < 0.05; †P < 0.01; ‡P < 0.001
Abbrevaitions: AVR, arteriole-to-venule ratio; CRAE, central retinal arteriole equivalent; CRVE, central retinal venule equivalent.
The covariables considered for entry into the model were sex, age, body mass index, mean arterial pressure, ratio of high-density lipid cho-lesterol to total chocho-lesterol, Homeostasis Assessment Model-insulin resistance, smoking and drinking, and antihypertensive drug treatment. Sex and age were forced into the models.
Table 1. Characteristics of study participants
Characteristic Generation 1 Generation 2 Generation 3
Number 142 85 186
Arithmetic mean (± SD)
Age, years) 62.1 ± 9.3 54.2 ± 8.8‡ 42.2 ± 14.9‡
Body mass index, kg/m2 27.7 ± 4.5 27.2 ± 3.9 25.5 ± 4.2†
Systolic blood pressure, mm Hg 131.5 ± 17.1 127.8 ± 16.2 122.3 ± 13.8†
Diastolic blood pressure, mm Hg 81.5 ± 9.0 81.8 ± 10.7 77.2 ± 11.1†
Mean arterial pressure, mm Hg 98.2 ± 10.2 97.2 ± 11.7 92.2 ± 11.0‡
Total cholesterol, mmol/l 5.42 ± 0.87 5.39 ± 0.91 4.96 ± 0.88‡
HDL cholesterol, mmol/l 1.43 ± 0.36 1.43 ± 0.35 1.42 ± 0.32
Ratio of HDL-to-total cholesterol 0.267 ± 0.066 0.270 ± 0.076 0.293 ± 0.074*
Plasma glucose, mmol/l 5.06 ± 0.62 5.06 ± 0.91 4.92 ± 0.90
Central retinal arteriole equivalent, μm 151.4 ± 15.9 152.9 ± 13.0 153.8 ± 14.7
Central retinal venule equivalent, μm 215.3 ± 20.4 220.1 ± 20.6 219.0 ± 19.8
Arteriole-to-venule ratio 0.706 ± 0.069 0.698 ± 0.060 0.705 ± 0.060
Geometric mean, 95% IQR
Insulin, mU/l 5 (3 to 9) 6 (4 to 10) 5 (3 to 9)
HOMA insulin resistance 1.21 (0.69 to 1.89) 1.18 (0.77 to 2.29) 1.11 (0.64 to 2.06) Subjects with characteristic, n (%)
Current smoking 37 (26.1) 20 (23.5) 41 (22.0)
Drinking alcohol 41 (28.9) 38 (44.7)* 60 (32.3)*
Hypertension 52 (36.6) 23 (27.1) 27 (14.5)*
Diabetes 1 (0.70) 0 1 (0.54)
Antihypertensive drug treatment 37 (26.1) 7 (8.2)‡ 13 (7.0)
Diuretics 16 (11.3) 5 (5.9) 3 (1.6)
Beta-blockers 27 (19.0) 4 (4.7)† 11 (5.9)
Vasodilators 6 (4.2) 3 (3.5) 0*
RAAS inhibitors 8 (5.6) 0* 1 (0.54)
*P < 0.05; †P < 0.01; ‡P < 0.001, significance of difference between generations.
Hypertension was defined as a blood pressure ≥ 140 mm Hg systolic or ≥ 90 mm Hg diastolic, or the use of antihypertensive drugs. Diabetes was defined as a fasting plasma glucose concentration ≥ 6.99 mmol/l or the use of antidiabetic drugs. Vasodilators included calcium antagonists and alpha-blockers. Renin–angiotensin–aldosterone system inhibitors included converting enzyme inhibitors and angiotensin II receptor blockers.
Abbreviations: HDL, high-density lipoprotein; HOMA, Homeostasis Assessment Model; IQR, interquartile range; RAAS, renin-angiotensin-aldosterone system.
Figure 1. Genetic and environmental correlations between central retinal arteriolar equivalent (CRAE) and central retinal venular equivalent (CRVE).
Correlation coefficients were adjusted as in model 4 (Table 3). Abbreviations: ρP, total phenotypic correlation; ρG, genetic correlation; ρE, environmental correlation. Values on ordinate are correlation coefficients (95% confidence interval).
Table 3. Heritability of retinal vascular phenotypes and anthropometric characteristics
Unadjusted Model 1 Model2 Model 3 Model 4
h2 ± SE P value h2 ± SE P value h2 ± SE P value h2 ± SE P value h2 ± SE P value
CRAE 0.252 ± 0.137 0.033 0.201 ± 0.132 0.064 0.214 ± 0.124 0.042 0.213 ± 0.125 0.044 0.214 ± 0.124 0.043 CRVE 0.281 ± 0.159 0.038 0.300 ± 0.147 0.021 0.309 ± 0.145 0.017 0.339 ± 0.146 0.010 0.337 ± 0.144 0.010 AVR 0.310 ± 0.105 0.002 0.273 ± 0.106 0.005 0.273 ± 0.105 0.005 0.272 ± 0.104 0.004 0.274 ± 0.102 0.004
Body height 0.389 ± 0.154 0.006 0.754 ± 0.104 < 0.0001 … … … …
Body weight 0.492 ± 0.124 < 0.0001 0.531 ± 0.112 < 0.0001 … … … …
All models were adjusted for sex and age. Models 2, 3, and 4 were additionally adjusted respectively for mean arterial pressure, mean arterial pressure plus current smoking, mean arterial pressure plus smoking, and antihypertensive drug treatment.
Abbreviations: AVR, arteriole-to-venule ratio; CRAE, central retinal arteriole equivalent; CRVE, central retinal venule equivalent.
Table 4. Familial correlations of retinal vascular phenotypes and anthropometric characteristics
Spouse–spouse (n = 90) Parent–offspring (n = 174) Sib–sib (n = 176)
Unadjusted Adjusted Unadjusted Adjusted Unadjusted Adjusted
CRAE 0.080 0.090 0.134 0.118 0.316† 0.222* CRVE 0.156 0.207 0.204* 0.225† 0.273† 0.213* AVR 0.204 0.040 0.158 0.215* 0.135 0.390‡ Body height 0.188 0.064 0.301† 0.397‡ 0.278† 0.441‡ Body weight 0.270† 0.129 0.261 0.325* 0.127 0.391‡ *P < 0.05; †P < 0.01; ‡P < 0.001.
All adjustments include sex and age, and for retinal phenotypes also include mean arterial pressure, smoking, and use pf antihypertensive drugs. Abbreviations: AVR, arteriole-to-venule ratio; CRAE, central retinal arteriole equivalent; CRVE, central retinal venule equivalent.
In keeping with other studies, 6,9–11 we noticed that CRAE
tended to have a lower heritability than CRVE. In a genome-wide association study, Ikram and colleagues observed asso-ciations of CRVE with four loci (19q13, 6q24, 12q24, and 5q14), whereas none of the associations for CRAE reached genome-wide significance. Ikram et al. speculated that the genetic influence on CRAE might be attenuated because of the overriding effects of age and BP on the retinal micro-vasculature. The Australian Twins Eye Study involved 374 monozygotic and 536 dizygotic twin pairs and 322 sib-lings.6 With adjustments applied for sex, age, and BMI,
but not BP, the heritability estimates for CRAE and CRVE in the Tasmanian study were 59.4% and 61.7% and 56.5% and 64.2% in the Brisbane study. A study in Copenhagen of the association of retinal arterial and venous diameter with the risk of cardiovascular disease involved 55 monozy-gotic and 18 dizymonozy-gotic, same-sex healthy twin pairs.10 The
Danish researchers adjusted for sex, age, smoking, choles-terol, and glucose tolerance in various combinations, but did not present analyses adjusted for all covariates in com-bination.10 Heritability estimates in the Danish study were
70% for CRAE and 83% for CRVE.10 As exemplified by our
current findings and the literature that we reviewed,6,9,10
her-itability estimates in twin studies are usually larger than in population surveys because of the use of different methods of statistical estimation20 or because twins may share a
com-mon environment to a greater extent than do members of complex pedigrees, and if so, a portion of the environmen-tal factors that twins share may be partitioned into genetic variance. Heritability estimates usually decrease with more comprehensive adjustment.
In the present study we also computed intrafamilial cor-relation coefficients. Simple product-moment corcor-relation coefficients can be used as a measure of the degree of con-cordance (positive correlations) or discon-cordance (negative correlations) of a trait between family members, as sug-gested in 1979 by the Framingham investigators.21 However,
these correlation coefficients do not eliminate the problem of using a particular individual’s data more than once, such as when correlating information between parents and off-spring or between sibs.
We found significant sib–sib correlations for CRAE, CRVE, and AVR. However, the parent–offspring correla-tions were significant only for CRVE and AVR. In the Beaver Dam Eye Study,11 with adjustment for sex, age, MAP, and
smoking, the sib–sib correlations for CRAE, CRVE, and AVR were 0.20, 0.23 and 0.12, respectively. The correspond-ing parent–offsprcorrespond-ing correlations were 0.27, 0.24, and 0.16. Thus, in the Beaver Dam Eye Study,11 the parent–offspring
and sib–sib correlations were similar. However, the avuncu-lar correlations amounted to about half of the parent–off-spring correlations, and the cousin correlations were half of the avuncular correlations.11 As in the current study, none of
the spouse–spouse correlations in the Beaver Dam Eye Study was significant.11 The investigators in the study concluded
that the pattern of correlations that they observed was con-sistent with a genetic component for CRVE and AVR.11 In
their study, CRAE also showed some genetic component, but also seemed to be influenced by environmental factorsm
as reflected by the similar avuncular and cousin correlations found in the study.11
We partitioned the total phenotypic correlation between CRAE and CRVE into a genetic and an environmental com-ponent. The correlations of the genetic and environmental components were 0.360 and 0.545, respectively. Host factors, such as age, MAP, and lifestyle, including smoking, might explain why the environmental correlation was greater than the genetic correlation. Fahy et al.9 estimated the genetic
and environmental correlations of CRAE with CRVE in 706 monozygotic and 757 dizygotic white female twins. They partitioned the covariance between CRAE and CRVE into additive genetic, common environmental, and unique envi-ronmental factors,9 and assumed that the correlation between
latent genetic factors was 1.0 in monozygotic twins and 0.5 in dizygotic twins. They found that 77% of the covariance between CRAE and CRVE was due to additive genetic fac-tors, with the remaining 23% attributable to unique environ-mental effects.9 Fahy et al. replicated these findings in 1981
in twins from the Australian Twins Eye Study.9 When
com-paring our results in the present study with those reported by Fahy et al., one should keep in mind that heritability esti-mates are usually higher in twins than in complex pedigrees recruited from populations,20 and that the methods used to
compute the genetic and environmental contributions in our study and the study by Fahy et al. were different.
Our study should be interpreted within the context of its potential limitations. First, our sample size was relatively small, especially in terms of the number of families that con-sisted of two or more generations. This might have explained the relatively low heritability of the retinal-vessel diameters found in our study. However, the heritability and intrafa-milial correlations of body height and weight in our study were comparable with those reported in previous popula-tion20,22,23 and twin24 studies, suggesting that our study was
adequately statistically powered. Moreover, EkstrØm et al. found that 200–400 individuals are generally sufficient to provide reasonably robust estimates of heritability as defined in our present study.25
Second, we did not prove the natural descent of the off-spring in our study. However, in a prior study based on the same population as in the present study,20 only two parent–
offspring relations had to removed, on the basis of Mendelian inconsistency in the ABO and Rhesus blood-type groups. These two parent–offspring pairs were not included in the current study. Third, we did not exclude participants being treated with antihypertensive drugs. However, adjustment for treatment and other covariates did not affect our results. Lastly, we did not adjust for refractive errors. However, pre-vious studies showed that correction for refraction did not materially alter estimates of heritability and intrafamilial correlations.11 Furthermore, refractive error might influence
CRAE and CRVE, but not AVR,26 which in the present study
showed significant heritability.
In conclusion, our findings in the study described here suggest that genetic factors influence the diameter of the ret-inal microvessels. Estimates of heritability of retret-inal micro-vascular phenotypes were little affected when BP was taken into account, suggesting that the genes involved might not
necessarily act through BP, in accord with the finding in sev-eral studies that retinal arteriolar narrowing may precede the development of hypertension,27–30 cardiovascular disease,31
and stroke.3 The significant genetic correlation between
arte-riolar and venular diameters suggests that these traits share some common genetic determinants. Genetic factors may also directly influence the structure and function of the reti-nal microvasculature.
acknowledgMents
The European Union, through grants IC15-CT98-0329-EPOGH, LSHM-CT-2006-037093-InGenious HyperCare, HEALTH-2007-2.1.1-2-HyperGenes, HEALTH-2011.2.4.2-2-EU-MASCARA; European Research Council Advanced Researcher Grant-2011-294713-EPLORE); the Fonds voor Wetenschappelijk Onderzoek Vlaanderen, Brussels, Belgium, through grants G.0734.09 and G.0881.13; and the Katholieke Universiteit Leuven, Leuven, Belgium, through grants OT/04/34 and OT/05/49 provided support to the Studies Coordinating Centre. Murielle Bochud is supported by the Swiss School of Public Health Plus (SSPH+).
disclosure
None of the co-authors of this study have conflicts of interest to report.
reFerences
1. Lindley RI, Multi-Centre Retinal Stroke Stduy Collaborative Group. Retinal microvascular signs: a key to understanding the underlying pathophysiology of different stroke subtypes? Int J Stroke 2008;3:297–305. 2. Wong TY, Klein R, Sharrett AR, Duncan BB, Couper DJ, Klein BEK,
Hubbard LD, Nieto FJ, for the Atherosclerosis Risk in Communities study. Retinal arteriolar diameter and risk for hypertension. Ann Intern
Med 2004;140:248–255.
3. Wong TY, Klein R, Couper DJ, Cooper LS, Shahar E, Hubbard LD, Wofford MR, Sharrett AR. Retinal microvascular abnormalities and incident stroke: the Atherosclerosis Risk in Communities Study. Lancet 2001;358:1134–1140.
4. Wong TY, Klein R, Nieto FJ, Klein BEK, Sharrett AR, Meuer SM, Hubbard LD, Tielsch JM. Retinal microvascular abnormalities and 10-year cardiovascular mortality. A population-based case-control study. Ophthalmology 2003;110:933–940.
5. Xing C, Klein BEK, Klein R, Jun G, Lee KE, Iyengar SK. Genome-wide linkage study of retinal vessel diameters in the Beaver Dam Eye study.
Hypertension 2006;47:797–802.
6. Sun C, Zhu G, Wong TY, Hewitt W, Ruddle JB, Hodgson L, Montgomery GW, Young TL, Hammond CJ, Craig JE, Martin NG, He M, Mackey DA. Quantitative genetic analysis of the retinal vascular caliber: the Australian Twins Eye Study. Hypertension 2009;54:788–795.
7. Cheng CY, Reich D, Wong TY, Klein R, Klein BEK, Patterson N, Tandon A, Li M, Boerwinkle E, Sharrett AR, Kao WH. Admixture mapping scans identify a locus affecting retinal vascular caliber in hypertensive African Americans: the Atherosclerosis Risk in Communities (ARIC) Study. PLoS Genet 2010;6:e1000909.
8. Ikram MK, Sim X, Jensen RA, Cotch MF, Hewitt AW, Ikram MA, Wang JJ, Klein R, KLein BE, Breteler MM, Cheung N, Liew G, Mitchell P, Uitterlinden AG, Rivadeneira F, Hofman A, de Jong PT, van Duijn CM,
Kao L, Cheng CY, Smith AV, Glazer NL, Lumley T, McKnight B, Psaty BM, Jonasson F, Eiriksdottir G, Aspelund T, Global BPgen Consortium, Harris TB, Launer LJ, Taylor KD, Li X, lyengar SK, Xi Q, Sivakumaran TA, Mackey DA, Macgregor S, Martin NG, Young TL, Bis JC, Wiggins KL, Heckbert SR, Hammond CJ, Andrew T, Fahy S, Attia J, Holliday EG, Scott RJ, Islam FM, Rotter JI, McAuley AK, Boerwinkle E, Tai ES, Gudnason V, Siscovick DS, Vingerling JR, Wong TY. Four novel loci (19q13, 6q24, 12q24, and 5q14) influence the microcirculation in vivo.
PLoS Genet 2010;6:e1001184.
9. Fahy SJ, Sun C, Zhu G, Healey PR, Spector TD, Martin NG, Mitchell P, Wong TY, Mackey DA, Hammond CJ, Andrew T. The relationship between retinal arteriolar and venular calibers is genetically medi-ated, and each is associated with risk of cardiovascular disease. Invest
Ophthalmol Vis Sci 2011;23:975–981.
10. Taarnhøj NCBB, Larsen M, Sander B, Kyvik KO, Kessel LO, Hougaard JL, Sørensen TIA. Heritability of retinal vessel diameters and blood pressure: a twin study. Invest Ophthalmol Vis Sci 2006; 47:3539–3544. 11. Lee KE, Klein BEK, Klein R, Knudtson MD. Familial aggregation of
retinal vessel caliber in the Beaver Dam Eye study. Invest Ophthalmol
Vis Sci 2004;45:3929–3933.
12. Staessen JA, Wang JG, Brand E, Barlassina C, Birkenhager WH, Hermann SM, Fagard R, Tizzoni L, Bianchi G. Effects of three candi-date genes on prevalence and incidence of hypertension in a Caucasian population. J Hypertens 2001;19:1349–1358.
13. Liu YP, Kuznetsova T, Thijs L, Jin Y, Schmitz B, Brand SM, Brand E, Manunta P, Bianchi G, Struijker-Boudier HA, Staessen JA. Are retinal microvascular phenotypes associated with the 1675G/A polymorphism in the angiotensin II type-2 receptor gene? Am J Hypertens 2011;24:1300–1305.
14. Sherry LM, Wang JJ, Rochtchina E, Wong T, Klein R, Hubbard L, Mitchell P. Reliability of computer-assisted retinal vessel measurement in a population. Clin Exp Ophthalmol 2002;30:179–182.
15. Parr JC, Spears GF. General caliber of the retinal arteries expressed as the equivalent width of the central retinal artery. Am J Ophthalmol 1974;77:472–477.
16. Hubbard LD, Brothers RJ, King WN, Clegg LX, Klein R, Cooper LS, Sharrett AR, Davis MD, Cai J. Methods for evaluation of retinal microvascular abnormalities associated with hypertension/scler-osis in the Atherosclerhypertension/scler-osis Risk in Communities Study. Ophtalmology 1999;106:2269–2280.
17. Knudtson MD, Lee KE, Hubbard LD, Wong TY, Klein R, Klein BEK. Revised formulas for summarizing retinal vessel diameters. Curr Eye
Res 2003;27:143–149.
18. Liu YP, Richart T, Jin Y, Struijker-Boudier HA. Retinal arteriolar and venular phenotypes in a Flemish population: reproducibility and cor-relates. Artery Res 2011;5:72–79.
19. Freeman MS, Mansfield MW, Barrett JH, Grant PJ. Insulin resistance: an atherothrombotic syndrome. Thromb Haemost 2003; 89:161–168. 20. Jin Y, Kuznetsova T, Bochud M, Richart T, Thijs L, Cusi D, Fagard R,
Staessen JA. Heritability of left ventricular structure and function in Caucasian families. Eur J Echocardiogr 2011;12:326–332.
21. Havlik RJ, Garrison RJ, Feinleib M, Kannel WB, Castelli WP, McNamara PM. Blood pressure aggregation in families. Am J Epidemiol 2012;110:304–312.
22. Staessen J, Bulpitt CJ, Fagard R, Joossens JV, Lijnen P, Amery A. Familial aggregation of blood pressure, anthropometric characteristics and urinary excretion of sodium and potassium—a population study in two Belgian towns. J Chron Dis 1985; 38:397–407.
23. Seidlerová J, Bochud M, Staessen JA, Cwynar M, Dolejsová M, Kuznetsova T, Nawrot T, Olszanecka A, Stolarz K, Thijs L, Wojciechowska W, Struijker-Boudier HA, Kawecka-Jaszcz K, Elston RC, Fagard R, Filipovský J; EPOGH investigators. Heritability and intrafamilial aggregation of arterial characteristics.
J Hypertens 2008; 26:721–728.
24. Silventoinen K, Sammalisto S, Perola M, Boomsma DI, Cornes BK, Davis C, De Lange M, Harris JR, Hjelmborg JV, Luciano M, Martin NG, Mortensen J, Nisticò L, Pedersen NL, Skytthe A, Spector TD, Stazi MA, Willemsen G. Heritability of adult body height: a comparative study of twin cohorts in eight countries. Twin Res 2003;6:399–408.
25. EkstrØm CT. The impact of pedigree structure on heritability esti-mates. Hum Hered 2009;68:243–251.
26. Wong TY, Knudtson MD, Klein R, Klein BEK, Meuer SM, Hubbard LD. Computer- assisted measurement of retinal vessel diameters
in the Beaver Dam Eye study. Methodology, correlation between eyes, and effect of refractive errors. Ophthalmology 2004;111: 1183–1190.
27. Sharrett AR, Hubbard LD, Cooper LS, Sorlie PD, Brothers RJ, Nieto FJ, Pinsky JL, Klein R. Retinal arteriolar diameters and elevated blood pres-sure: the Atherosclerosis Risk in Communities Study. Am J Epidemiol 1999;150:263–270.
28. Wong TY, Hubbard LD, Klein R, Marino EK, Kronmal R, Sharrett AR, Siscovick DS, Burke G, Tielsch JM. Retinal microvascular abnor-malities and blood pressure in older people: the Cardiovascular Health study. Br J Ophthalmol 2002;86:1007–1013.
29. Leung H, Wang JJ, Rochtchina E, Tan AG, Wong TY, Klein R, Hubbard LD, Mitchell P. Relationship between age, blood pressure, and retinal vessel diameters in an older population. Invest Ophthalmol Vis Sci 2003; 44:2900–2904.
30. Wong TY, Klein R, Klein BEK, Meuer SM, Hubbard LD. Retinal ves-sel diameters and their associations with age and blood pressure. Invest
Ophthalmol Vis Sci 2003; 44:4644–4650.
31. Wong TY, Klein R, Sharrett AR, Duncan BB, Couper DJ, Tielsch JM, Klein BEK, Hubbard LD. Retinal ateriolar narrowing and risk of cor-onary heart disease in men and women. The Atherosclerosis Risk in Communities study. JAMA 2002;287:1153–1159.