Introduction
Functional appliances, commonly used in the correction of sagittal discrepancies in Class II division 1 malocclusion children, appear to bring about sagittal intermaxillary changes mainly by acting on the mandible (Antonarakis and Kiliaridis, 2007). Studies suggest however that these changes are, on average, not very large, and not very predictable, with large inter-individual variation (Tulloch
et al., 1990). This is identified by observing the small mean changes and large standard deviations (SDs) obtained in studies of Class II treatment with functional appliances (Antonarakis and Kiliaridis, 2007). One factor that may in part explain inter-individual differences may be the masticatory musculature and its functional capacity. In view of the fact that masticatory muscle capacity varies significantly between growing individuals, as measured by bite force, it has been speculated that the considerable variability seen in individual response to functional appliance treatment is possibly in relation to both the magnitude and the direction of forces and may be directly related to the individual’s muscular and soft tissue characteristics (Kiliaridis, 1998).
Predictive value of molar bite force on Class II functional
appliance treatment outcomes
G. S. Antonarakis*
,**, H. Kjellberg** and S. Kiliaridis*
Departments of Orthodontics, *Dental School, University of Geneva, Switzerland and **Institute of Odontology, The Sahlgrenska Academy at the University of Gothenburg, Sweden
Correspondence to: Gregory S. Antonarakis, Department of Orthodontics, Dental School, University of Geneva, 19
rue Barthélemy-Menn, 1205 Geneva, Switzerland. E-mail: [email protected]
SUMMARY Sagittal intermaxillary changes brought about by functional appliances show large inter-individual variation. One factor that may in part explain these differences is the masticatory musculature and its functional capacity. The aims of this study were to investigate changes in maximal molar bite force during functional appliance treatment and to assess the influence of pre-treatment maximal molar bite force on treatment outcomes with functional appliances used in Class II malocclusion children.
Twenty-five children (17 males and 8 females), aged 9–13 years, with a Class II malocclusion and increased overjet were treated with functional appliances for 1–2 years. Dental casts, lateral cephalograms, maximal molar bite force, and finger force measurements were performed before (T1) and after (T2) treatment. These same measurements were also performed 1–2 years before treatment (T0); the intermediate period before starting treatment served as the control. Multiple regression analyses were used to determine possible correlations between initial maximal molar bite force and dental or cephalometric changes during treatment.
Maximal molar bite force, which increased pre-treatment (T0–T1), decreased during functional appliance treatment (T1–T2). Children with a weaker T1 maximal molar bite force showed a larger overjet reduction, greater improvement in molar relationship, greater reduction in ANB angle, and greater augmentation in SNB angle from T1 to T2.
Treatment of children with Class II malocclusions with functional appliances seems to lead to more favourable treatment outcomes in those with a weaker maximal molar bite force. This was observed both as regards improvements in dental sagittal relationships, namely overjet and molar Class, as well as skeletal changes due to a decrease in ANB and an increase in SNB angles.
Functional appliances act via a displacement of the mandible downwards and forwards, causing either a corresponding stretching of the orofacial soft tissues and muscles and/or a myotatic reflexes, i.e. active muscle contraction evoked by muscle stretching (Carels and van der Linden, 1987; Bishara and Ziaja, 1989; Aelbers and Dermaut, 1996; Dermaut and Aelbers, 1996). Thus, myotatic reflexes in combination with the viscoelastic properties of muscles may be responsible for the tension exerted on teeth and bony structures during treatment. This muscle action produces the desired orthodontic or orthopaedic force, directly or indirectly transmitted to the underlying dentoskeletal tissues, resulting in a correction of the malocclusion (Woodside, 1977). Thus, masticatory muscles may be an important functional factor in the treatment of skeletal discrepancies using functional appliances.
Several electromyographic studies have been carried out on muscle function during functional appliance treatment, but the results are sometimes contradictory. Sessle et al. (1990) found, in monkeys, an initial decrease in masseter muscle activity following appliance wear,
but this returned to pre-appliance levels after approximately 6 weeks. Miralles et al. (1988) on the other hand found similar electromyographic tonic activity with and without functional appliance wear in a cross-sectional study of children undergoing functional appliance therapy during a period of 3.5–42 months, which was in agreement with Thilander and Filipsson (1966) but in opposition to Ahlgren (1960) and Moss (1975), both showing an increase in tonic activity with functional appliance use.
Little knowledge exists concerning the influence of the characteristics of the masticatory musculature and bite force on the treatment effects with functional appliances, and inversely, the effect of functional appliance treatment on the masticatory musculature. The aim of this study was to investigate the changes in maximal molar bite force during treatment, as well as the value of pre-treatment maximal molar bite force as a predictive variable in determining treatment effects of functional appliances in Class II malocclusion children.
Subjects and methods
This study was approved by the Swedish Medical Research Council.
Subjects
Twenty-five children with a Class II division 1 malocclusion (17 males and 8 females), between the ages of 9.3 and 13.0 years (mean 10 years 6 months) at the start of the study, were chosen according to the following criteria: the presence of a skeletal Class II relationship (ANB more than 4 degrees), a retrognathic mandible (SNB less than or equal to 78 degrees), a distal molar relationship of at least one premolar width on one side and a half premolar width on the other side, an overjet greater than or equal to 6 mm, and no transverse discrepancies. None of the children showed signs of condylar lesions.
Treatment procedure and experimental design
The children were treated with an activator according to Schwarz (Graber and Neumann, 1977) by a single operator (HK) for a period of 1–2 years (mean 1.7 years, SD 0.5). Before (T1) and after (T2) treatment, maximal molar bite force measurements, finger force measurements, lateral cephalograms, and impressions for study models were taken. The bow activator according to Schwarz is a modification of the activator originally described by Andresen and Häupl (1945). The Schwarz bow activator is horizontally divided and the two parts are joined together with an elastic bow (0.9 mm blue elgiloy; Rocky Mountain Orthodontics, Denver, Colorado, USA), which allows transverse movements of the mandible. The mode
of action of the activator according to Schwarz is similar to that of the Andresen activator.
Controls
The control group comprised the same individuals as the treated subjects. The children were seen 1–2 years (mean 1.4 years, SD 0.2) prior to the commencement of treatment (T0) and observed for this time interval without any treatment being carried out. The same records were obtained at T0 as for T1 and T2. Therefore, the observation period T0–T1 served as the control for the same patients that underwent treatment from T1 to T2.
Cephalometry
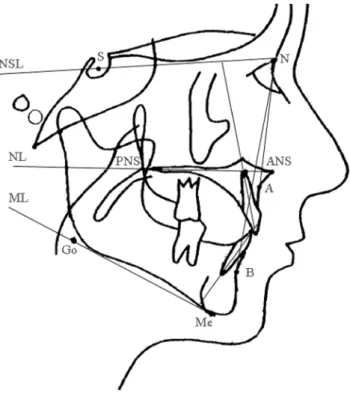
Lateral cephalograms were taken of all children in centric occlusion and with the head fixed in a cephalostat. The same machine was used for all children and the magnification adjusted to zero. The radiographs obtained were analysed by one operator (HK) using computerized cephalometric analysis (PC-DIG version 5.1 data system; Dr John McWilliam, Karolinska Institute, Stockholm, Sweden). The landmarks drawn on acetate sheets were digitized twice by the same operator on the same occasion. The mean values between the two measurements were used in the study. The reference points and lines used are shown in Figure 1. The superimposition of the lateral cephalograms was performed
Figure 1 Landmarks and reference lines used in the cephalometric
analysis. S, sella; N, nasion; ANS, anterior nasal spine; PNS, posterior nasal spine; A, cephlometric point A; B, cephalometric point B; Me, menton; Go, gonion; NSL, sella nasion line; NL, maxillary line; ML, mandibular line.
according to the structural method described by Björk and Skieller (1983).
Study casts
Study casts were taken to measure overjet, overbite, and molar relationships. The molar relationship was recorded as a percentage of the Angle Class II relationship, an Angle Class I relationship denoted by zero, and a full Angle Class II relationship denoted by 100 (Staudt and Kiliaridis, 2010).
Bite force
The maximum voluntary bite force (measured in Newtons) was determined using a bite force recorder (a metal bite fork with a plastic coating to prevent enamel chipping, connected to a strain gauge) as described by Helkimo et al. (1975), which was custom-made at the University of Gothenburg, Sweden. When the fork was loaded, the bite fore was recorded graphically (Speedomax recorder, Leeds and Northrup, London, UK). The thickness of the fork was 6.9 mm for the metal part and 4 mm for the plastic coating, which decreased slightly during biting. The subject was seated upright in a dental chair, and the bite fork was placed between the first molars on each side. The subject was instructed to bite as hard as possible and to maintain the force for as long as possible, without inflicting pain. All recordings were made twice in each position. In order to obtain as high bite force levels as possible, the subjects were encouraged to ‘do their best’. The highest value recorded was used as the maximum force level within the respective region. Maximal finger force was similarly recorded with the bite fork placed between the thumb and index fingers of both left and right hands and recorded twice for each hand. The higher of the two values was used for each child.
Statistics
All statistical analyses were performed using the Statistical Package for Social Sciences version 15.0 (SPSS Inc., Chicago, Illinois, USA). Cephalometric changes during T1–T0 as well as between T2–T1 were evaluated, and paired t-tests performed to assess the statistical significance of the changes between the control and treatment periods. Maximal molar bite force changes during treatment were similarly evaluated, and paired t-tests were used to assess statistical significance. Multiple linear regression analyses were used to determine possible correlations between initial maximal molar bite force and dental or cephalometric changes during treatment, including age, gender, and initial dental or cephalometric relationships as independent variables. The correlations were considered significant at P < 0.05.
Error of the method
The methodological error of maximal bite force measurements studied by repeated measurements of 20 randomly selected patients on two separate occasions, 2–4 weeks apart, using the formula of Dahlberg (1940) was found to be 69 N. The error of the method for the cephalometric variables was calculated by performing duplicate determinations on 15 randomly selected cephalometric radiographs, with a 2 week interval between the measurements, using Dahlberg’s formula. For linear measurements, the error of the method did not exceed 0.7 mm, and for angular measurements, this did not exceed 0.9 degrees except for the incisal angular measurements, where the error varied from 1.0 to 1.5 degrees.
Results
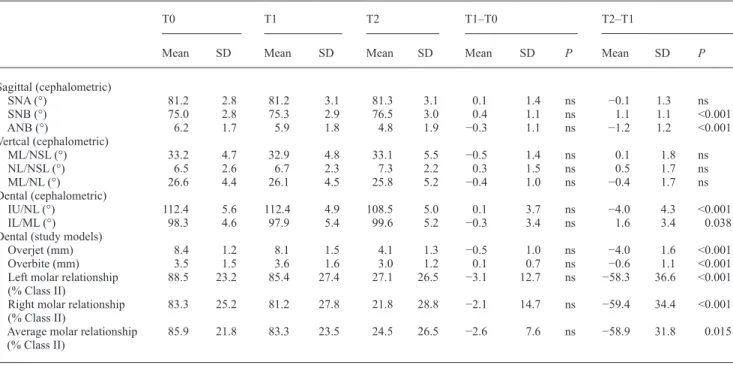
All treated children showed an improvement in their molar relationship and a decrease in overjet during the treatment period, as measured on study casts. Mean cephalomteric and dental values for the three time periods (T0, T1, and T2) are shown in Table 1, as well as the changes in the control (T1–T0) and treatment (T2–T1) periods and their respective statistical values. Mean maximal molar bite force values and finger force values are similarly shown in Table 2. Maximal molar bite force and finger force were seen to increase significantly during T0–T1, while from T1–T2, maximal molar bite force decreased significantly, while finger force continued to increase.
Multiple linear regression analyses showed significant correlations for changes in overjet, molar relationships, ANB, and SNB angles (Tables 3–6). A lower initial maximal molar bite force was associated with a larger overjet reduction and greater improvement in the molar relationship from Class II to Class I during treatment, as measured on the study casts. A lower initial maximal molar bite force was also associated with a greater reduction in ANB angle and a greater augmentation in SNB angle during treatment. When the other independent variables included in the multiple regression analyses were considered, a younger age seemed to be associated with a larger decrease in overjet and a larger change in ANB angle during treatment. As regards gender, males showed a greater increase in SNB angle. Finally, children with a larger overjet showed a larger decrease in overjet during treatment, while those with a more pronounced Class II molar relationship showed a greater change in molar relationship during treatment. Discussion
This investigation illustrates that treatment of individuals presenting a dental and skeletal Class II relationship with activators leads to a reduction in maximal molar bite force. In addition, pre-treatment bite force may influence treatment
Table 1 Mean and standard deviation (SD) of the cephalometric and dental characteristics of the patient sample, 1–2 years pre-treatment (T0), immediately before (T1), and after (T2) treatment.
T0 T1 T2 T1–T0 T2–T1
Mean SD Mean SD Mean SD Mean SD P Mean SD P
Sagittal (cephalometric) SNA (°) 81.2 2.8 81.2 3.1 81.3 3.1 0.1 1.4 ns −0.1 1.3 ns SNB (°) 75.0 2.8 75.3 2.9 76.5 3.0 0.4 1.1 ns 1.1 1.1 <0.001 ANB (°) 6.2 1.7 5.9 1.8 4.8 1.9 −0.3 1.1 ns −1.2 1.2 <0.001 Vertcal (cephalometric) ML/NSL (°) 33.2 4.7 32.9 4.8 33.1 5.5 −0.5 1.4 ns 0.1 1.8 ns NL/NSL (°) 6.5 2.6 6.7 2.3 7.3 2.2 0.3 1.5 ns 0.5 1.7 ns ML/NL (°) 26.6 4.4 26.1 4.5 25.8 5.2 −0.4 1.0 ns −0.4 1.7 ns Dental (cephalometric) IU/NL (°) 112.4 5.6 112.4 4.9 108.5 5.0 0.1 3.7 ns −4.0 4.3 <0.001 IL/ML (°) 98.3 4.6 97.9 5.4 99.6 5.2 −0.3 3.4 ns 1.6 3.4 0.038
Dental (study models)
Overjet (mm) 8.4 1.2 8.1 1.5 4.1 1.3 −0.5 1.0 ns −4.0 1.6 <0.001
Overbite (mm) 3.5 1.5 3.6 1.6 3.0 1.2 0.1 0.7 ns −0.6 1.1 <0.001
Left molar relationship
(% Class II) 88.5 23.2 85.4 27.4 27.1 26.5 −3.1 12.7 ns −58.3 36.6 <0.001 Right molar relationship
(% Class II) 83.3 25.2 81.2 27.8 21.8 28.8 −2.1 14.7 ns −59.4 34.4 <0.001 Average molar relationship
(% Class II) 85.9 21.8 83.3 23.5 24.5 26.5 −2.6 7.6 ns −58.9 31.8 0.015
ns, not significant. P < 0.05 denotes statistical significance.
Table 2 Mean and standard deviation (SD) of the maximal bite and finger force characteristics of the patient sample, 1–2 years pre-treatment (T0), immediately before (T1), and after (T2) pre-treatment.
T0 T1 T2 T1–T0 T2–T1
Mean SD Mean SD Mean SD Mean SD P Mean SD P
Maximal molar bite force (N) 478.8 121.8 532.0 124.9 497.8 101.6 53.2 99.4 0.017 −34.2 78.4 0.039 Finger force (N) 38.8 10.5 47.1 13.9 60.0 17.4 8.3 15.8 0.014 12.9 18.6 0.002
Table 3 Multiple regression analysis to test the correlations between initial maximal molar bite force and change in overjet during treatment. Multiple regression analysis: Y = b0 + b1age +
b2gender + b3maximal molar bite force + b4overjet; dependent
variable (Y): change in overjet during treatment (T2-T1); independent variables: age at T1 (y), gender (1 = male and 2 = female), maximal molar bite force at T1 (N), overjet at T1 (mm).
Variables Coefficient beta Significance
Age (T1) 0.780 0.030
Gender −0.388 0.392
Maximal molar bite force (T1) 0.005 0.005
Overjet (T1) −0.419 0.020
b0, constant; b1, b2, and b3, regression coefficients; R, correlation coef-ficient; R2, percentage of explained variance.
b0 = −12.774.
Significance of the model: R = 0.84, R2 = 71 per cent, P < 0.001.
Table 4 Multiple regression analysis to test the correlation between initial maximal molar bite force and change in molar relationship during treatment. Multiple regression analysis: Y = b0 +
b1age + b2gender + b3maximal molar bite force + b4molar
relationship; dependent variable (Y): change in molar relationship during treatment (T2-T1); independent variables: age at T1 (y), gender (1 = male and 2 = female), maximal molar bite force at T1 (N), molar relationship at T1 (mm).
Variables Coefficient Beta Significance
Age (T1) 9.898 0.118
Gender −9.245 0.414
Maximal molar bite force (T1) 0.077 0.045 Molar Relationship (T1) −0.950 <0.001 b0, constant; b1, b2, and b3, regression coefficients; R, correlation coef-ficient; R2, percentage of explained variance.
b0 = −113.554.
outcome. Namely, those with a weaker bite force showed a greater change in overjet and molar relationship from Class II to Class I, and in ANB and SNB angles. These findings may explain some of the variation in results seen when functional appliances are used in a Class II malocclusion population.
Maximal molar bite force in Class II malocclusion children treated with an activator, as demonstrated in this investigation, decreased from T1 to T2. This is in contrast to the findings during T0–T1, where an increase in maximal molar bite force was seen. This increase in maximal molar bite force with age seen in the control period, is in all probability the result of normal growth, and may be associated with a general increase in muscle force. As regards general muscular force in the rest of the body, evaluated in this investigation by measuring finger force, it can be appreciated that this increases with age, both during the control and treatment period. Bite force measurements are associated with a large error of the method, which may obscure existing true differences by increasing the variation
Table 5 Multiple regression analysis to test the correlation between initial maximal molar bite force and change in ANB angle during treatment. Multiple regression analysis: Y = b0 + b1age +
b2gender + b3maximal molar bite force; dependent variable (Y):
change in the ANB angle during treatment (T2-T1); independent variables: age at T1 (y), gender (1 = male and 2 = female), maximal molar bite force at T1 (N).
Variables Coefficient Beta Significance
Age (T1) 0.820 0.030
Gender 1.021 0.058
Maximal molar bite force (T1) 0.002 0.042 b0, constant; b1, b2, and b3, regression coefficients; R, correlation coef-ficient; R2, percentage of explained variance.
b0 = −13.166.
Significance of the model: R = 0.59, R2 = 35 per cent, P = 0.039.
Table 6 Multiple regression analysis to test the correlation between initial maximal molar bite force and change in SNB angle during treatment. Multiple regression analysis: Y = b0 +
b1age + b2gender + b3maximal molar bite force; dependent
variable (Y): change in the SNB angle during treatment (T2-T1), independent variables: age at T1 (y), gender (1 = male and 2 = female), maximal molar bite force at T1 (N).
Variables Coefficient Beta Significance
Age (T1) −0.628 0.074
Gender −1.045 0.043
Maximal molar bite force (T1) −0.004 0.041 b0, constant; b1, b2, and b3, regression coefficients; R, correlation coef-ficient; R2, percentage of explained variance.
b0 = 10.953.
Significance of the model: R = 0.57, R2 = 33 per cent, P = 0.05.
of the sample (type II error). However, if despite the large random error statistically significant differences are detected, as is the case in this investigation, this substantiates the findings. Functional appliance treatment may thus lead to mild muscular atrophy, possibly due to decreased functional activity of the masticatory muscles.
Another possible explanation for the decrease in maximal molar bite force during functional appliance treatment may be occlusal instability. In the study by Ingervall and Bitsanis (1986), it was found that molar bite force increased during the first 6 months of treatment. This may be because they constructed acrylic occlusal splints in order to perform bite force measurements and this in turn meant that any occlusal instability resulting from treatment was eliminated by the use of these occlusal splints. Thus, the decrease in maximal molar bite force seen in the present patient sample during treatment may be a result of this occlusal instability. A stable occlusion has been shown to be a prerequisite for maximal muscle activity during biting (Ingervall and Egermark-Eriksson, 1979; Ingervall et al., 1979; Bakke and Møller, 1980).
A lower pre-treatment maximal molar bite force was associated with a larger overjet reduction, improvement in the molar relationship from Class II to Class I, a decrease in ANB angle, and an increase in SNB angle during treatment, even when factors such as gender and age were taken into consideration. Both age and gender influence bite force measurements (Koc et al., 2010), and it would have been advantageous to study a larger and more homogeneous sample of patients. This was accounted for by including age and gender as independent variables in the regression analyses, thereby addressing these differences. The abovementioned associations were still observed when doing so. Generally therefore, individuals with a lower bite force seem to respond more favourably to activator treatment, both dentally (overjet and molar relationship) and skeletally (ANB and SNB angle).
The initial condition of the masticatory muscles may thus dictate how individuals respond to functional appliance treatment. The effects on the mandible (namely the increase in SNB angle) as well as the intermaxillary relationships (overjet, molar Class, and ANB angle) are more apparent in individuals with a weaker maximal bite force, while those with a stronger maximal bite force show a larger resistance to this effect. Thicker masticatory muscles may increase the anchorage of the mandibular dentition due to the exertion of larger masticatory forces. The extraoral traction-like effect of functional appliances may also be responsible for some of the intermaxillary changes, possibly through a distalization effect on the maxillary molars, which once again may be more pronounced in those with a weaker maximal bite force, perhaps suggesting that it is easier to ‘jump’ the occlusion in those with a weaker bite force.
Functional appliances have been criticized for their tendency to procline mandibular incisors and retrocline
maxillary incisors (Lund and Sandler, 1998). In the present study, this was the case during the treatment period. A large variation was however noticed. This variation may be due to factors reflecting individual growth variation or to growth modification due to appliance wear. A part of this variation may be explained by the functional capacity of masticatory muscles. However, when considering bite force in this sample, no correlation was seen as regards changes in maxillary or mandibular incisor proclination.
It has been postulated that the insertion of an appliance in the mouth seems to work as a factor that triggers dental, skeletal, and muscular adaptation (Bresin et al., 2000). Masticatory muscles with different functional capacities seem to have a different tissue adaptation. This may also have been the case in this study in individuals with stronger and weaker maximal bite forces and their varying response to functional appliance treatment.
The question of compliance with regard to the wear of functional appliances is always an issue when carrying out human studies. It may be assumed however that children with either weaker or stronger bite forces all faced the issue of compliance and so comparisons can be made without taking this factor into account.
Conclusions
Maximal molar bite force decreases during activator treatment, while in a growing child not undergoing treatment, an increase is observed. Children with a weaker maximal molar bite force pre-treatment seem to show greater improvements in dental sagittal relationships. For skeletal variables, larger changes were also seen in children with a weaker pre-treatment maximal molar bite force in relation to ANB and SNB angles. Clinically, this means that children with weaker bite forces are more likely to show a favourable response to activator treatment than those with a stronger bite force.
References
Aelbers C M, Dermaut L R 1996 Orthopedics in orthodontics: Part I, fiction or reality—a review of the literature. American Journal of Orthodontics and Dentofacial Orthopedics 110: 513–519
Ahlgren J 1960 An electromyographic analysis of the response to activator (Andresen-Häupl) therapy. Odontologisk Revy 11: 125–151
Andresen V, Häupl K 1945 Funktionskieferorthopädie. Die Grundlagen des norwegischen Systems. Johann Ambrosius Barth, Leipzig
Antonarakis G S, Kiliaridis S 2007 Short-term anteroposterior treatment effects of functional appliances and extraoral traction on Class II malocclusion. A meta-analysis. Angle Orthodontist 77: 907–914 Bakke M, Møller E 1980 Distortion of maximal elevator activity by
unilateral premature tooth contact. Scandinavian Journal of Dental Research 88: 67–75
Bishara S E, Ziaja R R 1989 Functional appliances: a review. American Journal of Orthodontics and Dentofacial Orthopedics 95: 250–258 Björk S, Skieller V 1983 Normal and abnormal growth of the mandible. A
synthesis of longitudinal cephalometric implant studies over a period of 25 years. European Journal of Orthodontics 5: 1–46
Bresin A, Bagge U, Kiliaridis S 2000 Adaptation of normal and hypofunctional masseter muscle after bite-raising in growing rats. European Journal of Oral Sciences 108: 493–503
Carels C, van der Linden F P 1987 Concepts on functional appliances’ mode of action. American Journal of Orthodontics and Dentofacial Orthopedics 92: 162–168
Dahlberg G 1940 Statistical methods for medical and biological students. Allen and Unwin, London
Dermaut L R, Aelbers C M 1996 Orthopedics in orthodontics: fiction or reality. A review of the literature. Part II. American Journal of Orthodontics and Dentofacial Orthopedics 110: 667–671
Graber T M, Neumann B 1977 The activator: use and modifications. In: Removable orthodontic appliances. Saunders, Philadelphia, pp. 213–215
Helkimo E, Carlsson G E, Carmeli Y 1975 Bite force in patients with functional disturbances of the masticatory system. Journal of Oral Rehabilitation 2: 397–406
Ingervall B, Bitsanis E 1986 Function of masticatory muscles during the initial phase of activator treatment. European Journal of Orthodontics 8: 172–184
Ingervall B, Egermark-Eriksson I 1979 Function of temporal and masseter muscles in individuals with dual bite. Angle Orthodontist 49: 131–140
Ingervall B, Ridell A, Thilander B 1979 Changes in activity of the temporal, masseter and lip muscles after surgical correction of mandibular prognathism. International Journal of Oral Surgery 8: 290–300
Kiliaridis S 1998 A step towards the postempirical era of functional dentofacial orthopaedics. In: Carels C, Willems G (eds). The future of orthodontics. Leuven University Press, Brussels, pp. 97–102
Koc D, Dogan A, Bek B 2010 Bite force and influential factors on bite force measurements: a literature review. European Journal of Dentistry 4: 223–232
Lund D I, Sandler P J 1998 The effects of twin blocks: a prospective controlled study. American Journal of Orthodontics and Dentofacial Orthopedics 113: 104–110
Miralles R, Berger B, Bull R, Manns A, Carvajal R 1988 Influence of the activator on electromyographic activity of mandibular elevator muscles. American Journal of Orthodontics and Dentofacial Orthopedics 94: 97–103 Moss J P 1975 Function-fact or fiction? American Journal of Orthodontics
67: 625–646
Sessle B J et al. 1990 Effect of functional appliances on jaw muscle activity. American Journal of Orthodontics and Dentofacial Orthopedics 98: 222–230
Staudt C B, Kiliaridis S 2010 Association between manidibular asymmetry and occlusal asymmetry in young adult males with Class III malocclusion. Acta Odontologica Scandinavica 68: 131–140
Thilander B, Filipsson R 1966 Muscle activity related to activator and intermaxillary traction in Angle Class II, division 1 malocclusions. An electromyographic study of the temporal, masseter and suprahyoid muscles. Acta Odontologica Scandinavica 24: 241–257
Tulloch J F, Medland W, Tuncay O C 1990 Methods used to evaluate growth modification in Class II malocclusion. American Journal of Orthodontics and Dentofacial Orthopedics 98: 340–347
Woodside D G 1977 The activator. In: Graber T M, Neumann B (eds). Removable orthodontic appliances Saunders, Philadelphia, pp. 269–336