Published in "Public Relations Review" 42(3), 2016, 418-431
which should be cited to refer to this work
Advancing PR measurement and evaluation: Demonstrating
the properties and assessment of variance-based structural
equation models using an example study on corporate
reputation
Diana Ingenhoff
a,∗, Alexander Buhmann
baDepartment of Communication and Media Research (DCM), University of Fribourg, Switzerland bDepartment of Communication and Culture, BI Norwegian Business School, Oslo, Norway
1. Introduction
After more than three decades of research, public relations scholarship has come a long way in developing an academic identity and becoming an independent field (Sisco, Collins, & Zoch, 2011;Smith, 2012). However, to further establish and consolidate the field within the wider domain of communication, research progress is needed both in terms of theory and research methodologies, as well as in researcher’s continuity and stringency in applying these approaches (Pasadeos, Berger, & Renfro, 2010;Pasadeos, Lamme, Gower & Tian, 2011). Accordingly, the properties and application of available methods in public relations research is a topic in high need of discussion. Researchers have started to address this topic by reviewing and evaluating the application of widely used methods (Cutler, 2004; Pasadeos et al., 2011) and systematically introducing new methodological approaches to the field (Everett & Johnston, 2012).
In the context of PR measurement and evaluation, with its current need for advancing methods for assessing PR outcomes (Amec, 2010), such discussions are especially promising. Measuring and evaluating outcomes (such as image, reputation, trustworthiness, or legitimacy) is a demanding task since these target constructs are no manifest phenomena, but rather complex intangibles that have to be defined, specified and operationalized carefully to produce meaningful results. If con-ceptualized with multiple dimensions, the constitution of these constructs yet involves various interrelated latent/emergent
∗ Corresponding author.
variables. Furthermore, from an evaluation standpoint, merely descriptive analyses of an organization’s image or reputation cannot explain what public relations scholars ultimately want to know, which is: how exactly these constructs contribute to the building of trust-based relations, the facilitation of favorable stakeholder behavior, or even the creation of economic value added for a respective company. Without taking into consideration a wider network of relationships, it is not possible to fully evaluate the importance of an organization’s image and reputation.
A powerful statistical technique for analyzing such networks of relationships is structural equation modeling (SEM) (Bagozzi & Fornell, 1982). The common and widely used method to apply SEM adheres to confirmatory covariance-based procedures (CB-SEM) for testing causal models. A complementary method to CB-SEM is the variance-based approach of partial least squares structural equation modeling (PLS-SEM) which has an exploratory focus and allows for more modeling flexibility than the CB-SEM approach (Tenenhaus, Vinzi, Chatelin & Lauro, 2005;Wold, 1982). Due to the latest analyses of PLS properties (e.g.,Reinartz, Haenlein, & Henseler, 2009) as well as newly emerging techniques for estimating PLS models (e.g.,Henseler, 2012), the understanding of the approach has much increased in recent years. Because of these advances, PLS-SEM is currently attracting much attention in business research disciplines such as marketing and management research (Hair, Sarstedt, Ringle, & Mena, 2012;Hair, Sarstedt, Pieper, & Ringle, 2012;Henseler, Ringle, & Sinkovics, 2009). In the field of communication a meta-search via EBSCO Communication Abstracts using the keywords “partial least squares” and “PLS” identifies a total of 83 studies between 1986 and 2015. Public relations research, as a communication domain, however, has so far not taken much advantage of the latest advances in PLS-SEM: A meta-search of the six leading international PR journals1using the same keywords identifies only two research papers; which refrain from demonstrating the specific advantages of the approach for PR research. This is surprising given that, as we argue below, the particular properties of the PLS approach allow to address some of the current challenges in public relations research, especially when it comes to questions of evaluation involving multiple intangibles or models which are not jet fully confirmed and standardized.
In this paper, we aim to show how the statistical technique of PLS-SEM can be gainfully applied to public relations research for predicting relations between intangible target constructs. We introduce PLS-SEM and show its properties as a variance-based approach to structural equation modeling, highlighting the method’s complementary nature and differences to CB-SEM. To demonstrate the application of the method in the context of public relations research, we then provide a step-by-step assessment of PLS path model results using an evaluation study with survey data (n = 1892) on corporate reputation and its effect on trust and stakeholder behavior. In the concluding section we summarize and discuss how PLS-SEM can enrich future research in the field of public relations evaluation both statistically and conceptually.
2. Properties of PLS-SEM and its differences to CB-SEM
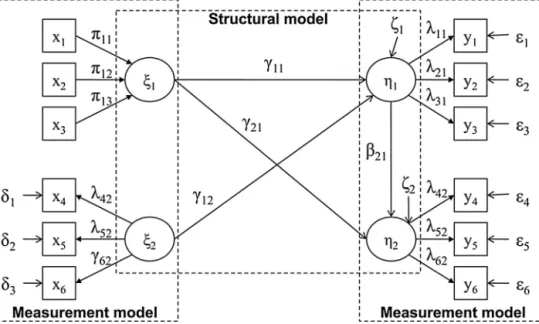
Structural equation modeling (SEM) combines elements of regression and factor analysis to assess causal relations between multiple intangible constructs in a single and comprehensive analysis while explicitly accounting for measure-ment error. Thus, the technique is extremely helpful in making sense of data using appropriately complex models. In SEM, such models consist of two general components: First, the structural model, which represents the hypotheses on how the different intangible constructs affect each other. As such, structural models comprise two types of constructs: Those con-structs that affect/explain the variance of other concon-structs in the model (called exogenous variables) and those concon-structs that are dependent, i.e., affected by other constructs in the model (called endogenous variables). Statistically estimating structural relations between these variables requires the respective constructs to be operationalized using observable vari-ables (indicators). Thus, the second component of SEM models consists of the measurement models used to empirically excess the intangible constructs.Fig. 1shows a graphic example model with two exogenous and two endogenous variables (rep-resented by the four circles), their hypothesized relations (rep(rep-resented by the directed arrows, or ‘paths’, in the structural model), and indicators (represented by the boxes) used to measure the different constructs.
Structural equation modeling is particularly useful in public relations research when researchers need to analyze interre-lations between multiple key concepts that are not directly observable. In recent years, there has been a substantial number of studies that apply SEM in public relations (cf.De Bussy & Suprawan, 2012; Kim & Niederdeppe, 2013; Chen, 2013;Chung, Lee, & Heath, 2013;Jiang, 2012; Weberling & Waters, 2012; Ki, 2013;Song, Kim, & Han, 2013;Lee & Hong, 2012). So far, however, most researchers associate SEM solely with the covariance-based procedures (Jöreskog, 1978). Due to concerns regarding the informational and distributional requirements of CB-SEM approaches and their fixed emphasis on theory testing (Wold, 1982), PLS-SEM was developed as a complementary method to the strictly confirmatory and fitting-based approach of CB-SEM (Jöreskog & Wold, 1982).
Generally speaking, PLS-SEM is a causal modeling approach, which aims at maximizing the explained variance of the endogenous variables in a model. Unlike CB-SEM procedures, structural equation modeling with PLS is based on the regres-sion principle using ordinary least squares (OLS) to explain variance (Fornell & Bookstein, 1982). The estimation is based on principal component analysis and no distributional assumptions are required of the data. Thus, other than in CB-SEM, the manifest variables must not necessarily be distributed multi-normally. As a consequence, there is no global measure of model validity available, but standard errors can be calculated for the estimated model parameters using bootstrapping as
1Public Relations Review (1), Journal of Public Relations Research (0), Journal of Communication Management (1), International Journal of Strategic Communication (0), Public Relations Inquiry (0), Public Relations Journal (0).
Fig. 1. Graphic example of SEM (adopted fromRoldán & Sánchez-Franco 2012).
a non-parametric technique (Chin, 2010). Another general difference between PLS measurement models and those based on covariance analysis lies in the way in which measurement errors are dealt with. While in the latter case, the variance of the observed variables is broken down into factor variance and measurement error variance, PLS models do not make this distinction and relationships with the latent variable can be underestimated as a consequence.
Due to these properties, PLS-SEM offers many benefits that are not offered in CB-SEM (Hair, Ringle, & Sarstedt, 2011). Specifically, the statistical characteristics of PLS-SEM are suitable under certain empirical conditions which are difficult to handle using the common CB-SEM approach: namely for studies that need larger modeling flexibility, work under restrictive conditions in terms of sample size, deal with high model complexity, and use formative measures.
2.1. Modeling flexibility
Other than the full information approach of CB-SEM, which primarily focuses on the selection of appropriate path coef-ficients involving all indicator covariances (Rigdon, 1998), the component-based algorithm of PLS-SEM explicitly creates scores (proxies) for the constructs and delivers estimates locally, that is focused on the immediate neighboring variables to which the constructs are structurally related (Tenenhaus et al., 2005). This is a relevant difference to CB-SEM where possible misspecifications such as the false association of an indicator with a construct or the leaving out of a relevant path strongly affect other estimates in the model. In any case, of course, the notion of testing a ‘true’ model is problematic since it is highly unlikely that nomological networks between a group of selected constructs are accurate in the sense that they exclude non-linear relationships or further underlying traits (Cudeck & Henly, 2003). Seen in this context, the PLS algo-rithm tends to be less rigid. Though the method is sometimes said to be appropriate also in strictly confirmatory settings (Chin, 2010; Hair et al., 2011), in public relations research, local estimation can be of particular advantage when the study objective lies in prediction and innovating new theory and measures in an iterative research process rather than testing a well-established theoretical model. Especially in PR evaluation, where most models are still in the developing stage, this offers a viable alternative to CB-SEM.
2.2. Handling high model complexity
Even though models are necessarily imperfect representations of reality, it is argued that researchers tend to stick too often to testing relatively simple models due to methodological restrictions (Chin, Peterson, & Brown, 2008). In CB-SEM, for instance, the chance of obtaining good model fit is strongly tied to modeling a restricted number of indicators (Diamantopoulos & Siguaw, 2000). In many contexts, however, researchers need more complex models, for instance when they aim to capture the many factors related to attitudes, opinions, and behaviors (Chin, 2010). Understanding attitudes, opin-ions, and behaviors and their interrelations is, of course, central in public relations evaluation. And attitudinal PR outcome variables such as image and reputation, especially when they are conceptualized as multidimensional latent constructs, necessitate rather complex models. In such research contexts, the component-based least squares approach of PLS-SEM
can be helpful because models may consist of a large number of latent and manifest variables without causing estimation problems (Wold, 1985).
2.3. Sample size requirements
Depending on model complexity, CB-SEM requires relatively large samples. A substantial number of simulation studies on CB-SEM show that there are nonconvergence problems in small samples with n < 200 cases (Boomsma & Hoogland, 2001). In PLS-SEM, where estimates are based on an iterative process of performing a series of OLS regressions, sample size requirements are much less restrictive (Tenenhaus et al., 2005). This can come as an advantage to researchers in public relations evaluation because in evolving fields – where new models are being explored and measurement instruments are still in the developing stages – it is often favorable to be more independent of sample size requirements (Henseler et al., 2009). When developing new models on the evaluation of PR outcomes, for example, as demanded by the recent Barcelona Declaration of Measurement Principles (Amec, 2010), it is very useful to apply an approach that allows to explore intangibles and their relations in the context of smaller samples before moving to large confirmatory survey settings.Goodhue, Lewis, & Thompson (2006), however, contest a general supremacy of PLS-SEM over the CB procedures with smaller samples and stress that advantages of PLS-SEM become apparent only when sample sizes are small relative to model complexity. In any case, researchers need to carefully consider factors such as distributional characteristics of data, the psychometric properties of variables, and the magnitude of structural relationships when determining optimal sample size (Marcoulides & Saunders, 2006).
2.4. Using formative measures
When working with intangible constructs such as image and reputation, PR researchers have to operationalize them using observable indicators. These can be specified as either formative or reflective measurement models depending on how the indicators are thought to relate to their respective construct (Bollen & Lennox, 1991). In reflective measurement models indicators are conceived as observable consequences of the underlying construct (Fornell & Bookstein, 1982). In this case, indicators are termed reflectors (Pedhazur & Pedhazur Schmelkin, 1991) or indicative manifestations (Rossiter, 2002) of a latent variable. The underlying assumption is that these indicators have a common core (Nunnally, 1978), which explains why they are (generally) highly correlated and considered to be interchangeable (Ley, 1972). It is assumed that all indicators are a priori both valid and reliable for measuring the construct (Jarvis, MacKenzie, & Podsakoff, 2003).
In formative measurement models, by contrast, indicators are considered to be the cause of an emergent construct. As such, formative indicators (or ‘cause measures’) constitute the relevant dimensions of a construct, can be independent of each other and must not necessarily be correlated (Bollen, 1984). Other than in reflective measurement models, where indicators are assumed to be interchangeable, omitting indicators from a formative model necessarily leads to a change in the meaning of the construct (Diamantopoulos & Winklhofer, 2001). The graphic example inFig. 1includes representations of both these ‘modes’ of measurement (see1for formative measures and2for a reflective model).
As recently pointed out (Buhmann & Ingenhoff, 2015), the distinction between both forms of measurement is rarely addressed in public relations research and most measurement models are specified reflectively without further ado. In fact, asDiamantopoulos and Winklhofer (2001)point out, and show with plenty examples, many constructs in the social sciences in general are specified incorrectly. Similar, a meta-analysis of top-level marketing journals shows that a substantial portion of studies apply SEM with misspecified measurement models leading to incorrect parameter estimates and relationship assessments (Jarvis et al., 2003). In public relations research scholars have recently argued that intangibles such as image and reputation aught to be operationalized with formative indicators since respective observations are determinants of the construct and not its consequence (Tong, 2013; Buhmann & Ingenhoff, 2015). Analyzing such constructs within SEM can cause identification problems when using the CB approach where indicators are by default assumed to be reflections of an underlying construct (MacCallum & Browne, 1993). PLS-SEM, in comparison, has been shown to demonstrate higher robustness with formative measures (Vilares, Almeida, & Coelho, 2010). This makes the PLS approach especially valuable for PR evaluation because sets of individual formative indicators allow for an in-depth assessment of particular differences regarding the relevant value drivers of respective target constructs such as image, reputation, trust, or legitimacy.
3. Assessment of PLS path model results for PR evaluation
The variance-based PLS approach to structural equation modeling can be gainfully applied to research in public relations evaluation by linking conceptual considerations regarding different intangible target constructs and their functional relations with issues of measurement. The above properties of PLS-SEM and the differences of the approach to common CB-SEM, however, necessitate a particular procedure of model evaluation not used in CB-SEM. To demonstrate this in an illustrative application, we draw on measures and data from an example study on the constitution and effects of corporate reputation.
Social reputation Functional reputation Affective reputation H1 H2 H3 Organizational trust H4 H5 Recommendation intention H6
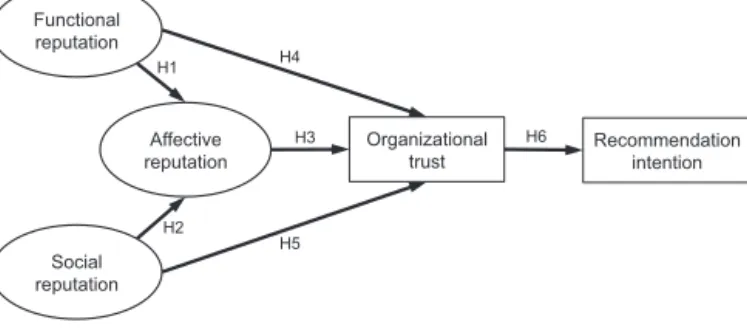
Fig. 2. Structural model of the interrelations between reputational dimensions, organizational trust and recommendation intention.
3.1. Example study: model, measures, and sample2 3.1.1. Model
Our example comprises data on the constitution and effects of the reputation of a large telecommunications company in four different stakeholder groups (n = 1892), based on a study byIngenhoff and Sommer (2010). The underlying model tests the effects of reputational dimensions on the facilitation of trust and recommendation intentions. In this model, reputation is conceptualized as an attitudinal construct comprising cognitive and affective components (Caruana, Cohen, & Krentler, 2006; Ingenhoff & Sommer, 2007, 2008, 2010;Einwiller, Carroll, & Korn, 2010;Eisenegger & Imhof, 2008). The cognitive component distinguishes between functional and social dimensions of reputation (de Castro, López, & Sáez, 2006): While functional reputation is based on the evaluation of competence and success as expressed by the achievement of certain performance goals (e.g., economic performance of the organization’s management or the quality of its products and services), social reputation is based on perceived adherence to norms and values (e.g., corporate social responsibility and sustainability). The affective component of reputation then comprises stakeholders’ feelings toward the organization as an overall judgment of general emotional attractiveness. This component is conceptualized as an outcome of cognitive evaluations. As outcome variables, the model uses trust and recommendation intention. As trust develops on the basis of consistent, long-term and trustworthy organizational behavior meeting functional and social expectations which are reflected in reputation (Hosmer, 1995), organizational reputation is considered as the central antecedent of trust (Grunig, Grunig, & Dozier, 2002;Kiousis, Popescu, & Mitrook, 2007). Since the affective component is considered as the outcome of the cognitive component of reputation, the former acts as a mediating variable through which both the functional and the social reputation exercise an indirect effect on trust. Finally, following the attitude–behavior hypothesis (Caruana et al., 2006), the attitudinal constructs of reputation and trust are seen as antecedents of behavioral intentions, in this case the intention to recommend the company to family and friends (for a graphic sumary of the model seeFig. 2).
3.1.2. Measures
FollowingHelm (2005),Ingenhoff and Sommer (2007, 2010)andTong (2013), the cognitive components of reputation are operationalized by using formative indicators since observations about a person’s judgments of a company’s functional and social qualities are thought to be determinants of these reputational constructs (and not their consequence). The dimension of affective reputation, by contrast, is represented by a reflective model because the indicators are determined by a common factor – emotional attitude towards the company – therefore, the latent variable explains the variance of the indicators (Schwaiger, 2004). For all variables, a pool of indicators was generated based on widely used items in measuring corporate reputation (see e.g.Chun, 2005; Fombrun, 1998;Ingenhoff & Sommer, 2007, 2010;Schwaiger, 2004; Wartick, 2002) (see Table A1 in the Appendix for a summary of all indicators). Trust is included as a global measure (single item). This is done because, like reputation, trust contains both an affective and a cognitive component and has many of the key elements in common with reputation (Caldwell & Clapham, 2003). As argued byDiamantopoulos, Sarstedt, Fuchs, Wilczynski, & Kaiser (2012)single item measures are preferable in cases where items can be expected to be homogenous and semantically redundant. And finally, recommendation intention is captured in terms of intentions to recommend a company’s products and services to one’s friends and family.
3.1.3. Sample
The developed instrument was applied using samples from four stakeholder groups of the telecommunications company which may be expected to assess the reputation of the company differently (Neville, Bell, & Mengüc¸, 2005;Bromley, 2000). Specifically the survey focuses on employees, financial analysts, politicians and early adopters (people with very high tech-nological affinity). All can be considered as relevant groups of people who are affected by or can affect the achievement of the
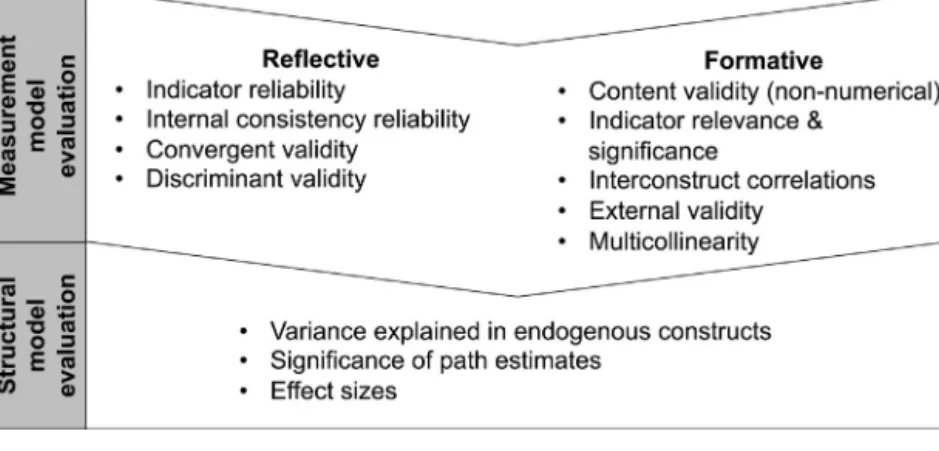
Fig. 3. Two stages of evaluation in PLS path model assessment.
company’s objectives (Freeman, 1984). All groups were surveyed using online access panels and email. The response rates came to 42% (n = 521 employees), 44% (n = 303 financial analysts), 17% (n = 516 politicians), and 37% (n = 456 early adopters). 3.2. Assessment of PLS path model results
There are a number of software packages available to conduct model evaluation in PLS-SEM (for a comparison of different tools seeTemme, Kreis, & Hildebrandt, 2010). For the following assessments we use SmartPLS as a Java-based tool that processes raw data and uses bootstrapping as its resampling method (Ringle, Wende, & Will, 2005).
Model evaluation in PLS-SEM generally comprises two subsequent stages of analysis (Chin, 2010): first, assessment of the measurement model and then the assessment of the structural model (Fig. 3). Measurement model evaluation aims to show how well the chosen sets of indicators measure the respective latent or emergent constructs. Due to the difference in the indicator-construct relation, the assessment of reflective and formative measurement models follows a different procedure (Diamantopoulos & Winklhofer, 2001): In formative measurement model evaluation indicators are examined by looking at indicator weights, indicator relevance and external validity. In reflective measurement model evaluation indicators are examined based on indicator loading, indicator reliability, internal consistency reliability, and discriminant validity. When the quality of the measurement model is evaluated, the structural model evaluation follows as a second stage of analysis directed at an assessment of the meaningfulness and significance of the hypothesized relationships between the constructs.
3.2.1. Formative measurement model evaluation
Indicator weights. Since in formative measurement models the variance of the latent variable is explained by the indi-vidual indicators, the first step is to interpret the weights of the indiindi-vidual models by sign and magnitude (a weight is the coefficient that shows the impact of the item on the latent variable). Weights are considered significant with an error prob-ability of 5% when the t-score exceeds 1.96. As shown inTable 1, most indicator weights of the functional reputation are significantly positive, which means that the hypothesized relationship between the indicators and the latent variable are largely confirmed.
Indicator relevance. Relevance of indicators can be ascertained by testing for multicollinearity. This is necessary because in the event of excessively high collinearity between items, the standard errors of the coefficients increase and therefore, the significance test of the effects becomes problematic (Diamantopoulos & Winklhofer, 2001). We use the Variance Inflation Factor (VIF), which represents the reciprocal tolerance value. Tolerance is ascertained by subtracting the coefficient of determination from 1. The coefficient of determination represents the proportion of the variance of an indicator, which is explained by the other indicators in the construct. Therefore: the stronger the multicollinearity, the greater is the VIF. Entirely independent indicators would lead to a minimal VIF of 1. Though it is not possible to provide a precise threshold value, it is generally recommended that the value should be close to 1 and not exceed 10 (Bowerman & O’Connell, 2000). For all stakeholder groups, the VIFs of the functional and social dimension are relatively small and within an acceptable range, indicating that the single items are sufficiently independent of each other (Table 2). An additional measure for establishing multicollinearity, which is ascertained by observing the intrinsic values of the indicators, is the condition index which should not exceed 30 (Hair, Black, Anderson, & Tatham, 2006). For all stakeholder groups, the condition indices of both cognitive dimensions are also well below the threshold value.
External validity. In order to guarantee the external validity of the construct measurement, it is recommended to use an external global measure (summary item) (Diamantopoulos & Winklhofer, 2001). For this reason the survey included an item asking respondents to assess the company’s overall reputation. It can now be examined whether the individual items of the formative measurement models correlate positively and significantly with this global, manifest variable. All of the indicators of the two constructs of the cognitive component of reputation – functional and social reputation – correlate positively and
Table 1
Indicator weights in the cognitive, formative models.
Constructs and items: Financial analysts
Weights/t-values Employees Weights/t-values Early adopters Weights/t-values Politicians Weights/t-values Functional reputation
Product and service quality
Price-performance ratio .24/5.27* .21/4.22* .35/8.62* .24/5.95*
Quality of P&S .37/5.84* .14/2.96* .30/6.36* .24/5.02*
Customer value of P&S .16/2.75* .14/2.91* .12/2.89* .25/5.76*
Economic performance
Potential for growth .10/1.96* .08/1.99* .04/1.17 .02/.43
Economic stability .02/.32 .09/2.23* .12/2.52*
Management quality
Strategic decisions .05/.60 −.03/.64 .07/1.41 −.00/.02
Visions for the future −.01/.14 .13/2.39* −.04/1.00 −.01/.11
Innovativeness
R&D investment .01/.17 .10/2.16* .08/2.13* .09/2.25*
Know-how .24/3.56* .12/2.87* .09/2.12* .10/1.98*
Personal competence of executives
CEO-competence .04/.62 .04/.78 .08/1.81 .15/3.35* Top Management-team .04/.76 .23/3.53* .06/1.26 .01/.21 National player Role as employer .14/2.90 .16/3.77* .11/3.08* .15/4.28* Ground-breaking in industry .13/2.36 .16/3.45* .07/1.57 .08/1.83 Social reputation Social engagement .13/1.13 .11/1.84 .28/4.96* .39/5.89* Social responsibility .41/3.58* .45/7.10* .42/7.86* .42/5.41* Resource-friendly .26/1.96* .27/3.92* .24/4.63* .22/3.21* Welfare of employees .32/3.37* .32/5.39* .16/2.76* .16/2.83* Environmental commitment .29/2.18* .19/3.25* .10/1.66 .16/2.22* Table 2
VIF and condition indices.
Financial analysts Employees Early adopters Politicians
Functional reputation VIF 2.4 2.4 3.1 2.4 Condition index 19.2 16.1 20.8 18.7 Social reputation VIF 1.4 1.8 2.2 1.6 Condition index 13.8 9.9 13.4 12.8 Table 3
Indicator Loadings, Cronbach’s Alpha and AVE in the Reflective Model (Loadings/t-values). Affective reputation Financial analysts
Loadings/t-values Employees Loadings/t-values Early adopters Loadings/t-values Politicians Loadings/t-values Sympathy .79/27.14 .81/39.94 .89/82.42 .81/80.22
Enthusiasm for brand .88/61.12 .85/61.62 .91/82.01 .84/60.58
Fascinating products .81/32.17 .79/41.89 .87/64.30 .80/42.52
Cronbach’s alpha .77 .75 .87 .76
AVE .69 .66 .79 .67
significantly with the global measure of the company’s overall reputation; this holds true in each of the stakeholder groups (see Table A2 in the Appendix). All in all, the specification of the measurement models for functional and social reputation can be considered satisfactory.
3.2.2. Reflective measurement model evaluation
Indicator loadings. The first step in the assessment of the reflective measurement model is to examine which indicator is best explained by the latent construct. This requires examination of the loadings, which no longer correspond to the regression coefficient, as in the case of the formative models, rather must be interpreted in principle as loadings in a factor analysis. As such, they should have significant values ideally exceeding .7 in order to explain at least 50% of the indicator variance (Nunnally & Bernstein, 1994). In all groups, all loadings are significantly positive and above the threshold value (Table 3).
Indicator reliability. This value is also strengthened by the share of the explained variance of the indicator with the weakest loading. At .79 (financial analysts), the factor of sympathy has the weakest loading for affective reputation. Squaring this value results in an explained variance of at least 62%, which is substantially higher than the threshold value of 50% specified above.
Social reputation Functional reputation Affective reputation .646* .230* .130* Organizational trust .700* .004 .658* R2= .63 R2= .71 Recommendation intention R2 = .43
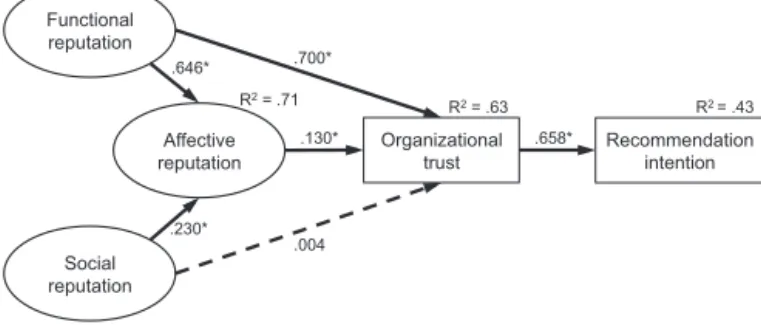
Fig. 4. Structural model results for the stakeholder group of early adopters. Table 4
Structural model results (path coefficients and t-values).
Financial Analysts Path-coefficients/t-values Employees Path-coefficients/t-values Early adopters Path-coefficients/t-values Politicians Path-coefficients/t-values
H1: Fun. reputation => aff. rep. .638/15.70 .560/12.36 .646/13.32 .605/13.32
H2: Soc. reputation => aff. rep. .182/3.42 .273/5.84 .230/4.51 .234/5.76
H3: Aff. reputation => trust .168/2.23 .168/2.70 .130/1.97 .205 3.69
H4: Fun. reputation => trust .532/7.10 .460/6.86 .700/10.89 .586/9.54
H5: Soc. reputation => trust -.045/.82 .080/1.34 .004/.38 .009/.17
H6: Trust => recomm. intent. .447/9.96 .365/8.43 .658/21.06 .089/1.86
Table 5
Coefficient of determination (R2).
Financial Analysts Employees Early adopters Politicians
Affective-expressive reputation .58 .61 .71 .62
Trust .41 .44 .63 .58
Recommendation intention .20 .13 .43 .01
Internal consistency reliability can be assessed with Cronbach’s alpha, as a measure for the homogeneity of a construct. A value of .7 is considered acceptable, while in constructs with three indicators a value of .4 can be tolerated because Cronbach’s alpha increases as the number of indicators grows (Nunnally, 1978). In all stakeholder groups, Cronbach’s alpha lies above .7 and thus clearly meets the requirements.
Discriminant validity. We can assume discriminant validity when the average variance extracted (AVE) – that is, the shared variance between the indicators and their latent variable – is greater than .5 and also greater than the squared correlations with all other latent variables in the model (see “Fornell-Larcker Criterion”;Fornell & Larcker, 1981). The calculation of the cross loadings also allows us to ascertain to what extent the measurements of different constructs diverge within a measurement instrument (discriminant validity). If the single loadings of the indicators are greater for their own latent variables than for the other latent variables in the model, then it can be assumed that the measurement model is well differentiated with respect to the other constructs. In all groups, the AVE is greater than .5 (with a range of .67–.79) and is much larger than the squared correlation with the other latent variables. The cross loadings support these results, for the loadings are much smaller for the other latent variables (Table 3).
3.2.3. Structural model evaluation
Having assessed the two types of measurement models, the next step is to evaluate the structural model. For a graphical summary of the structural model results in the case of the stakeholder group of early adopters seeFig. 4.
To evaluate the structural model we first examine the path coefficients and their respective significance. In a first step we ascertain the relative influence of the two cognitive components of functional reputation and social reputation on the development of affective reputation (Table 4). The path coefficients can be interpreted in the same way as the beta values in a linear regression. Together the dimensions explain 58% (financial analysts) to 71% (early adopters) of the variance of the affective dimension; the coefficient of determination (R2) exceeds 50% (Table 5). The assessment of competence (functional
reputation) has the strongest influence on the formation of affective reputation in all groups. H1 is therefore confirmed. The dimension of social reputation also shows an independent, albeit weaker, significant positive influence on the affective component. H2 is thus also supported. The second effect in the model concerns the impact of the affective component on organizational trust. Here, all path coefficients between .130 (t score = 1.97) and .205 (t score = 3.69) show a very significant influence (Table 4). The trust variable is explained overall by an R2of 41% (financial analysts) to 63% (early adopter) (Table 5).
Thus, H3 is confirmed for all groups. Functional reputation shows a direct influence on trust-building, while social reputation has no significant direct impact on trust. Thus, while H4 is confirmed, the results suggest to reject H5: While the functional dimension of reputation has a direct effect on trust-building, the social dimension has no significant direct influence.
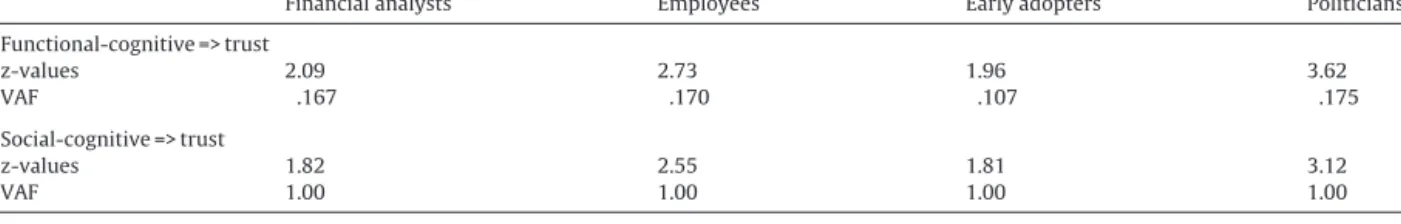
Table 6
Indirect effects.
Financial analysts Employees Early adopters Politicians
Functional-cognitive => trust z-values 2.09 2.73 1.96 3.62 VAF .167 .170 .107 .175 Social-cognitive => trust z-values 1.82 2.55 1.81 3.12 VAF 1.00 1.00 1.00 1.00
However, since the path coefficient between social reputation and affective reputation is significantly positive, and because the affective component has a significant influence on trust, it can be assumed that social reputation has an indirect effect on trust-building which is mediated by the affective component. This conclusion, of course, also applies to the func-tional dimension. Thus, a mediation analysis is conducted. We can assume that an effect is fully mediated if the overall effect of the exogenous variable on the endogenous variable passes entirely through the mediating variable. If the exogenous vari-able also has a significant direct effect on the endogenous varivari-able, then we have a partial mediation (Baron & Kenny, 1986). A z-test can be applied to ascertain whether the indirect effect for the social dimension is significant or not. It examines the path coefficients of the independent variable on the mediating variable and of the mediating variable on the dependent variable, as well as the standard errors of the path coefficients. If the z-score exceeds 1.96, then (with an error margin of 5%) it can be assumed that there is an indirect effect. If the mediating effect is only partial, then the variance accounted for (VAF) can be ascertained. This calculates the indirect influence of the variable as a share of the total influence (that is, the direct and the indirect effect on the dependent variable) and thus indicates which percentage of the total influence is accounted for by the indirect effect (Baron & Kenny, 1986). Given a z-score of 1.96 (early adopter) to 3.62 (politicians), the indirect effect is significant in all groups and is responsible for 10.7% (early adopter) to 17.5% (politicians) of the total influence of functional reputation on trust (Table 6). Consequently, 89.3% (early adopter) to 82.5% (politicians) of the influence is explained by the direct effect—thus confirming a relevant case of partial mediation.
For the variable of social reputation, which has no direct influence on trust-building, the overall influence is exerted 100% by the mediating variable (full mediation). The z-score of financial analysts and early adopters is only slightly lower than the significance level of 5% error probability, but exceeds the value of 1.64, which indicates a significant indirect influence with an error probability of 10%. Thus, we cannot confirm H5 because of the restriction that if we believe that social reputation has an indirect effect on trust-building, then the probability that we are in error is slightly higher than 5% (it is actually around 7%, seeTable 6).
Finally, we look at the influence of trust on favorable stakeholder behavior, i.e., recommendation intention. For all stake-holder groups except politicians, trust has a significant effect on positive recommendations of the products and services of the company (between .365 (t score = 8.43) for the employees and .658 (t score = 21.06) for the early adopters) (Table 6). The explained variance of the intention to recommend the company’s products and services amounts to .43 (early adopters) Consequently, H6 is confirmed for all groups, except for the politicians.
4. PLS model interpretation in the context of PR evaluation
What’s unique about the interpretation of PLS-SEM results in the context of PR evaluation is that the analysis of the individual indicators in the formative measurement models allows for an in-depth assessment of particular differences regarding the value drivers of the target construct—in this case corporate reputation (see Table A3 in the Appendix). This is a major difference to approaches that only allow for reflective models where a whole battery of indicators consists of interchangeable measures for the same underlying factor. Looking at the example study, a comparison of the functional dimension across the groups shows, e.g., that the quality of the company’s products and services plays a crucial role in the creation of the latent construct in all groups. In particular, the assessment of the price/performance ratio and of the quality of the products and services significantly influences the constitution of functional reputation. Furthermore, the company’s unique know-how (as a subdimension of innovativeness) and its role as an employer (as a subdimension of national player), both substantially influence the construct in all stakeholder groups. Additionally, we see that the often-mentioned strong explanatory power of economic performance and quality of management for reputation is not relevantly supported for this particular company in any of its stakeholder groups. Overall, these variables show little strength of influence. In fact, in the case of the early adopters they make no contribution at all to the explanation of functional reputation. In the specific case of the company in the example study, the comparatively low relevance of economic performance and quality of management might be explained by a constantly good performance over many years, so that stakeholders came to take this for granted. On the level of social reputation the evaluation also reveals strong similarities across the different stakeholder groups. The implementation of social responsibility is the indicator with the greatest explanatory power in all groups, followed by commitment to the environment in the form of resource-friendly business practices and by concern for the welfare of employees. We see that all groups therefore consider it extremely important for the company’s social reputation that it should demonstrate a sense of social responsibility and not violate social norms or disappoint normative expectations.
Furthermore, the results reveal not only similarities between the company’s stakeholder groups (as, e.g., both the assess-ments of functional reputation and social reputation show a significant effect on affective reputation) but also indicate particular differences between them. For instance, looking at the politicians we see that – in addition to product and service quality – the role of the company as an employer proved to be particularly important in explaining functional reputation. These findings highlight the centrality of the company’s societal obligations in the eyes of its political stakeholders. By comparison, when looking at the group of employees, almost all formative items have a significant effect on the emergent constructs. This indicates that the employees’ knowledge of the company is not primarily influenced by a selective focus (as it is common in external stakeholder groups that rely mainly on mass mediated information) but is based on their own diverse experiences with the company. Furthermore, the fact that almost all aspects of the performance-subdimension are considered important suggests that these employees are very sensitive to their direct dependence on the good performance of their employer. This is also a plausible interpretation, when looking at the subdimension of quality of management where the company’s vision for the future is significant in the employee group.
5. Discussion and conclusion
The paper contributes to the recent efforts of advancing methods in public relations (Cutler, 2004; Everett & Johnston, 2012; Pasadeos et al., 2011) by introducing partial least squares structural equation modeling (PLS-SEM) as a variance-based approach to SEM. Reviewing general properties of the method, we show its complementary characteristics to the CB-SEM approach and establish central arguments that can encourage the method’s application in specific empirical contexts and for particular research objectives in public relations research. Particularly, it is argued that PLS-SEM tends to be sufficiently robust with few identification problems, is relatively independent of sample size requirements, works well with a large number of variables, and can incorporate both formative and reflective measures. We suggest that in studies where specific assumptions behind CB-SEM cannot be met – e.g., when the objective necessitates formative measures or predictive theory development instead of confirmatory testing of an established model – PLS-SEM offers vast potential for public relations research as a complementary approach to CB-SEM.
To demonstrate the specifics of PLS-SEM in a practical research example we use an example study on corporate reputation and its effects on trust and recommendation intention (Ingenhoff & Sommer, 2010), showing the different steps necessary in PLS model evaluation. Specifically, we demonstrate formative and reflective measurement evaluation as well as structural model evaluation using variance explained, significance of path estimates, and effect sizes. Building on this evaluation procedure, we use the results from the example study to illustrate possible pathways for interpretation of PLS analyses in the context of public relations evaluation. Specifically, we present empirical differences in the various dimensions responsible for building reputation in different stakeholder groups. This shows how the PLS approach can produce important knowledge about the value drivers of intangible PR target variables, helping public relations evaluators better measure, monitor, and address their stakeholders’ expectations and needs.
5.1. Limitations and future research
When coming to the limitations, we may address three separate levels. The limitations of the PLS approach, the limitations of the applied example study for demonstrating the specifics of the PLS approach, and the limitations of the empirical study itself. In line with the aim of the paper the focus of discussing limitations will be on the first two.
First, there has recently been a vivid discussion on the complementary nature of PLS-SEM to CB-SEM and PLS-SEM’s limitations (Cortina, 2014; Henseler et al., 2014;McIntosh, Edwards, & Antonakis, 2014;Rönkkö, 2014). Two of the most prominent critical assessments of PLS-SEM’s limitations can be found inGoodhue, Thompson, and Lewis (2013)andRönkkö and Evermann (2013).Goodhue et al. (2013)highlight problems in PLS-based SEM in contrast to CB-SEM. Particularly they argue that estimates of path coefficients in PLS increase beyond their true value when the sample size decreases. This limitation is linked to the so-called “good neighbor assumption” in PLS (Kock & Mayfield, 2015) according to which the weights and loadings linking latent variable scores and their indicators are estimated to maximize the strength of associations between latent variables that are causally linked. The argument byRönkkö and Evermann (2013)is very similar to that of Goodhue et al. Though the authors direct their criticism at the basic PLS algorithm which implements a very strong version of the “good neighbor assumption” and is – as Kock argues – not the algorithm that is implemented in most of the available tools for PLS-based SEM. Nonetheless, the “good neighbor assumption” and the according criticism regarding PLS-SEM raises valid concerns regarding the use of PLS-SEM for hypotheses testing. This is because strict theory testing (i.e., falsification) necessitates avoidance of type 1 errors and this is difficult with an algorithm that, by default, inflates path coefficients through the researcher’s own hypotheses. Accordingly, in their recent reply to Rönkkö and Evermann,Henseler et al. (2014) stress the advantages of PLS particularly for more exploratory research—and this is also what we argued above.
Second, in terms of demonstrating the specifics of the PLS approach, the applied example study has the limitation that it works with a fairly large sample and, hence, does not provide an appropriate illustration of the ability of PLS to work with relatively small samples. Discussions on this aspect, however, can be found, e.g., inWold (1989),Barclay, Higgins and Thompson (1995), orChin and Newsted (1999). By conducting a Monte Carlo simulation study, the latter find that PLS can provide information about the appropriateness of indicators at a sample size as low as n = 20. However, as we also state above, when determining the utility of small samples, researchers need to carefully consider factors such as
distributional characteristics of data, the psychometric properties of variables, and the magnitude of structural relationships before applying PLS or CB-SEM.
Under careful consideration of these limitations the paper presented hereoffers methodological arguments that can encourage the use of PLS-SEM in the field and enrich public relations research both statistically and conceptually. Going beyond the context of evaluation, more methodological discussions and applications of PLS-SEM to different subfields in public relations research are welcome to further demonstrate and assess the potential of PLS-SEM for the wider public relations research domain.
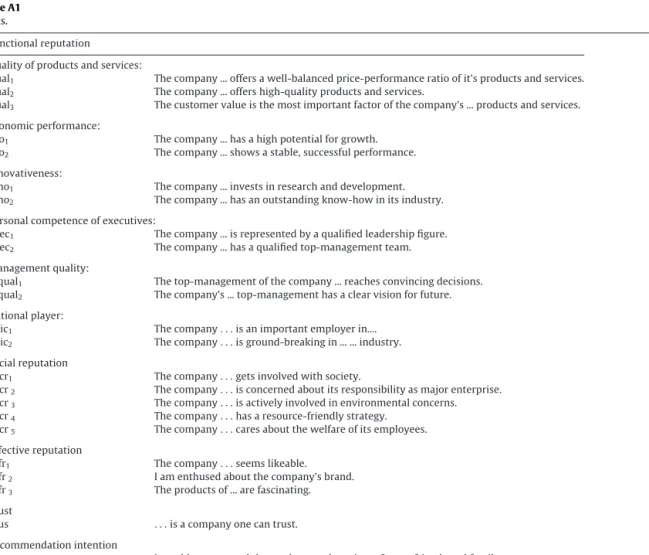
Appendix A.
Table A1
Items.
Functional reputation
Quality of products and services:
Qual1 The company ... offers a well-balanced price-performance ratio of it’s products and services.
Qual2 The company ... offers high-quality products and services.
Qual3 The customer value is the most important factor of the company’s ... products and services. Economic performance:
Eco1 The company ... has a high potential for growth.
Eco2 The company ... shows a stable, successful performance.
Innovativeness:
Inno1 The company ... invests in research and development.
Inno2 The company ... has an outstanding know-how in its industry.
Personal competence of executives:
Exec1 The company ... is represented by a qualified leadership figure.
Exec2 The company ... has a qualified top-management team.
Management quality:
Mqual1 The top-management of the company ... reaches convincing decisions.
Mqual2 The company’s ... top-management has a clear vision for future.
National player:
Nsic1 The company. . . is an important employer in....
Nsic2 The company. . . is ground-breaking in ... ... industry.
Social reputation
Socr1 The company. . . gets involved with society.
Socr2 The company. . . is concerned about its responsibility as major enterprise.
Socr3 The company. . . is actively involved in environmental concerns.
Socr4 The company. . . has a resource-friendly strategy.
Socr5 The company. . . cares about the welfare of its employees.
Affective reputation
Affr1 The company. . . seems likeable.
Affr2 I am enthused about the company’s brand.
Affr3 The products of ... are fascinating.
Trust
Trus . . . is a company one can trust.
Recommendation intention
Reco I would recommend the products and services of. . . to friends and family.
Table A2
Correlations (Pearson) between global measure and formative items (all are significant if p≤ .05). Constructs and items: Financial analysts
Global measure reputation
Employees
Global measure reputation
Early adopters
Global measure reputation
Politicians
Global measure reputation Functional-cognitive reputation
Product & service quality
Price-performance ratio .413 .399 .552 .431
Quality of P&S .435 .268 .589 .482
Customer value of P&S .318 .329 .521 .323
Economic performance
Table A2 (Continued)
Constructs and items: Financial analysts
Global measure reputation
Employees
Global measure reputation
Early adopters
Global measure reputation
Politicians
Global measure reputation
Economic stability .386 .274 .519 .446
Management quality
Strategic decisions .367 .402 .489 .403
Visions for the future .334 .427 .499 .413
Innovativeness
R&D investment .304 .322 .414 .362
Know-how .240 .279 .500 .354
Personal competence of executives
CEO-competence .350 .422 .489 .416 Top management-team .390 .459 .501 .454 National player Role as employer .285 .219 .394 .288 Ground-breaking in industry .342 .337 .554 .455 Social reputation Social engagement .220 .357 .486 .352 Social responsibility .322 .437 .496 .402 Resource-friendly .278 .312 .459 .288 Welfare of employees .250 .406 .357 .228 Environmental commitment .201 .205 .434 .275 Table A3
Ranked reputation value drivers in the different stakeholder groups. Constructs and items: Financial Analysts
Weights/t-values Employees Weights/t-values Early Adopters Weights/t-values Politicians Weights/t-values Functional reputation .37 Quality of P&S .24 Price/perform. .24 Know-how .16Customer value .14 Role as employer .13 Ground-breaking .10 Growth potential .23 Top mgmt. .21 Price/perform. .16 Role as employer .16 Ground-breaking .15Customer value .14 Quality of P&S .12 Know-how .10 Invest. in R&D .09 Econ. stability .08 Growth potential .35 Price/perform. .30 Quality of P&S .12Customer value .11 Ground-breaking .09 Know-how .08 Invest. in R&D .25Customer value .24 Quality of P&S .24 Price/perform. .15 Role as employer .12 Econ. stability .10 Know-how .09 Invest. in R&D Social reputation .41 Soc. responsibility .32 Welfare of emp. .29 Env. engagement .26 Resource-friendly .45 Soc. responsibility .32 Welfare of emp. .27 Resource-friendly .19 Env. engagement .42 Soc. responsibility .28 Soc. engagement .24 Resource-friendly .16 Welfare of emp. .42 Soc. responsibility .39 Soc. engagement .22 Resource-friendly .16 Env. engagement .16 Welfare of emp. Affective reputation .88 Enthusiasm for CB .81 Fascinating prod. .79 Sympathy .85 Enthusiasm for CB .81 Sympathy .79 Fascinating prod. .91 Enthusiasm for CB .89 Sympathy .87 Fascinating prod. .84 Enthusiasm for CB .81 Sympathy .80 Fascinating prod. References
Amec. (2010) Barcelona declaration of measurement principles. London: AMEC; available at:
http://amecorg.com/wp-content/uploads/2011/08/Barcelona Principles for PR Measurement.pdf[accessed: 20.01.14].
Bagozzi, R., & Fornell, C. (1982).Theoretical concepts, measurement and meaning. In C. Fornell (Ed.), A second generation of multivariate analysis (pp. 24–38). New York: Praeger.
Barclay, D., Higgins, C., & Thompson, R. (1995).The partial least squares approach to casual modeling: personal computer adoption and use as an illustration. Technology, 2(2), 285–309.
Baron, R. M., & Kenny, D. A. (1986).The moderator–mediator variable distinction in social psychological research. Journal of Personality and Social Psychology, 51(6), 1173–1182.
Neville, Benjamin A., Bell, Simon J., & Mengüc¸, Bülent. (2005).Corporate reputation, stakeholders and the social performance-financial performance relationship. European Journal of Marketing, 39(9/10)
Bollen, K. A. (1984).Multiple indicators: internal consistency or no necessary relationship? Quality and Quantity, 18(4), 377–385.
Bollen, K., & Lennox, R. (1991).Conventional wisdom on measurement: a structural equation perspective. Psychological Bulletin, 110(2), 305–314.
Boomsma, A., & Hoogland, J. J. (2001).The robustnes of LISREL modeling revised. In R. Cudeck, S. du Toit, & D. Sörbom (Eds.), Structural equation modeling: present and future (pp. 139–168). Chicago, IL: Scientific Software International.
Bowerman, B. L., & O’Connell, R. (2000).Linear statistical models: an applied approach (2nd ed.). Belmont, CA: Duxbury.
Bromley, D. B. (2000).Psychological aspects of corporate identity, image and reputation. Corporate Reputation Review, 3(3), 240–252.
Buhmann, A., & Ingenhoff, D. (2015).Advancing the country image construct from a public relations perspective: from model to measurement. Journal of Communication Management, 19(1), 62–80.
Caruana, A., Cohen, C., & Krentler, K. A. (2006).Corporate reputation and shareholders’ intentions: an attitudinal perspective. The Journal of Brand Management, 13(6), 429–440.
de Castro, G. M., López, J. E. N., & Sáez, P. L. (2006).Business and social reputation: exploring the concept and main dimensions of corporate reputation. Journal of Business Ethics, 63(4), 361–370.
Chen, Y.-R. R. (2013).Exploring environmental scanning for China’s government information: a government official’s perspective. Public Relations Review, 39(5), 581–583.
Chin, W. W. (2010).How to write up and report PLS analyses. In V. E. Vinzi, W. W. Chin, J. Henseler, & H. Wang (Eds.), Handbook of partial least squares. Concepts, methods, applications (pp. 655–690). Heidelberg: Springer.
Chin, W. W., Peterson, R. A., & Brown, S. P. (2008).Structural equation modeling in marketing: some practical reminders. The Journal of Marketing Theory and Practice, 16(4), 287–298.
Chin, W. W., & Newsted, P. R. (1999).Structural equation modeling analysis with small samples using partial least squares. In R. H. Hoyle (Ed.), Statistical strategies for small sample research (pp. 307–342). Thousand Oaks, CA: Sage.
Chun, R. (2005).Corporate reputation: meaning and measurement. International Journal of Management Reviews, 7(2), 91–109.
Chung, J. Y., Lee, J., & Heath, R. L. (2013).Public relations aspects of brand attitudes and customer activity. Public Relations Review, 39(5), 432–439.
Cortina, J. M. (2014).Introduction to the point/counterpoint on partial least squares. Organizational Research Methods, 17(2), 163.
Cudeck, R., & Henly, S. J. (2003).A realistic perspective on pattern representation in growth data: comment on Bauer and Curran. Psychological Methods, 8(3), 378–383.
Cutler, A. (2004).Methodical failure: the use of case study method by public relations researchers. Public Relations Review, 30(3), 365–375.
De Bussy, N. M., & Suprawan, L. (2012).Most valuable stakeholders: the impact of employee orientation on corporate financial performance. Public Relations Review, 38(2), 280–287.
Diamantopoulos, A., Sarstedt, M., Fuchs, C., Wilczynski, P., & Kaiser, S. (2012).Guidelines for choosing between multi-item and single-item scales for construct measurement. Journal of the Academy of Marketing Science, 40(3), 434–449.
Diamantopoulos, A., & Siguaw, J. A. (2000).Introducing Lisrel: a guide for the uninitiated. London: SAGE.
Diamantopoulos, A., & Winklhofer, H. M. (2001).Index construction with formative indicators: an alternative to scale development. Journal of Marketing Research, 38(2), 269–277.
Einwiller, S. A., Carroll, C. E., & Korn, K. (2010).Under what conditions do the news media influence corporate reputation? The roles of media dependency and need for orientation. Corporate Reputation Review, 12(4), 299–315.
Eisenegger, M., & Imhof, K. (2008).The true, the good and the beautiful: reputation management in the media society. In A. Zerfaß, B. van Ruler, & K. Sriramesh (Eds.), Public relations research: european and international perspectives and innovations (pp. 125–146). Wiesbaden: VS.
Everett, J. L., & Johnston, K. A. (2012).Toward an ethnographic imperative in public relations research. Public Relations Review, 38(4), 522–528.
Fombrun, C. J. (1998).Indices of corporate reputation: an analysis of media rankings and social monitors’ ratings. Corporate Reputation Review, 1(4), 327–340.
Fornell, C., & Bookstein, F. L. (1982).Two structural equation models: LISREL and PLS applied to consumer exit-voice theory. Journal of Marketing Research, 19(4), 440–452.
Fornell, C., & Larcker, D. F. (1981).Evaluating structural equation models with unobservable variables and measurement error. Journal of Management Research, 18(1), 39–50.
Freeman, R. E. (1984).Strategic management: a stakeholder approach. Boston: Pitman.
Goodhue, D. L., Thompson, R., & Lewis, W. (2013).Why you shouldn’t use PLS: four reasons to be uneasy about using PLS in analyzing path models. proceedings of the 46th Hawaii international conference on system sciences (HICSS), 4739–4748.
Goodhue, D., Lewis, W., & Thompson, R. (2006).PLS, small sample size, and statistical power in MIS research. Proceedings of the 39th annual Hawaii international conference on system sciences, 2006. HICSS’06, 202b (Bd. 8,).
Grunig, L. A., Grunig, J. E., & Dozier, D. M. (2002).Excellent public relations and effective organizations: a study of communication management in three countries. Mahwah, N.J: Lawrence Erlbaum.
Hair, J. F., Black, B., Anderson, R. E., & Tatham, R. L. (2006).Multivariate data analysis (6th ed.). Upper Saddle River, N.J: Pearson Prentice Hall.
Hair, J. F., Ringle, C. M., & Sarstedt, M. (2011).PLS-SEM: Indeed a silver bullet. The Journal of Marketing Theory and Practice, 19(2), 139–152.
Hair, J. F., Sarstedt, M., Pieper, T. M., & Ringle, C. M. (2012).The use of partial least squares structural equation modeling in strategic management research. Long Range Planning, 45(5/6), 320–340.
Hair, J. F., Sarstedt, M., Ringle, C. M., & Mena, J. A. (2012).An assessment of the use of partial least squares structural equation modeling in marketing research. Journal of the Academy of Marketing Science, 40(3), 414–433.
Helm, S. (2005).Designing a formative measure for corporate reputation. Corporate Reputation Review, 8(2), 95–109.
Henseler, J. (2012).Why generalized structured component analysis is not universally preferable to structural equation modeling. Journal of the Academy of Marketing Science, 40(3), 402–413.
Henseler, J., Dijkstra, T. K., Sarstedt, M., Ringle, C. M., Diamantopoulos, A., Straub, D. W., et al. (2014).Common beliefs and reality about PLS: comments on Rönkkö and Evermann. Organizational Research Methods, 17(2), 182–209.
Henseler, J., Ringle, C. M., & Sinkovics, R. R. (2009).The use of partial least squares path modeling in international marketing. Advances in International Marketing, 20, 277–319.
Hosmer, L. T. (1995).Trust: the connecting link between organizational theory and philosophical ethics. The Academy of Management Review, 20(2), 379–403.
Ingenhoff, D., & Sommer, K. (2007).Does ethical behaviour matter? How corporate social responsibility contributes to organizational trustworthiness. In 57th Annual Conference of the International Communication Association (ICA).
Ingenhoff, D., & Sommer, K. (2008).The interrelationships between corporate reputation, trust and behavioral intentions: a multi-stakeholder approach. In 58th Annual Conference of the Interna-tional Communication Association (ICA).
Ingenhoff, D., & Sommer, K. (2010).Spezifikation von formativen und reflektiven Konstrukten und Pfadmodellierung mittels Partial Least Squares zur Messung von Reputation. In J. Woelke, M. Maurer, & O. Jandura (Eds.), Forschungsmethoden für die Markt- und Organisations-kommunikation (pp. 246–288). Köln: Herbert von Halem.
Jarvis, C. B., MacKenzie, S. B., & Podsakoff, P. M. (2003).A critical review of construct indicators and measurement model misspecification in marketing and consumer research. Journal of Consumer Research, 30(2), 199–218.
Jiang, H. (2012).A model of work–life conflict and quality of employee–organization relationships (EORs). Public Relations Review, 38(2), 231–245.
Jöreskog, K. G. (1978).Structural analysis of covariance and correlation matrices. Psychometrika, 43(4), 443–477.
Jöreskog, K. G., & Wold, H. (1982).The ML and PLS techniques for modeling with latent variables. In Wold Herman, & Karl G. Jöreskog (Eds.), Systems under indirect observation (pp. 263–270). Amsterdam: North-Holland.
Ki, E.-J. (2013).A model of an organization–public relationship for the banking industry. Public Relations Review, 39(3), 216–218.
Kim, H. K., & Niederdeppe, J. (2013).The role of emotional response during an H1N1 influenza pandemic on a college campus. Journal of Public Relations Research, 25(1), 30–50.
Kiousis, S., Popescu, C., & Mitrook, M. (2007).Understanding influence on corporate reputation. Journal of Public Relations Research, 19(2), 147–165.
Kock, N., & Mayfield, M. (2015).PLS-based SEM algorithms: the good neighbor assumption, collinearity, and nonlinearity. Information Management and Business Review, 7(2), 113–130.
Lee, S., & Hong, H. (2012).International public relations’ influence on media coverage and public perceptions of foreign countries. Public Relations Review, 38(3), 491–493.
Ley, P. (1972).Quantitive aspects of psychological assessment. London: Duckworth.
MacCallum, R. C., & Browne, M. W. (1993).The use of causal indicators in covariance structure models: some practical issues. Psychological Bulletin, 114(3), 533–541.
Marcoulides, G. A., & Saunders, C. (2006).PLS: a silver bullet? Management Information Systems Quarterly, 30(2), iii–ix.
McIntosh, C. N., Edwards, J. R., & Antonakis, J. (2014).Reflections on partial least squares path modeling. Organizational Research Methods, 17(2), 210–251.
Nunnally, J. C. (1978).Psychometric methods (3th ed.). New York: McGraw-Hill.
Nunnally, J. C., & Bernstein, I. H. (1994).Psychometric theory. New York: McGraw-Hill.
Pasadeos, Y., Berger, B., & Renfro, R. B. (2010).Public relations as a maturing discipline: an update on research networks. Journal of Public Relations Research, 22(2), 136–158.
Pasadeos, Y., Lamme, M. O., Gower, K., & Tian, S. (2011).A methodological evaluation of public relations research. Public Relations Review, 37(2), 163–165.
Pedhazur, E. J., & Pedhazur Schmelkin, L. P. (1991).Measurement, design, and analysis: an integrated approach. Hillsdale, N.J: Lawrence Erlbaum Associates.
Reinartz, W., Haenlein, M., & Henseler, J. (2009).An empirical comparison of the efficacy of covariance-based and variance-based SEM. International Journal of Research in Marketing, 26(4), 332–344.
Rigdon, E. E. (1998).Structural equation modeling. In G. A. Marcoulides (Ed.), Modern methods for business research (pp. 251–294). Mahwah, N.J: Lawrence Erlbaum.
Ringle, C. M., Wende, C. M., & Will, A. (2005). SmartPLS 2.0. Hamburg.
Rönkkö, M. (2014).The effects of chance correlations on partial least squares path modeling. Organizational Research Methods, 17(2), 164–181.
Rönkkö, M., & Evermann, J. (2013).A critical examination of common beliefs about partial least squares path modeling. Organizational Research Methods, 16(3), 425–448.
Roldán, J. L., & Sánchez-Franco, M. J. (2012).Variance-based structural ecuation modeling: guidelines for using partial least squares in information systems research. In M. Mora, O. Gelman, A. Steenkamp, & M. S. Raisinghani (Eds.), Research methodologies, innovations and philosophies in software systems engineering and information systems (pp. 193–221). Hershey: IGI Global.
Rossiter, J. R. (2002).The C-OAR-SE procedure for scale development in marketing. International Journal of Research in Marketing, 19(4), 305–335.
Schwaiger, M. (2004).Components and parameters of corporate reputation: an empirical study. Schmalenbach Business Review, 56(1), 46–71.
Sisco, H. F., Collins, E. L., & Zoch, L. M. (2011).Breadth or depth? A content analysis of the use of public relations theory. Public Relations Review, 37(2), 145–150.
Smith, B. G. (2012).Public relations identity and the stakeholder–organization relationship. Public Relations Review, 38(5), 838–845.
Song, Y., Kim, D., & Han, D. (2013).Risk communication in South Korea: social acceptance of nuclear power plants (NPPs). Public Relations Review, 39(1), 55–56.
Temme, D., Kreis, H., & Hildebrandt, L. (2010).A comparison of current PLS path modeling software. In V. E. Vinzi, W. W. Chin, J. Henseler, & H. Wang (Eds.), Handbook of partial least squares. Concepts, methods, applications (pp. 713–736). Berlin: Springer.
Tenenhaus, M., Vinzi, V. E., Chatelin, Y.-M., & Lauro, C. (2005).PLS path modeling. Computational Statistics & Data Analysis, 48(1), 159–205.
Tong, S.-C. (2013).Media reputation in initial public offerings: a study of financial news coverage in Hong Kong. Public Relations Review, 39(5), 470–483.
Vilares, M. J., Almeida, M. H., & Coelho, P. S. (2010).Comparison of likelihood and PLS estimators for structural equation modeling. In V. E. Vinzi, W. W. Chin, J. Henseler, & W. Huiwen (Eds.), Handbook of partial least squares (pp. 289–306). Berlin: Springer.
Wartick, S. L. (2002).Measuring corporate reputation: definition and data. Business & Society, 41(4), 371–392.
Weberling, B., & Waters, R. D. (2012).Gauging the public’s preparedness for mobile public relations: the text for Haiti campaign. Public Relations Review, 38(1), 51–55.
Wold, H. (1982).Soft modeling: the basic design and some extensions. In K. G. Jöreskog, & H. Wold (Eds.), Systems under indirect observation, Part 2 (pp. 1–54). Amsterdam: North-Holland.
Wold, H. (1985).Partial least squares. In S. Kotz, & N. L. Johnson (Eds.), Encyclopedia of statistical science (pp. 581–591). New York: Wiley.
Wold, H. (1989).Introduction the second generation of multivariate analysis. In H. Wold (Ed.), Theoretical empiricism (pp. 153–173). New York: Paragon House.