Academic and Research Staff
Prof. S. K. Burns Prof. W. A. Rosenblith Dr. R. D. Hall
Prof. J. J. Guinan, Jr. Prof. W. M. Siebert Dr. N. Y. S. Kiang** Prof. R. W. Henryf Prof. T. F. Weiss*tff R. M. Brown** Prof. P. G. Katona Prof. M. L. Wiederhold** A. H. Crist** Prof, N. P. Morayt Dr. J. S. Barlowjl W. F. Kelley Prof. W. T. Peake** Dr. A. Borb6ly** L. Siphel
N. I. Durlach
Graduate Students
T. Baer D. A. Garbin A. V. Reed
J. E. Berliner Z. Hasan R. S. Stephenson
L. D. Braida A. J. M. Houtsma A. P. Tripp
H. S. Colburn E. C. Moxon B. A. Twickler
P. Demko, Jr. D. R. Wolfe
A. AN EXTENSION OF A NEURON MODEL OF ten HOOPEN
In 1941, Landahl proposed a modification of the "one-factor" and "two-factor" neuron models of Rashevsky, Blair, Hill, Monnier, and Young in an attempt to account for fluctuations in the excitability of axons such as had been observed in the 1930's by Blair and Erlanger, Monnier and Jasper, and Pecher, and more recently by Verveen. Mathe-matically similar models have often been suggested in efforts to explain other
phenom-ena, such as the distribution of intervals between firings or action potentials occurring "spontaneously" or under conditions of steady stimulation in many neurons (for a review, see Moore, Perkel, and Segundo2). All of these models share the idea illustrated in
This work was supported principally by the National Institutes of Health (Grant 1 PO1 GM-14940-02), and in part by the Joint Services Electronics Programs (U. S. Army, U. S. Navy, and U. S. Air Force) under Contract DA 28-043-AMC-02536(E).
tVisiting Associate Professor from the Department of Physics, Union College, Schenectady, New York.
TVisiting Associate Professor from the Department of Psychology, University of Sheffield, Sheffield, England.
Also at the Eaton-Peabody Laboratory, Massachusetts Eye and Ear Infirmary, Boston, Massachusetts.
t"Research
Associate in Preventive Medicine, Harvard Medical School, Boston, Massachusetts.tResearch Affiliate in Communication Sciences from the Neurophysiological Lab-oratory of the Neurology Service of the Massachusetts General Hospital, Boston, Massachusetts.
Postdoctoral Fellow from the Brain Research Institute, University of Zurich, Zurich, Switzerland.
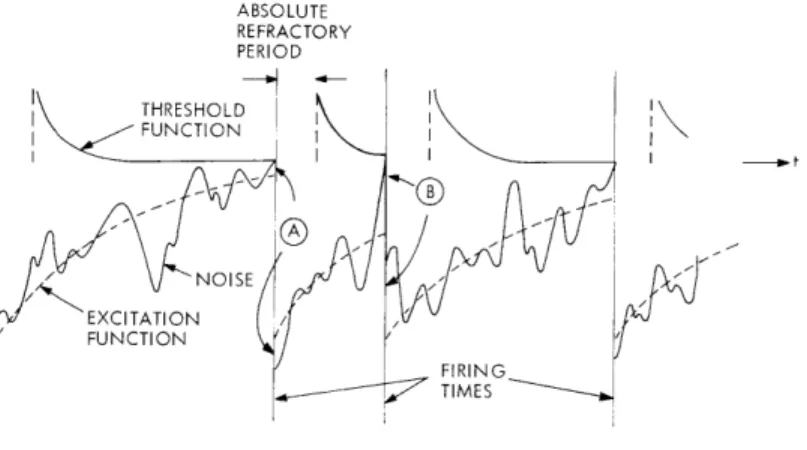
Fig. XVII-1; firings are assumed to be initiated whenever a stimulus-dependent "exci-tation function" crosses through a recovery-dependent "threshold function." By adjusting the shapes of these functions, it is possible to make the model reflect such observed phenomena as absolute and relative refractory periods, strength-duration curves, accommodation, and so forth. To account for the observed variability, internal noise (of presumably thermal or some other intrinsic origin) is assumed to be added to either the excitation or threshold functions, or both.
ABSOLUTE REFRACTORY PERIOD
Fig. XVII-1.
Classical neuron model.
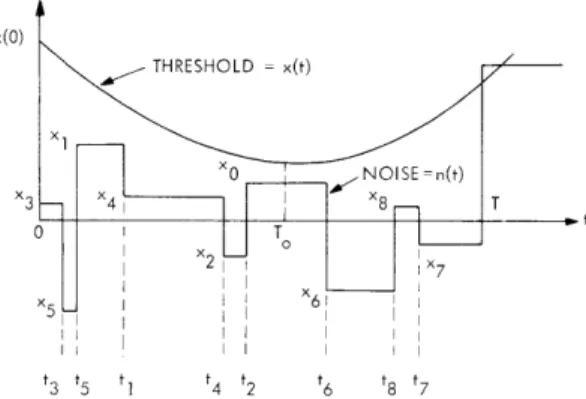
For purposes of analysis, the problem can be simplified to the determination of the statistics of the "first passage time" of a noise waveform, n(t), through a time-dependent critical level, x(t) (see Fig. XVII-2). Unfortunately, even this apparently simple problem has long defied analysis if n(t) is a sample function from any ordinary random process
THRESHOLD = x(t)
Fig. XVII-2. Fundamental mathematical problem.
(e. g. , a Gaussian random process). Ten Hoopen et al.3 have suggested a special form for the noise process, however, which has, perhaps, limited physical appeal but per-mits exact analysis. Moreover, simulations suggest that the statistics of the first pas-sage time for this special process are both qualitatively and quantitatively similar to
those for a Gaussian process with a similar spectrum. The purpose of this report is to present a more direct derivation of the formulas given by ten Hoopen and his
co-workers that corrects several minor errors in their results and permits some inter-esting extensions.
The problem to be analyzed is illustrated in Fig. XVII-3. The noise n(t) is a "random step function" process. Changes in level are assumed to be uniformly and
x(O) THRESHOLD x(t) 0NOISE=n(t) 0 T x2 X7 x5 6 t3 t5 tl t4 f2 t6 t8 t7
Fig. XVII-3. Model of ten Hoopen and co-workers.
independently distributed at random with rate k changes/sec (i. e., in accordance with a Poisson process with parameter
k).
The levels in successive intervals areindependent Gaussian random variables with zero means and unit variances. The power spectral density of this process can readily be shown to be
2N
S() 2 2' (1)
which corresponds to a single-time-constant lowpass filter with half-power frequency X/2Tr Hz. x(t) is a specified function of time which we shall assume either to be mono-tonically decreasing or to have one local minimum (as shown) at the time t = T .
Exten-o
sions to more general shapes of x(t) could easily be carried out if desired.
If we knew that level changes had occurred at the n (unordered) times tl t2 .
tn
prior to T and at the m (unordered) times tn+ tn ... t between T and T, then it is an immediate consequence of the assumed shape of x(t) thatPr [no crossing in 0 < t < T n, m, t ... tn+m]
Pr [xo<x(To)]
7T
Pr [xi<x(ti)], (2)1
where x. is the random variable describing the level just before t. if t < T i or the level
just after ti if ti
>
To (x corresponds to the interval containing T ).
Since we have
assumed that the
x.'s
1are Gaussian with zero means and unit variances,
Pr [xi<x(t
i)
x(t(x) dx,
(3)
-00
where
(x) = - e (4)
2--From the properties of Poisson processes, it follows that the probability density of the
unordered times t
1...
tn+
mjointly with n and m is
p(n, m, t
1. ' ' tn+m)
=n
1
T
O0
1
T--T 0 m (XTo)e
n! -XTo [x(T-T )]em!
m! -X(T-T ) Xn+m -XT - me-n!m!
Consequently,
Pr [no crossing in 0 < t
<
T] =
•-0. dt 1 0 1 dt ... n 0 T Tdt dt T n+1 n+mCarrying out the integrations, we have
Pr [no crossing in 0 <t<T]
=
x(T)
Y-00
n+m n!m! Pr [x <x(To)] c(x)dx
exp
-Xk
Y
I
-0- - 0 n+rm 7T Pr[xi<x(ti)]. 14(x) dx dt.
In deriving (7) we have explicitly assumed that T
>
T
o.
derivation will show that (7) should be replaced by
For T < To, a review of the
Pr [no crossing in
0
<t<T]
"-o 0(x)
dx exp
(x) dx exp f-, -x(t)
-0oo(x) dx dt .
(8)
If p(t) is the probability density for the first passage time, we can write
Pr [no crossing in 0 < t < T]
=
YT p(t) dt
To
so that
d
p(T) dT Pr [no crossing in 0 < t < T]. (10)
Note that p(T) will contain an impulse at the origin if x(0) < co, and
fo
p(t) dt may not equal 1 (i. e. , in some finite fraction of the trials there may be no crossing in 0 <t<oo). A specific example of this sort of behavior results if X = 0 and x(oo) > -oo. In this case00
u (T) y 0 (x) dx -
'[x(T)]
x(T); 0 < T < Tp(T)
x(0)
0elsewhere
(where uo(T) is a unit impulse at the origin). This result can readily be verified by ele-mentary methods.
An implicit assumption in the derivation leading to (7) and (8), which is particularly important if p(T) is to be interpreted as the interval distribution for a succession of firings under spontaneous or constant stimulus conditions, is that n(t) is restarted at random following each firing (as shown at "A" in Fig. XVII-1) rather than continued through the firing time (as shown at "B" in Fig. XVII-1). One consequence of this assumption is that successive intervals in the model will be statistically independent
- a result consistent with many but not all experimental observations. If the noise is continuous through the firing time, successive intervals will be positively correlated -strongly correlated if X is small - and the interval distribution will not be given by (7) and (8), since a large value of n(t) will produce a larger number of short intervals than the number of long intervals produced by a small value of n(t) lasting an equal length of time. For X 0, x(0) = oo, x(oo) = -co, the resulting interval density can readily be shown to be
- [x(T)] x(T) , T 0
p(T) = (12)
0 elsewhere
where T is the average value of T. This problem has been studied by Braitenberg, et al.4 and Stein,5 although their formulas analogous to (12) appear to be in error.
If, on the other hand, we are primarily interested in using the model of Fig. XVII-3 to account for such observations as those of Verveen and Pecher, then it makes little
difference what we assume about the continuity of n(t) through the firing time. In these experiments the latency and probability of response of frog sciatic nerve fibers to rela-tively brief current pulses of various amplitudes and durations were studied. Pulses
were presented sufficiently infrequently (several seconds apart) that successive responses appeared to be statistically independent. The responses of the model will be independent either if the noise is restarted following each firing or if the noise is con-tinuous and X is large enough so that the correlation time is small compared with the
inter-trial interval (i. e. , k >> 1 sec-l). This does not seem to be a very serious con-straint.
Verveen's observations on fluctuations in excitability of A-fibers in the frog sciatic nerve, as well as other similar preparations, are consistent with the assumption that
(in the present notation)
v-Iu(T)
Pr [no crossing in 0 < t < T] =
0
(x) dx,
(13)
where I is the amplitude, and T the duration of the excitation current pulse. (This for-mula is only valid for small values of T - less than ~3 msec. See DeBecker. ) Experi-mentally, v/u(T) has the typical shape of a strength-duration curve, for example,
v/u(T) a eb / T or a + b or etc. (14)
1-e
An interesting question is, then, Can we choose x(T) (as a function of I as well as T) and
k
(as possibly a function of I) so that the model of Fig. XVII-3 is consistent with (13)? One possible formal answer is immediately apparent; we can simply set X = 0, T0 = oo, andx(T) = v - Iu(T). (15)
Equation (8) is then identical with (13). This is, in effect, the assumption made by Landahl,7 Hagiwara,8 Verveen,1 and others.
Of course, as we have discussed, setting X = 0 requires formally that we assume that the noise n(t) is restarted following each firing-an assumption that has occasionally been criticized as physiologically unlikely. But, for small values of
k,
choosing x(T) as in (15) will cause (8) to correspond approximately with (13) for all T << 1/. On basi-cally these grounds, ten Hoopen and his associates have argued that N/2Tr might be as large as several hundred Hertz. Since this upper bound on N is substantially greater than the lower bound discussed previously, we may conclude that the model ofFig. XVII-3 accounts for Verveen's results if x(T) is given by (15) and if either X = 0 and the noise is restarted following each firing or if 1 << << 1000 sec-1 and the noise is continuous. Since, in fact, both Verveen and Pecher showed that successive trials were positively correlated if the inter-trial interval was much less than several seconds, it might be reasonable to favor the continuous alternative with N closer to its lower bound.
There is, however, still another alternative that is at least of theoretical interest. It is possible, by choosing x(t) to have a different form from (15) to satisfy (13) exactly
for a certain nonzero value of X that depends on I. The required form of x(t) has a single minimum at a point that is not known in advance; hence we must try to satisfy (13) for small T (ultimately <To) by finding an appropriate x(t) from (7), and for large T (ultimately >T o) by finding an appropriate x(t) from (8). The final solution will be obtained by joining the two pieces. In the process the values of X and To will be deter-mined.
We begin by observing that a necessary and sufficient condition on a function y(T) such that there exist a function x(T) satisfying the equation
y(T) =
x(T)
S(x) dx
(16)
is that 0 < y(T) < 1.
In terms of y(T), Eqs. 7 and 13 can be combined to give the
con-dition on y(T)
[-- f0 y(t) dt v-Iu(T)
[1-y(T
)] e =0
J- 0
4(x) dx,
T>T .
(17)Equation 17 can be solved for y(T) by taking logarithms and differentiating to give
4[v-Iu(T)] Iu(T)
Xy(T) =
Iv-Iu(T)
4(x)
dx
00o
T > To. (18)
For typical choices of the functions and parameters, the formula (18) is sketched in Fig. XVII-4. We choose the location of the maximum of this function as T
o. 241 I = 1.05 u(T) = 100(1-e- 3 T 18 v = 100 T IN msec 1.1 1.2 1.3 1.4
Fig. XVII-4.
On the other hand, for 0 < T <
be written
Sketch of Equation 18.
-k
f'
y(t) dt
v-lu(T)
[1-y(T)] e = S-- O0(x) dx.
Letting
T
-k
Jo
y(t) dt
z(T) = ewe can easily show that z(T) satisfies the differential equation
z(T) +
xz(T)
=X
v-Iu(T)
p(x) dxwhich can readily be solved subject to the boundary condition z(0) = 1 to give ultimately
1 y(T) 1 0v-Iu(T) z
-
-o
(x)
do
z(T) '-oo fv-IU(T) (x) dx -00 () x1
X(T-t)
00
f6 -
f (x) dx dtv-lu(T)
I
0<T<T .
oAgain for typical choices
tically in Fig. XVII-5 for
1.0
y(T) 0.5
0-of the parameters, y(T) 0-of (21) will appear as shown
schema-various values of X. It is always possible to find a value of X
I = 1.05 u(T) = 100(1-e- 3 T v = 100 X = 103 T IN msec X IN sec-
/
0.8 0.9 1.0 1.1 1.2 1.3 1.4Sketch of Equation 21. (Curves are schematic and
have not been accurately computed.)
such that the peak occurs at To as determined previously. For this value of y(To) determined from either (18) or (21) are, in fact, the same. The
- (18) for T > To and (21) for 0 <T < To - can then be joined to form0 o
of k, the values two branches a single y(T).
(19)
(20)(21)
Fig. XVII-5.
Moreover, it can be shown that 0 <y(T) < 1 so that (16) can be inverted to give x(T),
0 < T
<
oo, which will in general shape look not unlike Fig. XVII-3.
The noise
half-power frequency, X/2Tr, will generally be significantly greater for this model than could
be permitted under the condition T << 1/X.
I do not seriously propose the specific model corresponding to (18) and (21) as an
explanation of Verveen's observations.
For one thing, the noise process illustrated in
Fig. XVII-3 is physiologically rather unlikely.
Another possible difficulty is that the
bandwidth of the noise in this model is a function of the current level. [There are,
how-ever, ample reasons for believing that it is very likely that the actual noise parameters
in the neuron do depend in some way on stimulus conditions (see Poussart
9).]
But the
real trouble is simply that the whole analysis starting with (16) is a bit too sharp, too
ad hoc. The major point of this example is to show that it is possible in at least one
case to deduce the properties of the critical-level function and the noise from
measure-ments of probabilities of firing. It seems probable that a similar method could be
extended to a much wider range of problems.
But it is not clear how valuable such an
extension would be, since undoubtedly many different models would give similar results.
Indeed, most workers now seem to agree (see, e. g.
,
Verveen and Derksen
1 0)
that one
can not really expect to learn much about the character of the internal neural
mech-anisms by inference from external measurements (e. g.
,
latency distributions and
prob-abilities of firing). This is particularly true because, as I shall discuss elsewhere, this
entire class of neural models rests on rather shaky foundations.
W. M. Siebert
References
1. A. A. Verveen, "Fluctuations in Excitability," Thesis submitted to the University of
Amsterdam, 1961, and research report on signal transmission in nerve fibers (Drukkerij
Holland N.V., Amsterdam, 1961).
2. G. P. Moore, D. H. Perkel, and J. P. Segundo, "Statistical Analysis and Functional
Inter-pretation of Neuronal Spike Data," Ann. Rev. Physiol. 28, 493-522 (1966).
3. M. ten Hoopen, A. den Hartog, and H. A. Reuver, "Fluctuation in Excitability of Nerve
Fibers -A Model Study," Kybernetik 2, 1-8 (1963).
4. V. Braitenberg, G. Gambardella, G. Ghigo, and U. Vota, "Observations on Spike Sequences
from Spontaneously Active Purkinje Cells in the Frog," Kybernetik 2, 197-205 (1965).
5. R. B. Stein, "Some Models of Neuronal Variability," Biophys. J. 7, 37-68 (1967).
6. J. C. DeBecker, "Fluctuations in Excitability of Single Myelinated Nerve Fibers,"
Separa-tum Experimentia 20 (1964).
7. H. D. Landahl, "Theory of the Distribution of Response Times in Nerve Fibers," Math.
Biophys. 3, 141-147 (1941).
8. S. Hagiwara, "Analysis of Interval Fluctuations of the Sensory Nerve Impulse," Jap. J. Physiol. 4, 234-240 (1954).
9. D. J-M. Poussart, "Current Noise in the Nerve Membrane; Measurements under
Voltage-Clamp," Ph.D. Thesis, Department of Electrical Engineering, Massachusetts Institute of
Technology, Cambridge, Massachusetts, June 1968.
10. A. A. Verveen and H. E. Derksen, "Fluctuation Phenomena in Nerve Membrane," Proc.
B. PSYCHOPHYSICS OF INTENSITY RESOLUTION
1. Introduction
For many years, psychophysicists have attempted to characterize the manner in which we perceive relations among stimuli differing only in intensity by studying performance
in discrimination, detection, identification, and scaling experiments. Despite these efforts, our understanding of intensity perception is extremely limited. Not only are there many unsolved problems within each narrowly defined area, but little is known about how the results obtained in the different areas are related. One of the chief goals of our present research program is to develop a unified theory that will enable us to determine and understand these relations.
Preliminary work has focused on the problem of intensity resolution and has led to a tentative theory composed of two parts: a decision model, and an internal-noise model.
The decision model relates the experimental data to sensitivity and judgmental bias. The internal-noise model includes limitations imposed by imperfect sensors and imperfect memory, and relates the sensitivity to the stimulus set. Since our interest in
under-standing bias is secondary, no attempt has been made to construct a model for bias; we merely attempt to eliminate its effects when analyzing the data. Our primary interest
is the confusability of stimuli, and properties of responses that relate to other relations among stimuli (such as those used in constructing "psychophysical laws" by "direct methods") are ignored.1
Experiments to guide the development of this theory are being conducted on magni-tude estimation, category scaling, absolute identification, discrimination, and detection,
as well as short-term memory. In each experiment, the stimuli consist of pulsed tones (one-interval paradigms), or temporally ordered pairs of pulsed tones (two-interval para-digms), that are identical except for intensity. On each trial, the subject is presented with a stimulus Si selected at random from a stimulus set {Sil,<i<N, and is forced to chooseme} M2 a response Rm from a compatible set fRml<m<M of discrete responses. The detailed properties of the stimulus and response sets, as well as the specific task performed by the subject, depend upon the experiment. In all cases, however, the resulting data are used to estimate the conditional probabilities P(Rm/Si), and the structure of the matrix
[P(R /Si)]m, i is used to test the theory and/or evaluate certain parameters.
In this report, we will outline the preliminary theory and discuss some of its impli-cations. Comparisons with experimental data, as well as extensions and refinements of the theory, will be presented in future reports.
2. Decision Model
The decision model is a special case of Thurstone's "Law of Categorical Judgement" and is similar to that used in detection theory. For one-interval paradigms (such as
magnitude estimation, category scaling, and absolute identification) the axioms are:
(i) there exists a unidimensional continuum X that is observable to the subject (the
"decision axis") with the property that each stimulus presentation leads to a particular
value of X; (ii) there exist M + 1 "criteria" -oo = C < C ... <CM-1 < CM = oo on theo 1 M-1 M
X axis; (iii) the subject responds Rm if and only if Cm
l< X < C m; (iv) the conditional
probability density p(X/S
i) is Gaussian with mean [i(Si) and variance r (independent of
i); and (v) the criteria C
mare constant throughout an experiment.
We implicitly assume
that the stimuli S
i(which can be identified by the corresponding intensity Ii) are indexed
in the order of increasing intensity, that F(S
i) > [I(Si,) if and only if i > i', and that the
responses are ordered according to the relation R
mRm' if and only if m
m'.
The
subject's sensitivity is determined by the distance between the density functions p(X/Si),
and his bias by the criteria Cm.
Since our primary interest is sensitivity, attention is
focused on the density functions.
According to the model, the probabilities P(Rm/S ) and P(R >,Rm/S
i)are given by
P(Rm
/S)
=
m
p(X/Si) dX,
m-1 P(R > R m/S.) = P(Rm,/S i ) = p(X/Si) dX,m'>m
m-1
where
p(X/S)
= 1 exp[X-i(S)
2/22
Transforming to normal coordinates, one can show that
P(R >-Rm/Si)
=[Zi(m) ] ,where
1
2
(Z)
I
exp(-x
2/2) dx,
Z.i(m)
= [(Si)-C-1] /0.For any two stimuli S
iand Sj, one has
Z.i(m) =
Z.(m)
+ d'(Si, S.),
where
d'(S
i ,S
) = [ (Si)-p(S)
] /0
.Thus, the function Zi(Z ) [obtained by varying the response index m and referred to as
the "isosensitivity curve" or "receiver operating characteristic" (ROC)] is linear with
slope unity and intercept d'(Si, S.).
The sensitivity d' is independent of the criteria
Cm,
and depends only on the means and variance of the density functions. Also, d' is
addi-tive; for any three stimuli Si,
Sj, Sk, one has
d'(Si , Sk ) = d'(Si, S ) + d'(S , Sk).
The only two-interval paradigms that will be considered in this report are
"symmet-ric,
roving-level, discrimination" paradigms. The stimulus set in this case has the form
Si, S
iN/2 where Si
=(i,
I),
S
= (I,
Ii), and the intensity increment
I
exceeds unity for all i.
The task of the subject is to discriminate between the subsets
S =
{Si}
and S = S4. In other words, independently of the over-all level (indexed by i),
he must estimate which of the two intensities in the stimulus is the greatest.
These
paradigms, which are of great use in the study of memory, are generated from the
cor-responding fixed-level paradigms (the case N
=
2) by varying the over-all level of the
stimulus from trial to trial.
For these paradigms, the underlying decision space is two-dimensional, with one
coordinate X
1corresponding to the first interval and a second coordinate
X
2corre-sponding to the second interval, and the criteria
Cm
are curves in the X
1, X
2plane. For
our purposes, however, we reduce this space to one dimension by assuming that the
cri-teria are linear of slope unity in regions of high probability, and that the decision is
based on the value of X
=
X
1-
X
2.With these assumptions, the model is essentially
the same as for one-interval paradigms, except that the set of density functions on the
decision axis X consists of N/2 pairs p(X/Si), p(X/S'), and the set of criteria is
par-titioned into N/2 subsets {Cm,
M.
ROC
curves and sensitivities
d'
(S., S)
are
m, ilo<ms<M'
1
then obtained for each level.
3.
Internal-Noise Model
In the decision model, no consideration is given to the sources of the X-noise, or
how the density functions p(X/Si) describing this noise might be related in different
experiments.
The decision model merely relates the probabilities P(Rm/Si) to the
sen-sitivity d'. The purpose of the internal-noise model is to relate d' to the characteristics
of the stimuli.
We assume that there are two sources of X-noise: "sensation noise" and "memory
noise." With regard to the sensation noise, it is assumed that (i) there exists a
unidi-mensional "sensation continuum" Y with the property that each intensity I presented
to the subject leads to a value of Y; (ii) the conditional probability density p(Y/I) is
Gaussian with mean a(I) and variance
P2
(independent of I); and (iii) p(Y/I) is
indepen-dent of the experiment.
At present, we ignore the fact that the signals and sensations
are extended in time.
The relation of the Y-noise to the X-noise depends upon the particular paradigm and
the "memory operating mode" of the subject.
In the "sensory-trace rehearsal mode,"
it
is assumed that the subject attempts to maintain the "image" or "trace" of Y by
rehearsing (consciously or unconsciously). In
the "verbal context-coding mode," it
is
assumed that the subject attempts to compare Y with the general "context" of sounds
in the experiment, and to remember an imprecise verbal representation of this
compar-ison. In the trace mode, the noise results from a tendency of the trace to wander as a
function of time. The amount of noise depends upon the type and amount of
"interfer-ence."3 In the context-coding mode, the noise results from the inability of the subject
to determine the context precisely, and to determine or represent the relation of Y to
this context precisely. In this case, the amount of noise depends upon the size of the
context, larger contexts leading to greater noise. Whereas in the trace mode the effects
of the memory noise are dynamic and change with time, in the context mode the effects
are independent of time.
Specifically, it is assumed that the representation of the
com-parison if formed immediately after the sensation and is remembered perfectly. Also,
it is assumed that the statistics of the context are determined by the stimulus set and
the frequencies with which each stimulus is presented.
We ignore variations in context
resulting from variations in presentation order, the decay of context that occurs within
an experimental run during intervals of silence, and the transient effects at the beginning
of an experimental run associated with the establishment of the context. If the context
is small and the interference is severe, the amount of memory noise in the context mode
is smaller than in the trace mode.
On the other hand, if the context is large and there
is little interference, then the noise in the context mode exceeds that in the trace mode.
In neither mode do we account for the effects of feedback.
Assume now that an intensity I is presented at time t
=
0.
In the trace mode it is
assumed that (i) the sensation Y resulting from I leads to a trace Y(t) which is a
ran-dom function of t; and (ii) the conditional probability density p[Y(T)/Y] at time t
=
T is
Gaussian with mean Y and variance p2(T) =
f2(x)
dx, where f
2(x), the "interference
4
function," depends on the detailed nature of the interference in the interval 0
<
t
< T.
The conditional density p[Y(T)/I] is thus Gaussian with mean a(I) and variance
32+
p
2(T).
If the type of interference is constant throughout the interval (for example, the only
dis-turbance is the passage of time), it is assumed that f2(x) is a constant, and therefore,
that p 2(T) grows linearly with T.
In the context mode, it is
assumed that
(i) the sensation Y is
compared with the
con-text
of sensations determined from previous signals, and leads to a representation
Q;
and (ii) the conditional probability density p(Q/Y) is Gaussian with mean Y and variance
H2 W 2 , where H is a constant, and W is the width of the context (that is, the "effective" intensity range). 5 The conditional density p(Q/I) is thus Gaussian with mean a(I) and variance P2 + H2W 2
In one-interval paradigms, it is assumed that the subject operates in the context mode, and the decision variable X is identified with the representation Q. In this case, p(X/S) is the same as p(Q/I), L(S) = a(I), and 2 = P2 + H2W 2. Thus, for any two stimuli S. = I. and S. = I.,
1 1
j
;J
a(I
i)- a(I)
S '+2 2
In the two-interval paradigms, the subject may operate in the context mode or the trace mode, or he may combine the two modes. The decision variables for the indi-vidual modes are given by X = XQ = Q1- Q2 (context mode) and X = XT = Y1 (t)-Y 2 (trace mode), where T denotes the time between the first and second intervals. Thus
(Si) = -(S = a(Ii) - a I), o = 2(p 2
+
2), and[
*
a(i )-a (I
d'(Si, S) = d'l(Ii I i), (I Ii) J 2
2 2 2 2 2 2
where y , the "memory variance," is given by y = H W (context mode) and y = 2 = p (T)/2 (trace mode).2
In order to specify d' in more detail, we now make the following additional assump-tions: (i) p2(T)/2 = AT, where A is independent of T; (ii) a(I) = KlogI, where K is a
constant (Weber's law); and (iii) W = D[Klog (I max/Imin)] , where Imax and Imin are the extreme intensities in the stimulus set, and D is independent of I max/Imin . In general, the parameter A will depend upon the type of interference. Similarly, D may depend
on the number of stimuli, on how these stimuli are placed within the interval Imin to
Imax, and on the relative frequencies with which the various stimuli are presented. The detailed nature of these dependencies is important, but will not be considered here.
With these additional assumptions, the equations for d' can be rewritten: K log (li/Ij) d' (Iii I) =
2
2
NT K log (Ii/I ) d'( I I , , = (context mode)2 +
2
23
(
N
K log (I/I)
dI[ I., I , ] (trace mode),
where
y Q2 = H2 2 = [G log (I /Imi)]2
2 2
= p (T)/Z = AT
G = HDK.
The parameters
p,
K, G, and A are constants, except for the dependence of A on the type of interference, and the dependence of G (through D) on the distribution ofinten-sities. The ratios K/p, K/G, and K/N[-i can be determined empirically.
Consider, finally, the problem of how the two memory modes might be combined in the two-interval paradigms. The simplest assumption is that the subject operates in the mode that produces the greatest d' (so that the context mode is applicable if and only if
yQ
<
YT' and the trace mode if and only if yQ > YT). A second assumption is that the subject makes optimum use of the two modes on each trial and constructs the new deci-sion variable X = XQ, T = In [p(XQ, XT/S)/p(XQ, XT/S)] based on the two variables XQ and XT . If the increment Ii/I " to be discriminated is the same for all levels (and is known to the subject), it can then be shown thatJT K log (I/I )
d' i , (I, I) 1 (combined mode).
+ yq +YT
Whichever assumption is used, one concludes that T/- Q >> 1 implies y
=
yQ, and thatT/YQ << 1 implies y ' 4. Implications
Some of the implications of the theory (for example, the linearity of the isosensitivity curves) follow directly from the assumptions of the decision model. These implications are similar to those that have been considered extensively in connection with detection
theory, and do not require further discussion here. Other implications, however, depend upon the characteristics of the internal-noise model and are, therefore, rather different from those of detection theory.
extimation, category scaling, and absolute identification, in which the stimulus set is
the same for each experiment.
Under these conditions, the model makes the following
predictions.
1.
The sensitivity d'(I Ij) for any two intensities I and I. in the set is independent
of the experiment.
Thus, for example, the confusion matrix obtained in absolute
identi-fication is predictable (up to a transformation determined by response bias) from the
response variability measured in magnitude estimation. Also, the limitation on
identi-fication performance referred to as the "7
±2 phenomenon" (that is, the limitation on
information transfer) has a direct counterpart in the variability of magnitude
esti-mates.
2.
The cumulative d' function,
d'(I,
I min), provides a common underlying interval
scale for all such experiments.
The effect of changing the stimulus set is merely to
multiply the scale by a constant, and the form of the scale is always logarithmic.
73.
If two intensities I. and I. are held fixed, but I
/Imi
nis varied, then
[d'(Ii, I)]-2 will be a linear function of [log (Imax/Imin)]
2with slope GZ/K2[log (i/j
2
and intercept
p2/K2[log
(I/I
j)]2.
84.
If the context is large with respect to the sensation noise (yQ >>), then dl(I
i, Ij) is
inversely proportional to the range, log (Imax/Imin) 8 Also, the total d', d'(I ax/Imin),
is a constant and is independent of the range [d'(Imax/Imin)
=
K/G].
This result is a
restatement of the 7 ± 2 phenomenon in absolute identification.
It differs from the usual
statement in that the constraint appears as an upper bound on the total d' rather than the
information transfer, and it applies to a much wider variety of experiments.
5.
If the context is small with respect to the sensation noise (YQ <<P), then the
sen-sitivity d'(Ii,. Ij) for any two intensities I. and I. in the stimulus set is independent of the
context and depends only on the sensation parameters corresponding to I. and I..
This
1 J
implies, in particular, that the discriminability of any two intensities I. and I. that differ
1]
by a relatively small increment is the same whether they constitute the entire stimulus
set or are merely a small subset of a large number of intensities that span a small
inten-sity range.
In other words, the classical discrepancy between the sensitivity obtained
in conventional discrimination experiments and the sensitivity obtained in absolute
iden-tification experiments with large stimulus sets (observed when the stimulus range is
large), does not occur when the stimulus range is small.
Consider, next, the implications of the model for the roving-level discrimination
experiments.
Some of the predictions for this case (which are independent of exactly
how the context and trace modes are combined) are the following.
6.
In order for imperfections in memory to be an important limitation on d' (that
is, for the memory variance y2 to be large with respect to the sensation variance
2,
it is necessary that both the amount of interference and the range of levels be large. If
the interference is large, but the range is small, then y
=
yQ is small.
On the other
hand, if the range is large, but the interference is small, then y = YT is small.
In
gen-eral, the effect of interference will increase as the range of levels is increased, and the
effect of range will increase as the amount of interference is increased.
7.
If the amount of interference is small relative to the range of levels (so that
y= yT), then d' will increase as the interference is decreased, but will be essentially
independent of the range of levels. Moreover, if the type of interference is constant,
then (d)-2 will be a linear function of T with slope A/2K [log
/I
and intercept
2
/2K
2[log (Ii/I )] 2. If the amount of interference is large with respect to the
sensa-tion noise (so that y= YT >P)' then d' will be inversely proporsensa-tional to
f-T.
If the amount
of interference is small with respect to the sensation noise (so that y yT <<P), then d'
will depend only on the sensation noise and will be independent of T.
8.
If the amount of interference is large relative to the range of levels (so that
y;YQ), then d' will increase as the range of levels is decreased, but will be essentially
independent of the amount of interference.
Moreover, if I. and I. are held fixed, but
2
1 1Imax/Imin is varied, then (d)
-2will be a linear function of [log (I ma/I min)]
with slope
G
22K
2log (Ii/I )] 2 and intercept
p
2/2K
2[log (i/I)]
2.8 If the context is large with
respect to the sensation noise (so that
y=yQ
>>
p), then d' will be inversely proportional
to the range log (Imax /Imin).
If the context is small with respect to the sensation noise
(so that y=Q <<
),
then d' will depend only on the sensation noise and will be independent
of log (Imax /I
n).
Finally, if the set of levels used in the roving-level discrimination
experiment is used as the set of stimuli to be identified in a one-interval absolute
iden-tification experiment (so that the contexts are the same in the two experiments), then
the sensitivity d' obtained with discrimination will be equal to the sensitivity d' obtained
with identification (except for the factor N-7). If the interference in the discrimination
paradigm is weak, however, so that y < ,Q, then this equivalence will break down.
9N. I. Durlach, L. D. Braida
Footnotes and References
1. Our ignoring of these other properties, and our use of the word "bias," does not imply
that we think these other properties are unimportant or that they cannot be usefully
studied. It is merely that we do not want to consider them in our initial theory. At
present, our viewpoint is that of the communications engineer, and we are concerned
only with the information-destroying properties of the system.
Whether it is
appro-priate to define "loudness" in terms of these properties is another question.
2.
In magnitude estimation, the response set is usually regarded as the set of
non-negative real numbers.
The results are essentially the same, however, if the set
is restricted to the non-negative integers, or even to the first M non-negative
inte-gers, provided that M is sufficiently large.
3.
The word "interference" refers in this report to what is often called "retroactive
interference" (as opposed to "proactive interference") and is meant to include not
only the interpolation of extraneous stimuli and tasks, but also the pure passage of
time (usually referred to as "decay" rather than "interference").
4. If 0 < t1 2 < T, the conditional probability density p[Y(t2)/Y(t )] is Gaussian with mean Y(t) and variance p (t2 ) - P(t). The process Y(t) is a normal process with independent increments (and therefore Markovian). The assumptions that the mean of p[Y(T)/Y] is independent of T and that the variance of p[Y(T)/Y] is independent of Y, are made for simplicity. These assumptions, like the assumptions that
p2
and g2 are independent of intensity, will be generalized if and when it is necessary. This model for the trace mode is essentially the same as that proposed by R. A. Kinchla and F. Smyzer in "A Diffusion Model of Perceptual Memory," Perception and Psychophysics 2, 219-229 (1967).
5. A more detailed set of postulates for this mode (which reveals more fully the intu-itive notions behind it) is the following: (a) the sensation Y is compared with a gen-eral context of sensations derived from previous signals; (b) the context can be characterized by a mean M and a width W; (c) the comparison between Y and the context is achieved by computing (Y-M)/W; (d) the verbal representation Q of the comparison is degraded by an additive noise V (verbal-coding noise), so that
Q
= (Y-M)/W + V; (e) M, W, and V are independent Gaussian random variables with- 2 2 2 2
means M, W, and V = 0, and variances 2 (M), (W), and (V); (f) 2(M) is
pro-2 2
portional to W; and (g) the parameters a (V) and
a
(M)/W are independent of the experiment. Assuming that the random variations in the context width W are small, and making the approximations a(W) = 0 and W =W,
one can show that p(Q/Y) is Gaussian with mean (Y-M)/W and variance H2 = 2(V) + a (M)/W 2 . As far as the sensitivity d' is concerned, however, the mean and variance of p(Q/Y) can be written merely as Y and H2W2. Note also that the same results would be obtained for d' if we regard M as the "adaptation-level" of Helson, and assume thatQ
= Y - M and M is a Gaussian random variable whose variance is proportional to the context width W. See H. Helson, Adaptation-Level Theory (Harper and Row, New York, 1964).6. An attempt to relate the variability of magnitude estimates to confusions in identifi-cation has also been made by Luce and Mo. Their approach differs from ours in that they use a "choice model" rather than a Thurstonian decision model, they use the cardinal properties of the magnitude estimates (and the power law) rather than merely the ordinal properties, and they do not consider the effects of stimulus range. See R. D. Luce and S. S. Mo, "Magnitude Estimation of Heaviness and Loudness by Individual Subjects: A Test of a Probabilistic Response Theory," Brit. J. Math. and Statist. Psychol. 18, 159-174 (1965).
7. The conclusion that changing the stimulus set merely multiplies the scale by a con-stant is valid even if the scale is not logarithmic. According to the model, changes in the stimulus set cause changes in the scale only through the term W. Thus, if two different sets lead to the values W = W1 and W = W2, the scales obtained from these two sets will be related by the constant multiplicative factor [(+H2W2
)/
(2+HW 2 . Note also that essentially the same scale has been used by Garner in conjunction with absolute identification and category scaling experiments to mea-sure loudness. Although Garner was concerned with context effects, he (as Luce and Mo) did not construct any model to account for these effects. See W. R. Garner, "An Equal Discriminability Scale for Loudness Judgements," J. Exptl. Psychol. 43, 232-238 (1952); "Context Effects and the Validity of Loudness Scales," J. Exptl. Psychol. 48, 218-224 (1954); "Advantages of the Discriminability Criterion for a Loudness Scale," J. Acoust. Soc. Am. 30, 1005-1012 (1958).8. It is implicitly assumed here that the variations in the stimulus set which produce the variations in I max/Imin are chosen so that D, and therefore G, remains constant. 9. Studies of roving-level discrimination, and an attempt to relate roving-level
dis-crimination to identification, have been made by Pollack. His approach is similar to ours with respect to the concern for context. It differs, however, in that infor-mation transfer rather than sensitivity is used to evaluate performance, no account is taken of bias in relating discrimination to identification, and the role of interfer-ence is not considered. Furthermore, we question the specific model used to
compute the "equivalent information transfer" for discrimination. See I. Pollack, "Identification and Discrimination of Components of Elementary Auditory Displays," J. Acoust. Soc. Am. 28, 906-909 (1956).