HAL Id: hal-01112926
https://hal.archives-ouvertes.fr/hal-01112926
Submitted on 4 Feb 2015
HAL is a multi-disciplinary open access
archive for the deposit and dissemination of
sci-entific research documents, whether they are
pub-lished or not. The documents may come from
teaching and research institutions in France or
abroad, or from public or private research centers.
L’archive ouverte pluridisciplinaire HAL, est
destinée au dépôt et à la diffusion de documents
scientifiques de niveau recherche, publiés ou non,
émanant des établissements d’enseignement et de
recherche français ou étrangers, des laboratoires
publics ou privés.
A Near Real-Time Algorithm for Autonomous
Identification and Characterization of Honeypot Attacks
Philippe Owezarski
To cite this version:
Philippe Owezarski. A Near Real-Time Algorithm for Autonomous Identification and Characterization
of Honeypot Attacks. ACM Symposium on Information, Computer and Communications Security
(ASIACCS), Apr 2015, Singapour, Singapore. 12p. �hal-01112926�
A Near Real-Time Algorithm for Autonomous Identification
and Characterization of Honeypot Attacks
Philippe Owezarski
CNRS, LAAS, 7 avenue du colonel Roche, F-31400 Toulouse, France Université de Toulouse, LAAS, F-31400 Toulouse, France
[email protected]
ABSTRACT
Monitoring communication networks and their traffic is of essential importance for estimating the risk in the Internet, and therefore designing suited protection systems for com-puter networks. Network and traffic analysis can be done thanks to measurement devices or honeypots. However, an-alyzing the huge amount of gathered data, and characteriz-ing the anomalies and attacks contained in these traces re-main complex and time consuming tasks, done by network and security experts using poorly automatized tools, and are consequently slow and costly. In this paper, we present an unsupervised algorithm - called UNADA for Unsupervised Network Anomaly Detection Algorithm - for identification and characterization of security related anomalies and at-tacks occurring in honeypots. This automatized method does not need any attack signature database, learning phase, or labeled traffic. This corresponds to a major step towards autonomous security systems. This paper also shows how it is possible from anomalies characterization results to infer filtering rules that could serve for automatically configuring network routers, switches or firewalls. The performances of UNADA in terms of attacks identification accuracy are eval-uated using honeypot traffic traces gathered on the honeypot network of the University of Maryland. The time latency for producing such accurate results are also presented, es-pecially showing how the parallelization capabilities of the algorithm help reducing this latency.
Keywords
Honeypot attack identification, Anomaly characterization, unsupervised machine learning, big traffic data, autonomous security systems.
1. INTRODUCTION
Monitoring communication networks and their traffic is an important advance for protecting computers systems. Sev-eral methods exist. For example, using monitoring devices at the interconnection points of networks allows the analysis
Permission to make digital or hard copies of all or part of this work for personal or classroom use is granted without fee provided that copies are not made or distributed for profit or commercial advantage and that copies bear this notice and the full citation on the first page. To copy otherwise, to republish, to post on servers or to redistribute to lists, requires prior specific permission and/or a fee.
Copyright 20XX ACM X-XXXXX-XX-X/XX/XX ...$15.00.
of all incoming and outgoing flows. Another method consists in installing honeypots in the network. Honeypots provide more or less emulated services (according to the expected interaction level with the attackers), and allows supervising the use of the provided services by attackers. Thus, gathered data allows security experts on one hand to detect and ana-lyze computer systems weaknesses, and on the other hand to collect useful information on the attacker activities that al-lows the analysis of their attacking methods, objectives, and strategies. Estimating and analyzing the risk related to ille-gitimate activities on the Internet are essential for security experts to design and develop adapted and efficient defense and protection systems with regard to the actual risk.
Characterizing and classifying current anomalies and at-tacks of the Internet are very complex and time consuming tasks, done by experts. Such tasks are therefore slow and costly. The main difficulty related to the identification and analysis of the di↵erent classes of illegitimate traffic is their fast evolution, amplification, and renewing capabilities. De-signing autonomous identification and characterization pro-cesses is crucial for easy to deploy and to use defense tems. Hence, modern identification and classification sys-tems must not rely on human expert knowledge, and must be able to autonomously adapt to the evolution of all traffic components, be they legitimate or not (this paper obviously focuses on illegitimate ones). For this purpose, we propose to take advantage of unsupervised machine learning tech-niques that do not require the help of any human expert. In this paper we then present an unsupervised method for iden-tifying and characterizing anomalies and attacks contained in traffic gathered on honeypot networks. This method does not take advantage of any attack signature, learning stage, or labeled traffic, what constitutes a major advance towards autonomous security systems. This approach uses robust clustering techniques, as sub-space clustering, density-based clustering, and evidence accumulation for classifying flow ensembles in traffic classes, and builds easily understand-able associated signatures. This method was first proposed in our previous work [19] that aims at detecting, classify-ing and characterizclassify-ing anomalies in the full network traf-fic. This method has been adapted and extended in order to cope with the specific honeypot network traffic. Indeed, honeypot network traffic only contains illegitimate traffic (attacks, anomalies, intrusion attempts, ...) what signifi-cantly changes the way classification and characterization can be done. This paper mainly deals with taking into ac-count the illegitimate nature of traffic to be analyzed, and designing adapted and optimized identification and
charac-terization algorithms.
These algorithms are illustrated by the analysis of honey-pot traffic gathered at the University of Maryland, at the Netflow format [3]. The University of Maryland put mea-surement devices on routers at the border of the honeypots networks. This allows the capture of the traffic exchanged between honeypots and the Internet by monitoring only very few network devices. We nevertheless do not have the com-munication traces between the honeypots of the same net-work. The traffic traces we have been working on have been captured on a duration of more than one year.
The rest of the paper is as follows: section 2 presents related work in the domain of attack and anomalies detec-tion and characterizadetec-tion, covering the full set of approaches from signature to statistical profile based, and finishing with approaches based on data mining and machine learning, es-pecially unsupervised ones. This section also presents super-vised and semi-supersuper-vised classification methods. Section 3 presents our previous unsupervised anomaly detection algo-rithm. This algorithm has already been published in [19]. We nevertheless add a presentation of this algorithm in this paper to make it self-contained. Interested readers can find an extended version of the algorithms description in [18]. However this algorithm originally works on full traffic, i.e. normal traffic on Internet links, and the objective is then to detect anomalies and attacks. Given the nature of the traffic we are considering in this paper - i.e. traffic between honeypots and the Internet - we know that it is completely illegitimate. This is a strong hypothesis that can help go-ing further for characterizgo-ing and identifygo-ing the di↵erent component of this illicit traffic, and estimating the risk in the Internet. This section 3 then presents the sub-space clustering approach that aims at increasing the robustness of clustering algorithms, limiting its sensitivity, etc. It also presents the recombination mechanisms based on evidence accumulation and inter-clustering associations. As a strong improvement of the previous algorithm, section 4 describes how we can show correlation existing between clusters in di↵erent subspaces, these correlations exhibiting that such clusters could correspond to the same attack or anomaly. This is a strong help for more accurately and completely identifying and characterizing all attacks contained in the honeypots traffic. Section 5 then proposes a way to auto-matically characterize the identified anomalies and attacks. It relies on the clustering and correlation results. Section 6 proposes a method for ranking the risk an attack repre-sents. Such ranking is aimed at helping security experts or network operators to prioritize their work, focusing first on the most dangerous ones. Section 7 illustrates the results of this characterization algorithm by showing a set of attacks and anomalies that have been identified in the real traffic traces of the University of Maryland, and the characterizing signatures that have been issued. Section 8 presents the per-formance evaluation of our algorithm in terms of good iden-tification, especially comparing it with other unsupervised methods. Section 9 then explains the parallelization capabil-ities of our identification algorithm, and exhibits its strong performance in terms of low latencies, especially when com-putings can be e↵ectively parallelized on multi-processor or multi-core machines. Last, section 10 concludes this paper.
2. RELATED WORK
The problem of network anomaly detection has been
ex-tensively studied during the last decade. Most of the ap-proaches analyze statistical variations of traffic volume (e.g. number of packets, bytes or new flows) and/or traffic fea-tures (e.g. IP addresses and ports), using either single-link measurements or network-wide data. A non-exhaustive list of standard methods includes the use of signal processing techniques (e.g. ARIMA - Autoregressive Integrated Mov-ing Average - modelMov-ing, wavelets-based filterMov-ing) on sMov-ingle- single-link traffic measurements [2, 4], PCA (Principal Component Analysis) for network-wide anomaly detection [13–15], and Sketches applied to IP-flows [12, 17].
The simultaneous detection and characterization of traf-fic anomalies has also received quite a lot of attention in the past, but results are few and present important limita-tions, either because they rely on some kind of training data and/or anomaly signatures, or because they do not provide meaningful and tractable information to a human network operator, who has to take the final decision about the na-ture of the detected problem. Authors in [13] characterize network-wide anomalies in highly aggregated traffic (Origin-Destination flows or OD flows for short), using PCA and the sub-space approach [15]. An important limitation of this approach is that the information obtained from OD flow data is too coarse-grained to provide meaningful informa-tion to the network operator. Papers like Lakhina et al. [14] and Biang et al. [17] detect and characterize anomalies us-ing finer-grained traffic information, basically applyus-ing the same PCA approach to the sample entropy of the empirical distribution of specific traffic features. One clear limitation of these approaches is that the information they provide is not immediately usable and easy-to-understand by the net-work operator, who may not even be familiar with concepts distant from his tasks such as sample entropy. Besides, the PCA approach is highly sensitive to noise when used for anomaly detection [6, 22], requiring in practice a fine-tuning and data-dependent calibration step to work.
UNADA (Unsupervised Network Anomaly detection Al-gorithm) [5] falls within the unsupervised anomaly detection domain, a novel research area that has drawn quite a lot of interest in the research community, but that still represents a rather immature field. Most work on unsupervised net-work anomaly detection has been devoted to the IDS field, generally targeting the detection of network intrusions in the very well known KDD’99 dataset. The great major-ity of the detection schemes proposed in the literature are based on clustering techniques and outliers detection, be-ing [8, 16, 21] some examples. The objective of clusterbe-ing is to partition a set of unlabeled patterns into homogeneous groups of “similar” characteristics, based on some similar-ity measure. Outliers detection consists in identifying those patterns that do not belong to any of these clusters. In [21], authors use a simple single-linkage hierarchical clustering method to cluster data from the KDD’99 dataset, based on the standard Euclidean distance for inter-pattern similarity. Eskin et al. [8] reports improved results in the same dataset, using three di↵erent clustering algorithms: the Fixed-Width clustering algorithm, an optimized version of the k-NN
al-gorithm, and the one class SVM algorithm. Leung and
Leckie [16] present a combined density-based and grid-based clustering algorithm to improve computational complexity, obtaining similar detection results.
Previous work of our own permits to automatically charac-terize network traffic anomalies [9], but using a-priori
well-defined anomaly signatures. Closer to our current work, authors in [23] present URCA (Unsupervised Root Cause Analysis), a two-steps algorithm to characterize network anomalies in an unsupervised fashion. URCA uses as in-put the traffic in the anomalous time slots detected by any generic time-slot-based detection algorithm [7]. In the first step, it identifies the anomaly by iteratively removing from the anomalous time slots those flows that seem normal. In the second step, the algorithm uses a hierarchical cluster-ing method to characterize the particular flows identified as anomalous. We identify some serious drawbacks and omis-sions in URCA: authors claim that the approach is unsuper-vised, which is not true, simply because it uses previously labeled anomalous events for the characterization. As in pre-vious works, the algorithm uses difficult-to-interpret traffic descriptors for the clustering step (e.g. sample entropy of the distribution of IP addresses, aggregated at di↵erent lev-els), obscuring the comprehension of the network operator. Finally, the algorithm removes those flows that seem normal before the characterization step, which drags possible errors to the clustering step.
Our Unsupervised Anomaly Detection and Characteriza-tion algorithm [19] presents several advantages w.r.t. cur-rent state of the art. First and most important, it works in a completely unsupervised fashion, which means that it can be directly plugged into any monitoring system and start to work from scratch. Secondly, we perform anomaly de-tection based not only on outliers dede-tection, but also by identifying small-clusters. This is achieved by using dif-ferent levels of traffic aggregation, both at the source and destination of the traffic; this additionally permits to dis-cover low-intensity and distributed anomalies. Thirdly, we avoid the lack of robustness of general clustering approaches, by combining the notions of Sub-Space Clustering [20] and multiple Evidence Accumulation [10]. In particular, our al-gorithm is immune to general clustering problems like sensi-tivity to initialization, specification of number of clusters, or structure-masking by irrelevant features. Fourthly, the algo-rithm performs clustering in low-dimensional feature spaces, using simple traffic descriptors like number of source IP ad-dresses or fraction of SYN packets. This simplifies the char-acterization of the anomaly, and avoids well-known cluster-ing problems when workcluster-ing with high-dimensional data [11]. Our algorithm ranks the multiple evidence of an anomaly detected in di↵erent sub-spaces, combining the most rele-vant traffic descriptors into a compact and easy-to-interpret signature that characterizes the problem. This permits to reduce the time spent by the network operator to under-stand the nature of the anomaly. Finally, this algorithm is designed to work in an on-line fashion, analyzing traffic from consecutive time slots in near real time. This is possible even when working with large number of traffic descriptors, because the sub-space clustering and the evidence accumu-lation algorithms are perfectly adapted for parallelization (see [19]).
To the best of our knowledge, there is no paper in the literature on the use of unsupervised classification and char-acterization algorithms on honeypot traffic, or for intrusion or attacks characterization on big data sets of attack traces. Some very recent work exists, especially by Symantec and the TRIAGE project (Data Analytics Framework for Intel-ligence Analysis) that aims to use autonomous data mining techniques for the analysis of all the gathered traces of
at-tacks. However, TRIAGE aims at designing visualization techniques for the experts to make decision, while in this paper we propose to autonomously apply countermeasures for cheaper and faster defense.
3. UNSUPERVISED ANOMALY DETECTION
Our anomaly detection works on single-link packet-leveltraffic captured in consecutive time-slots of fixed length T.
The first analysis stage consists in change detection. At each time-slot, traffic is aggregated in 9 di↵erent flow
lev-els li. These include (from finer to coarser-grained
resolu-tion): source IPs (l1: IPsrc), destination IPs (l2: IPdst),
source Network Prefixes (l3,4,5: IPsrc/24, /16, /8),
destina-tion Network Prefixes (l6,7,8: IPdst/24, /16, /8), and traffic
per Time Slot (l9: tpTS). Time series Ztli are built for basic
traffic metrics such as number of bytes, packets, and IP flows
per time slot, using the 9 flow resolutions l1...9. Analyzing
honeypot traffic at multiple aggregation levels permits to de-tect both single source-destination and distributed attacks of very di↵erent intensities.
The unsupervised anomaly detection stage takes as input all the flows in the time slot flagged as anomalous, aggre-gated according to one of the di↵erent levels used in the first stage. An anomaly will generally be detected in di↵er-ent aggregation levels, and there are many ways to select a particular aggregation to use in the unsupervised stage; for the sake of simplicity, we shall skip this issue, and use any of the aggregation levels in which the anomaly was detected.
Without loss of generality, let Y = {y1, .., yF} be the set
of F flows in the flagged time slot, referred to as patterns
in more general terms. Each flow yf 2 Y is described by
a set of A traffic attributes or features. In this paper, we use a list of common traffic attributes. The list includes A = 9 traffic features: number of source/destination IP ad-dresses and ports, ratio of number of sources to number of destinations, packet rate, ratio of packets to number of desti-nations, and fraction of ICMP and SYN packets. According to our previous work on signature-based anomaly charac-terization [9], such simple traffic descriptors permit char-acterization of general traffic anomalies in easy-to-interpret terms. The list is therefore by no means exhaustive, and more features can be easily plugged-in to improve results.
Let xf = (xf(1), .., xf(A))2 RA be the corresponding
vec-tor of traffic features describing flow yf, and X = (x1; ..; xF)
the complete matrix of features, referred to as the feature space.
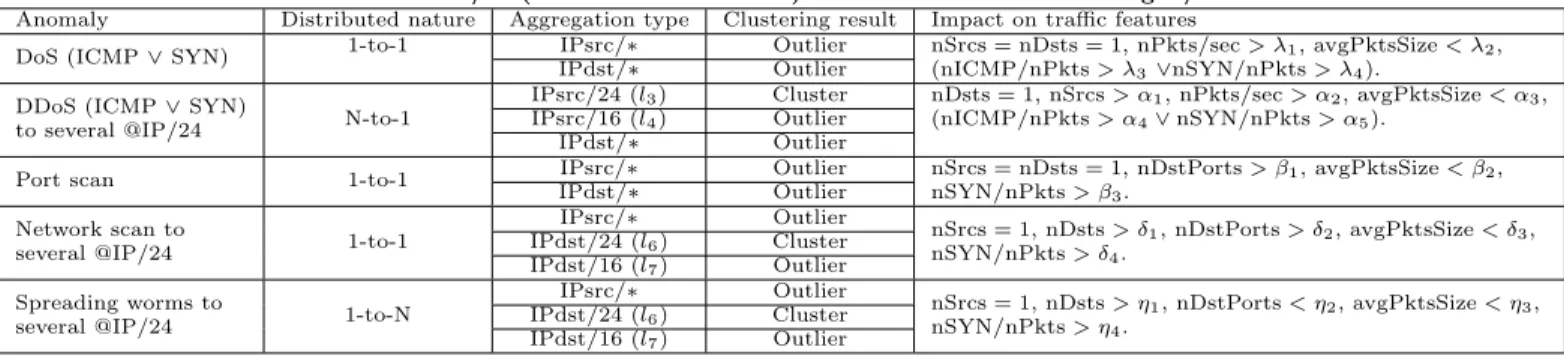
The unsupervised detection algorithm is based on cluster-ing techniques applied to X. The objective of clustercluster-ing is to partition a set of unlabelled patterns into homogeneous groups of similar characteristics, based on some measure of similarity. Table 1 explains the characteristics of each anomaly in terms of type, distributed nature, aggregation type and netmask used, and impact on traffic features. On one hand, a SYN DDoS which targets one machine from a high number of hosts located in several /24 addresses will
constitute a cluster if flows are aggregated in l3. In fact,
each of these /24 addresses will have traffic attributes val-ues di↵erent from the ones of normal traffic: a high number of packet, a single destination and many SYN packets. It is the whole set of these flows that will create a cluster. On
the other hand, if flows are aggregated in l6, the only
des-tination address will be an outlier characterized by many sources and a high proportion of SYN packets.
Table 1: Feature used for the detection of DoS, DDoS, network/port scans, and spreading worms. Anomalies of distributed nature 1-to-N or N-to-1 involve several /24 (source or destinations) addresses contained in a single /16 address.
Anomaly Distributed nature Aggregation type Clustering result Impact on traffic features
DoS (ICMP_ SYN) 1-to-1 IPsrc/⇤ Outlier nSrcs = nDsts = 1, nPkts/sec > 1, avgPktsSize < 2, IPdst/⇤ Outlier (nICMP/nPkts > 3_nSYN/nPkts > 4).
DDoS (ICMP_ SYN) N-to-1 IPsrc/24 (l3) Cluster nDsts = 1, nSrcs > ↵1, nPkts/sec > ↵2, avgPktsSize < ↵3, to several @IP/24 IPsrc/16 (l4) Outlier (nICMP/nPkts > ↵4_ nSYN/nPkts > ↵5).
IPdst/⇤ Outlier
Port scan 1-to-1 IPsrc/⇤ Outlier nSrcs = nDsts = 1, nDstPorts > 1, avgPktsSize < 2, IPdst/⇤ Outlier nSYN/nPkts > 3.
Network scan to
1-to-1
IPsrc/⇤ Outlier
nSrcs = 1, nDsts > 1, nDstPorts > 2, avgPktsSize < 3, several @IP/24 IPdst/24 (l6) Cluster nSYN/nPkts > 4.
IPdst/16 (l7) Outlier Spreading worms to
1-to-N
IPsrc/⇤ Outlier
nSrcs = 1, nDsts > ⌘1, nDstPorts < ⌘2, avgPktsSize < ⌘3, several @IP/24 IPdst/24 (l6) Cluster nSYN/nPkts > ⌘
4. IPdst/16 (l7) Outlier
Our particular goal is to identify and to isolate the dif-ferent flows that compose the anomaly flagged in the first stage, both in a robust way. Unfortunately, even if hundreds of clustering algorithms exist [11], it is very difficult to find a single one that can handle all types of cluster shapes and sizes, or even decide which algorithm would be the best for our particular problem. Di↵erent clustering algorithms pro-duce di↵erent partitions of data, and even the same cluster-ing algorithm provides di↵erent results when uscluster-ing di↵erent initializations and/or di↵erent algorithm parameters. This is in fact one of the major drawbacks in current cluster anal-ysis techniques: the lack of robustness.
To avoid such a limitation, we have developed a divide and conquer clustering approach, using the notions of clus-tering ensemble [24] and multiple clusclus-terings combination. A clustering ensemble P consists of a set of N partitions
Pn produced for the same data with n = 1, .., N . Each
of these partitions provides a di↵erent and independent evi-dence of data structure, which can be combined to construct a global clustering result for the whole feature space. There are di↵erent ways to produce a clustering ensemble. We use Sub-Space Clustering (SSC) [20] to produce multiple data partitions, applying the same clustering algorithm to N
dif-ferent sub-spaces Un⇢ X of the original space.
3.1 Clustering Ensemble and Sub-Space
Clus-tering
Each of the N sub-spaces Un⇢ X is obtained by
select-ing R features from the complete set of A attributes. The number of sub-spaces N hence is equal to R-combinations-obtained-from-A. To set the sub-space dimension R, we take a very useful property of monotonicity in clustering sets, known as the downward closure property: “if a collec-tion of points is a cluster in a d-dimensional space, then
it is also part of a cluster in any (d 1) projections of
this space” [1]. This directly implies that, if there exists any evidence of density in X, it will certainly be present
in its lowest-dimensional sub-spaces. Using small values
for R provides several advantages: firstly, doing cluster-ing in low-dimensional spaces is more efficient and faster
than clustering in bigger dimensions. Secondly,
density-based clustering algorithms provide better results in low-dimensional spaces [1], because high-low-dimensional spaces are usually sparse, making it difficult to distinguish between high and low density regions. We shall therefore use R = 2
in our SSC algorithm, which gives N = CA
R = A(A 1)/2
partitions.
3.2 Combining Multiple Partitions
Having produced the N partitions, we now explore di↵er-ent methods to combine these partitions in order to build a single partition where anomalous flows are easily distin-guishable from normal-operation traffic: the classical Evi-dence Accumulation (EA) and the new Inter-Clustering Re-sult Association (ICRA) method.
3.2.1 Combining Multiple Partitions using Evidence
Accumulation
A possible answer is provided in [10], where authors in-troduced the idea of multiple-clusterings Evidence Accumu-lation (EA). By simple definition of what it is, an anomaly may consist of either outliers or small-size clusters, depend-ing on the aggregation level of flows in Y (cf table 1). EA then uses the cluster ensemble P to build two inter-pattern similarity measures between the flows in Y. These similar-ity measures are stored in two elements: a similarsimilar-ity matrix S to detect small clusters and a vector D used to rank out-liers. S(p, q) represents the similarity between flows p and q. This value increases when the flows p and q are in the same cluster many times and when the size of this cluster is small. These two parameters allows the algorithm to tar-get small clusters. D(o) represents the abnormality of the outlier o. This value increases when the outlier has been classified as such several times and when the separation be-tween the outlier and the normal traffic is important. As we are only interested in finding the smallest-size clusters and the most dissimilar outliers, the detection consists in find-ing the flows with the biggest similarity in S and the biggest dissimilarity in D. Any clustering algorithm can then be ap-plied on the matrix S values to obtain a final partition of X that isolates small-size clusters of close similarity values. A variable detection threshold over the values in S is also able to detect small-size cluster. Concerning dissimilar out-liers, they can be isolated though a threshold applied on the values in D.
3.2.2 Combining Multiple Partitions using Inter-Clustering
result Association
However, by reasoning over the similarities between pat-terns (here flows), EA introduces several potential errors.
Let us consider two pattern sets Pi and Pj, if the
cardinal-ity of these pattern sets is close and if they are present in a similar number of sub-spaces, then EA will produce a very close (potentially the same) similarity value for both flow sets. They will then likely be falsely considered as
belong-ing to the same cluster. This possibility has to be consid-ered very seriously as it can induce a huge error: di↵erent anomalies will be merged together and will then likely be wrongly identified and characterized. Another source of po-tential error when using a clustering algorithm over S values is the algorithm sensitivity to wrong parameters. Further-more, the use of a threshold over S and/or D can decrease the system performance in case of a wrong value used.
In order to avoid the previously exposed sources of er-ror, we introduce a new way of combining clustering results obtained from sub-spaces: Inter-Clustering Results Associ-ation. The idea is to address the problem in terms of clus-ter of flows and outlier of flow similarity instead of patclus-tern (or flow) similarity. Hence, we shift the similarity measure from the patterns to the clustering results. The problem can then be split in two sub-problems: correlate clusters through Inter-CLuster Association (ICLA), and correlate outlier through Inter-Outlier Association (IOA).
In each case, a graph is used to express similarity between either clusters or outliers. Each vertex is a cluster/outlier
from any sub-space Un and each edge represents the fact
that two connected vertices are similar. The underlying idea is straightforward: identify clusters or outliers present in dif-ferent sub-spaces that contain the same flows. To do so, we first define a cluster similarity measure called CS between
two clusters Crand Cs: CS(Cr, Cs) =max(card(Ccard(Crr),card(C\Cs) s),
card being the function that associates a pattern set with
its cardinality, and Cr\ Cs the intersection of Cr and Cs.
Each edge in the cluster similarity graph between two Cr
and Cs means CS(Cr, Cs) > 0.9, being this an empirically
chosen value. The value 0.9 guarantees that the vast ma-jority of patterns are located in both clusters with a small margin of error. IOA uses an outlier similarity graph built by linking every outlier to every other outlier that contains the same pattern. Once these graphs are built, we need to find cluster sets where every cluster contains the same flows. In terms of vertices, we need to find vertex sets where every vertex is linked to every other vertex. In graph theory, such vertex set is called a clique. The clique search problem is a NP-hard problem. Most existing solutions use exhaustive search inside the vertex set which is too slow for our appli-cation. We then make the hypothesis that a vertex can only be part of a single clique. A greedy algorithm is then used to build each clique. Anomalous flow set are finally identified as the intersection of all the flow sets present in the clusters or outliers within each clique.
4. CORRELATING ANOMALOUS TRAFFIC
CLASSES
4.1 Address related correlation
Thanks to previous algorithm, we can detect several classes of illegitimate traffic, but these classes can appear in di↵er-ent aggregation levels. We know that such classes presdi↵er-ent at di↵erent levels can be related to each other. Indeed, two traffic classes in two di↵erent aggregation levels are related for example when their flows come from the same sources and go towards the same destinations. For a better char-acterization of traffic classes, it is then important to link classes corresponding to the same single anomaly. Correlat-ing illegitimate traffic classes is a solution for that purpose; it is able to determine the similarity between classes at each
aggregation level, for possibly grouping them if they belong to the same anomaly.
For estimating the similarity between two illegitimate traf-fic classes on two di↵erent aggregation levels, we use a com-parison function. It relies on IP addresses comcom-parison [19]. The comparison method then uses the IP source and
des-tination addresses of the di↵erent traffic classes a1 and a2.
It then compares source IP addresses with each other, and destination IP addresses with each other, using function (1).
Sim@(@1, @2) = |@1\ @2|
max(|@1|, |@2|)
(1)
where @n is a set of IP addresses, and|@n| the number of
addresses in this set.
It exists a similarity between two illegitimate traffic classes if equation (2) is true. tT SAddrSims is a threshold to be defined.
Simsrc(@1, @2) > tT SAddrSims^ Simdest(@1, @2)
> tT SAddrSims (2)
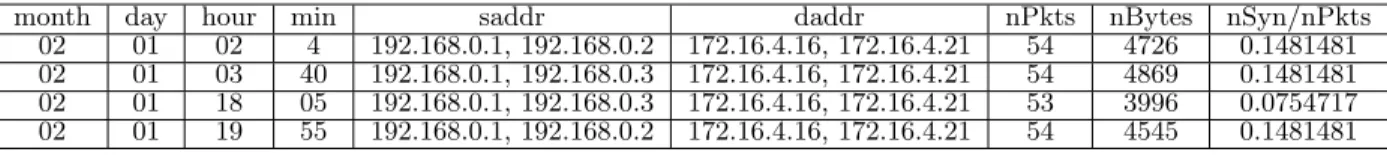
This method as defined in our previous work [19] has some lacks, and especially because it does not consider time. It appears when testing this method on the Maryland data that some flows of the same class are separated in time by several months. It is then clear that it is not satisfactory to consider only IP addresses. For example, illegitimate traffic classes detailed in tables 2 and 3 are completely di↵erent from a behavior point of view. For the first class, the num-ber of sent packets in each flow is around 54, whereas it is around 4 in the second class. In addition, the time dif-ference between these sendings is around two months. The only similarity between these two classes is related to their source IP addresses (saddr), and destination IP addresses (daddr). In this case the similarity value between the two classes with the previous function is 66%, what is signifi-cantly high, and would indicate a strong link between them. Given the time at which they happened it is certainly not true, and malware infecting the machines are certainly not the same. As a consequence, we added temporal features to the correlation function.
Let us consider two illegitimate traffic classes a1 and a2.
T1 and T2 are the set of time intervals in which traces of
a1 and a2 appear. @n1 and @n2 are the set of source and
destination IP addresses of classes a1and a2for the interval
tn2 T1. The new similarity function is then defined as:
SimT ime@= X t2T1 Sim@(@t1, @t2) max(|@t 1|, |@t2|) (3) However, if it exists time intervals between two classes, the similarity function equals a value very close from zero, whereas these two classes can be highly similar for other features. We then still need to keep in the computing of the
similarity function the IP addresses of the anomaly classes a1
and a2. But the addresses must be computed intependentely
from any temporal feature.
SimGlobal@=
Sim@(@1, @2)
max(|@1|, |@2|)
(4) We then obtain the simlarity function defined by equation (5).
month day hour min saddr daddr nPkts nBytes nSyn/nPkts
02 01 02 4 192.168.0.1, 192.168.0.2 172.16.4.16, 172.16.4.21 54 4726 0.1481481
02 01 03 40 192.168.0.1, 192.168.0.3 172.16.4.16, 172.16.4.21 54 4869 0.1481481
02 01 18 05 192.168.0.1, 192.168.0.3 172.16.4.16, 172.16.4.21 53 3996 0.0754717
02 01 19 55 192.168.0.1, 192.168.0.2 172.16.4.16, 172.16.4.21 54 4545 0.1481481
Table 2: First example of an illegitimate traffic class (IP addresses have been anonymised)
month day hour min saddr daddr nPkts nBytes nSyn/nPkts
04 10 01 30 192.168.0.1, 192.168.0.2 172.16.4.16, 172.16.4.21 5 20 1
04 11 01 30 192.168.0.1, 192.168.0.3 172.16.4.16, 172.16.4.21 4 160 1
04 12 01 30 192.168.0.1, 192.168.0.2 172.16.4.16, 172.16.4.21 5 20 1
04 13 01 30 192.168.0.1 172.16.4.16, 172.16.4.21 4 160 1
Table 3: Second example of an illegitimate traffic class (IP addresses have been anonymised)
SimAnomalies(a1, a2) = (SimT imeSrc(a1, a2) > 1)
^ (SimT imeDest(a1, a2) > 1)
^ (SimGlobalSrc(a1, a2) > 2)
^ (SimGlobalDest(a1, a2) > 2) (5)
The result of this function is a boolean value which is true
if a1 and a2are similar.
4.2 Time related correlation
Let’s take again the examples of classes detailed in tables 2 and 3. It is clear that there is no link between these two classes because they happened at very di↵erent times. Let’s apply equation (5). Let’s consider IP addresses of the first class on February 1st at 2h40 am. Source IP addresses are 192.168.0.1 and 192.168.0.2. At that time, the second class is empty (it happened on April 10th to 13th). The similarity is then correctly estimated as false. By continuing with other times and the same method, we always obtain a false value for the similarity. The new similarity function then correctly does not find any similarity between these two illegitimate traffic classes.
Nevertheless, it is required with this new method to fix correct threshold values. If thresholds are not well selected
returned values could be erroneous. With a small 1value,
each time a small temporal similarity will appear between two illegitimate classes, it will be the global similarity value that will determine the final similarity result between the
two classes. If 1is high, the two classes will be considered as
similar if they sent packet almost at the same time, from the same source and to the same destinations. This is a strong constraint and forbids any time di↵erence in the sendings. The global similarity will then be of less importance. Based on our experience with the traces of University or Maryland,
we empirically recommend to select for 1 a low threshold
value, between 10% and 30%, and for 2 a threshold value
greater than 25%.
Illegitimate traffic classes that appear as di↵erent after the sub-space clustering phase can then be grouped, as it is shown that they correspond to the same anomaly.
5. AUTOMATIC CHARACTERIZATION OF
ANOMALIES
At this stage, the global traffic from and towards honey-pots has been decomposed into traffic classes that exhibit
di↵erent behaviors. Classification techniques of the Inter-net traffic have now to identify the type of each of these traffic classes, the generating application, or the type of at-tack or anomaly, each of these clusters is related to. Most advanced classification techniques, i.e. semi-supervised tech-niques, take advantage of signatures that specifically identify one of the possible traffic families, applications, or attacks. These signatures come either from a previous knowledge or expertise in this domain, either on a training stage on a known traffic, whose application components have already been labeled. This is obviously a strong requirement for classification purposes, but it remains a severe limit for de-signing a fully autonomous method.
However, in this work, at the opposite of what has been already done in the research area of autonomous traffic clas-sification, this constraint does not exist because of the traffic nature that we have to analyze: illegitimate traffic. It is thus not needed to perfectly identify the anomaly kind (or at-tack), or to name it. Indeed, all traffic classes that have been isolated by the sub-space clustering algorithm, and evidence accumulation are anomalies or attacks. Therefore, the com-puting to be performed for each traffic anomaly or attack, in fine, consists in discarding them, after having identified any necessary feature required for instance for estimating the risk they represent in the Internet.
We then propose for this purpose to automatically gener-ate the rules characterizing the anomaly classes. Based on these rules, it is easy to understand the anomalies charac-teristics and to infer the countermeasures to be performed (and of course, this can be done by a computer process).
At this stage, the sub-space clustering / evidence accu-mulation / correlation algorithm has identified several cor-related anomalies containing a set of traffic flows in Y far out the rest of the traffic. The following task is to produce the appropriate filtering rules to correctly isolate and char-acterize each of these anomalies.
In order to produce filtering rules, the algorithm selects
those sub-spaces Unwhere the separation between the
con-sidered anomalous flows and the rest of the traffic is the biggest. We define two di↵erent classes of filtering rule:
ab-solute rules F RA(Y) and relative rules F RR(Y). Absolute
rules do not depend on the separation between flows, and correspond to the presence of dominant features in the con-sidered flows. An absolute rule for a certain feature j
char-acterizing a certain flow set Yg has the form
F RA(Yg, a) ={8yf 2 Yg⇢ Y : xf(a) == }.
Figure 1: The di↵erent filtering rules for sub-spaces (nSyn/nPkts, nDi↵DestAddr)
vast majority of the associated flows use only ICMP
pack-ets, hence the absolute filtering rule{nICMP/nPkts == 1}
makes sense. On the contrary, relative filtering rules depend on the relative separation between anomalous and normal-operation flows. Basically, if the anomalous flows are well
separated from the normal cluster in a certain partition Pn,
then the features of the corresponding sub-space Un are
good candidates to define a relative filtering rule. A relative rule has the form
F RR(Yg, a) ={8yf 2 Yg⇢ Y : xf(a) < _ xf(a) > }.
We shall also define a covering relation between filtering
rules: we say that rule f1 covers rule f2, f2(Y)⇢ f1(Y).
If two or more rules overlap (i.e., they are associated to the same feature), the algorithm keeps the one that covers the rest.
In order to construct a compact signature of the anomaly, we have to devise a procedure to select the most discrimi-nant filtering rules. Absolute rules are important, because they define inherent characteristics of the anomaly. As re-gards relative rules, their relevance is directly tied to the degree of separation between anomalous and normal flows. In the case of outliers, we select the K features for which the Mahalanobis distance to the normal-operation traffic is among the top-K biggest distances. In the case of small-size clusters, we rank the relatives rules according to the degree of separation to the normal anomaly using the well-known Fisher Score (FS) which uses the variance in each cluster (normal and anomalous). To finally construct the signature, the absolute rules and the top-K relative rules are combined into a single inclusive predicate, using the covering relation in case of overlapping rules.
What follows gives a real example of the generation of filtering rules based on an anomaly characterization. It is depicted on Figure 1. Clusters 2 and 3 have their value nSyn/nPkts always equal to 1. It then exists for them an
absolute rule{nSyn/nP kts == 1}.
On Figure 1, there exists a relative rule between cluster 1 and cluster 4. For generating it, we draw the median between clusters 1 and 4. Based on this median value, we
can create the relative rule{nDiffDestAddr < 9}.
6. RISK BASED ANOMALIES RANKING
Estimating the risk related to an anomaly can help a se-curity expert, in the general case, selecting the traffic classesthat require to be computed in priority. In our specific
case where all traffic classes identified are illegitimate, it can help to distinguish for instance between anomalies that are real attacks from scanning which in general just serves for preparing a possible future attack. In that case, the risk ranking can help superposing relative filtering rules, target-ing in priority the most risky one.
The way our risk ranking is done depends on the amount of communication; the more communication in an anomaly or attack, the more risky. In addition, anomalies that appear in many sub-spaces are considered as more dangerous than the ones appearing in a single or on very few sub-spaces. Three features are considered for estimating the risk related to an anomaly. The first one is the number of packets of the anomaly, because, if there are many packets exchanged between the attacking and the victim machines, there exist potentially machines infected by a virus, or a flooding at-tack attempt. The second feature is the amount of bytes exchanged in the anomaly, because, even if the number of exchanged packets is reduced, a large amount of bytes could have been exchanged. This may correspond to the down-load of information from a victim machine by an attacker, or the upload of viruses on several victim machines from the attacker machine. Last, the third feature is the communi-cation duration between the attacker and a target machine. The longer the communication duration, the more probable an attacker performing a download, or having an open shell on the victim machine.
The formula used for the risk estimation is:
risk = C⇤ (log(nP kts) + log(nBytes) + log(duration + 1))
(6) where C is the number of sub-spaces in which the anomaly appears, nP kts is the number of exchanged packets in the anomaly, nBytes is the number of exchanged bytes, and duration is the duration of the anomaly. +1 appears in
log(duration + 1) for avoiding some errors as duration 2
R+ whereas (nP kts, nBytes) 2 R⇤+. The communication
duration can be assimilated as zero because it can be so small that measurement devices can measure it as zero. On the other side, the number of packets or bytes are necessarily greater or equal to 1.
7. EXPERIMENTAL EVALUATION IN REAL
TRAFFIC
We run the algorithm described in this paper on the hon-eypot traffic traces gathered at the University of Maryland. For obvious privacy reasons, as well as space limit, we will not present the complete set of attacks evidenced. But we will show on an example how the algorithm behaves, and how it succeed in classifying attacks and anomalies, how it builds the anomaly classes characteristics based on sub-space clustering, evidence accumulation, and anomaly cor-relation. It also presents the filtering rules that have been autonomously generated and that can serve for automat-ically configuring security devices as filtering functions of routers, or firewalls.
(a) 0.0 0.2 0.4 0.6 0.8 1.0 0 500 1000 1500
testl1−26: eps=10 MinPts=5
nSyn_nPkts nPktsTcp (b) 0.0 0.2 0.4 0.6 0.8 1.0 0 5000 10000 15000 20000 25000 30000
testl1−36: eps=5 MinPts=5
nSyn_nPkts nBytes_nFlo w (c) 0.0 0.2 0.4 0.6 0.8 1.0 0 5000 10000 15000 20000 25000 30000
testl1−41: eps=5 MinPts=5
nRst_nPkts nBytes_nFlo w (d) 0.6 0.8 1.0 1.2 1.4 0.0 0.2 0.4 0.6 0.8 1.0
testl2−20: eps=1 MinPts=5
nDiffDestAddr nRst_nPkts (e) 0.0 0.2 0.4 0.6 0.8 1.0 0 2000 4000 6000 8000 10000
testl2−41: eps=5 MinPts=5
nRst_nPkts
nBytes_nFlo
w
Figure 2: Sub-spaces in which anomalies [44], [224], and [327] appear. These sub-spaces correspond to
Figure 3: Two levels of cliques appearing when correlating anomalies in di↵erent sub-spaces
This section starts by showing the complete behavior of the algorithm applied on a single anomaly (designated as anomaly [327]). Figure 2 shows 5 sub-spaces in which anoma-lies mentioned in this section appear (all sub-spaces in which the anomaly appears are not depicted on figure 2 for space limit reason). On each of these sub-spaces, clusters clearly appear, each corresponding to di↵erent anomalies. Figure 3 shows the cliques that have been built for correlating the clusters found in di↵erent sub-spaces, and then linking the ones that correspond to the same anomaly or attack.
Anomaly [327] appears in Figure 2 on subspaces (d) with the blue cluster, and (e), with the green cluster
correspond-ing to nRstnP kts = 0.5. At the end of the UNADA process,
the algorithm generated the following signature that fully characterizes anomaly [327]:
Characteristics of attack [327]:
(nBytes/nF low < 93.6666666666667)^(nBytes/nF low >
74)^ (nDiffSrcAddr = 1) ^ (nF in/nP kts = 0)^
(nF inT cp/nP ktsT cp = 0)^ (nP kts = 2) ^ (nP ktsT cp =
2)^ (nRst/nP kts = 0.5) ^ (nSyn/nP kts = 0.5)^
(nSynT cp/nP ktsT cp = 0.5)
Thanks to this process that issues such a signature, it is easy for a security expert to analyze the anomaly: it cor-responds to a well-known DoS attack which consists in re-questing the opening of a new TCP connection by sending a SYN packet, and then a RST packet for closing it in an un-negociated way. It then makes the receiver allocate re-sources, and desallocate them immediately. The receiver is then overwhelmed with the slow operations it has to perform on the machine memory. The advantage with issuing auto-matically such signature is that the appropriate counter-measures which consists in blocking the related traffic can be performed automatically without the help of the network administrator who can then focus on trickiest attacks.
Anomaly [326] appears in Figure 2 on subspaces (d) with
the blue cluster, and (e), with the green cluster. The algo-rithm generated the following signature that fully character-izes anomaly [326]:
Characteristics of attack [326]:
(avgSport < 21796)^(avgSport > 18635)^(nBytes/nF low <
93.6666666666667)^(nBytes/nF low > 74)^(nDiffSrcAddr =
1)^ (nP kts = 2) ^ (nP ktsT cp = 2) ^ (nRst/nP kts =
0.5)^ (nSyn/nP kts = 0.5) ^ (nSynT cp/nP ktsT cp = 0.5)
Anomaly [326] is very similar to anomaly [327]. It relies of the same principle of sending a SYN packet followed by a RST packet for uselessly exhausting receiver resources, and then performing a DoS attack. The only di↵erence is in the port numbers that origin the connection attempts.
Anomaly [44] appears in Figure 2 on subspaces (b) with
the black cluster corresponding to nSynnP kts = 1 and (c),
with the pink cluster corresponding to nRstnP kts = 1. The
algorithm generated the following signature that fully char-acterizes anomaly [44]:
Characteristics of attack [44]:
(bpp = 40)^ (nBytesnF low = 40)^ (nDiffDestAddr =
1)^ (nP kts = 1) ^ (nP kts/nF low = 1) ^ (nP ktsT cp =
1)^ (nRst/nP kts = 1) ^ (nSyn/nP kts = 0)
This anomaly is also very simple to analyze based on the issued signature. It also corresponds to a DoS attack called RST attacks which consists in sending RST packets in order to close ongoing connections.
The last anomalies described in this paper is anomaly [224] that appears in Figure 2 on subspaces (c) and (e), on the
red cluster with nRstnP kts = 0.
The algorithm generated the following signature that fully characterizes anomaly [224]:
(avgSport > 51209.3738990333)^(avgSport < 42107.1671947005)^
(bgstDestP ortT cp/tN bOccuDestP ortT cp < 262.25)^
(destP ortT cpM ax < 291)^ (destP ortT cpMin < 291) ^
(nBytes > 19187.5)^(nBytes < 118272)^(nBytes/nF low >
843.428571428571)^(nBytes/nF low < 1425.16666666667)^
(nDif f DestP ort = 1)^(nDiffSrcAddr = 1)^(nDiffSrcP ort <
40.5)^ (nP kts > 198) ^ (nP kts < 1200.5) ^ (nP ktsIcmp =
0)^(nP kts/nF low > 21.5)^(nP kts/nF low < 11.3333333333333)^
(nP ktsU dp = 0)^ (nRst/nP kts = 0) ^ (nSyn/nP kts >
0.115691489361702)^(nSyn/nP kts < 0.183333333333333)^
(nSynT cp/nP ktsT cp < 0.291666666666667)^(srcP ortT cpMax <
61502)^(srcP ortT cpMax > 34033.5)^(srcP ortT cpMin <
61502)^ (srcP ortT cpMin > 34033.5)
The analysis of this anomaly is more tricky than the three previous ones. It does not correspond to a basic DoS attacks. It is nevertheless a kind of TCP flooding attack with an advanced strategy for targeting specific address and port ranges making it look like a legitimate application traffic. It then makes it difficult to detect with classical detection tools.
8. EXPERIMENTAL EVALUATION
Figure 4 depicts the True Positives Rate (TPR) as a func-tion of the False Positives Rates (FTR) in the identifica-tion of the di↵erent attacks contained in the honeypot traffic traces from the University of Maryland. The presented re-sults are based on a manual analysis of the detection and/or identification algrithms under evaluation. This manual anal-ysis made possible labeling all attacks in the honeypot traffic of the University of Maryland. This set of labels serves for the evaluations as the reference ground truth. Actually, they permit an accurate evaluation of any detection, characteri-zation or classification algorithm.
We compare the performance of UNADA against three previous approaches for unsupervised anomaly detection: DBSCAN-based, k-means-based, and PCA-based outliers detection. The first two consist in applying either DBSCAN or k-means to the complete feature space X, identify the
largest cluster Cmax, and compute the Mahalanobis distance
of all the flows lying outside Cmaxto its centroid. The ROC
is finally obtained by comparing the sorted distances to a variable detection threshold. These approaches are similar to those used in previous work [8, 16, 21]. In the PCA-based approach, PCA and the sub-space methods [14, 15] are ap-plied to the complete matrix X, and the attacks are detected by comparing the residuals to a variable threshold. Both the k-means and the PCA-based approaches require fine tuning: in k-means, we repeat the clustering for di↵erent values of clusters k, and take the average results. In the case of PCA we present the best performance obtained for each evalua-tion scenario.
Obtained results permit to evidence the great advantage of using the SSC-Density-based algorithm in the clustering step with respect to previous approaches. In particular, all the approaches used in the comparison generally fail to de-tect all the attacks with a reasonable false alarm rate. Both the DBSCAN-based and the k-means-based algorithms get confused by masking features when analyzing the complete feature space X. The PCA approach shows to be not sen-sitive enough to discriminate di↵erent kinds of attacks of very di↵erent intensities, using the same representation for normal-operation traffic. 0 5 10 15 20 25 30 x10−3 0.5 0.55 0.6 0.65 0.7 0.75 0.8 0.85 0.9 0.95 1 FPR TPR UNADA
DBSCAN Outliers Detection k−means Outliers Detection PCA Outliers Detection
Figure 4: True Positives Rate vs False Alarms.
9. COMPUTATIONAL TIME AND
PARAL-LELIZATION
The last issue that we analyze is the Computational Time (CT) of the algorithm. The SSC-EA-based algorithm per-forms multiple clusterings in N (m) low-dimensional
sub-spaces Xi ⇢ X. This multiple computation imposes
scal-ability issues for on-line detection of attacks in
very-high-speed networks. Two key features of the algorithm are
exploited to reduce scalability problems in number of fea-tures m and the number of aggregated flows n to analyze. Firstly, clustering is performed in very-low-dimensional
sub-spaces, Xi 2 R2, which is faster than clustering in
high-dimensional spaces [11]. Secondly, each sub-space can be clustered independently of the other sub-spaces, which is perfectly adapted for parallel computing architectures. Par-allelization can be achieved in di↵erent ways: using a sin-gle multi-processor and multi-core machine, using network-processor cards and/or GPU (Graphic Processor Unit) capa-bilities, using a distributed group of machines, or combining these techniques. We shall use the term ”slice” as a reference to a single computational entity.
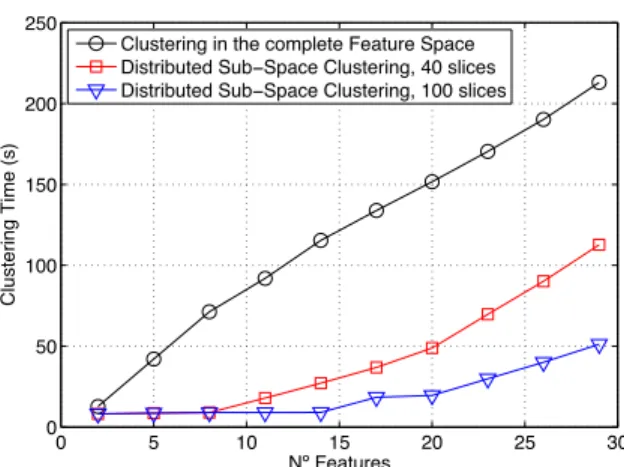
Figures 5 and 6 depict the CT of the SSC-EA-based al-gorithm, as a function of the number of features m used to describe traffic flows and as a function of the number of flows n to analyze, respectively. Figure 5 compares the CT obtained when clustering the complete feature space X, referred to as CT(X), against the CT obtained with SSC, varying m from 2 to 29 features. We analyze a large number
of aggregated flows, n = 104, and use two di↵erent number
of slices, M = 40 and M = 100. The analysis is done with traffic from the WIDE network, combining di↵erent traces to attain the desired number of flows. To estimate the CT of SSC for a given value of m and M , we proceed as follows:
first, we separately cluster each of the N = m(m 1)/2
sub-spaces Xi, and take the worst-case of the obtained
clus-tering time as a representative measure of the CT in a
0 5 10 15 20 25 30 0 50 100 150 200 250 Nº Features Clustering Time (s)
Clustering in the complete Feature Space Distributed Sub−Space Clustering, 40 slices Distributed Sub−Space Clustering, 100 slices
Figure 5: Computational Time as a function of num-ber of features to analyze. The numnum-ber of aggre-gated flows is n = 10000. 1000 5000 10000 50000 100000 −1 0 1 2 3 4 5 Nº Patterns
Clustering Time (log10(s))
Clustering in the complete Feature Space Distributed Sub−Space Clustering, 190 slices
Figure 6: Computational Time as a function of num-ber of flows to analyze. The numnum-ber of features and slices is m = 20 and M = 190 respectively.
if N 6 M, we have enough slices to completely parallelize
the SSC algorithm, and the total CT corresponds to the
worst-case, CT(XSSCwc). On the contrary, if N > M , some
slices have to cluster various sub-spaces, one after the other, and the total CT becomes (N %M + 1) times the worst-case CT(XSSCwc), where % represents integer division. The first
interesting observation from figure 5 regards the increase of CT(X) when m increases, going from about 8 seconds for m = 2 to more than 200 seconds for m = 29. As we said before, clustering in low-dimensional spaces is faster, which reduces the overhead of multiple clusterings computation. The second paramount observation is about parallelization: if the algorithm is implemented in a parallel computing ar-chitecture, it can be used to analyze large volumes of traffic using many traffic descriptors in an on-line basis; for exam-ple, if we use 20 traffic features and a parallel architecture with 100 slices, we can analyze 10000 aggregated flows in less than 20 seconds.
Figure 6 compares CT(X) against CT(XSSCwc) for an
in-creasing number of flows n to analyze, using m = 20 traffic
features and M = N = 190 slices (i.e., a completely paral-lelized implementation of the SSC-EA-based algorithm). As before, we can appreciate the di↵erence in CT when clus-tering the complete feature space vs. using low-dimensional sub-spaces: the di↵erence is more than one order of magni-tude, independently of the number of flows to analyze. Re-garding the volume of traffic that can be analyzed with this 100% parallel configuration, the SSC-EA-based algorithm can analyze up to 50000 flows with a reasonable CT, about 4 minutes in this experience. In the presented evaluations,
the number of aggregated flows in a time slot of T = 20
seconds rounds the 2500 flows, which represents a value of CT(XSSCwc)⇡ 0.4 seconds. For the m = 9 features that we
have used (N = 36), and even without doing parallelization,
the total CT is N⇥ CT(XSSCwc)⇡ 14.4 seconds.
10. CONCLUSION
This paper presents an unsupervised algorithm for clas-sifying illicit traffic. This algorithm has several advantages compared to previous work: (i) it works in a completely unsupervised manner, what makes it able to work on top of any monitoring system, and directly usable, without pre-liminary configuration or knowledge. (ii) It combines robust clustering techniques to avoid classical issues of clustering algorithms, e.g. sensitivity to initial configuration, the re-quired a priori indication of teh number of clusters to be identified, or the sensitivity of results when using less perti-nent features. (iii) It automatically builds simple and small signatures fully characterizing attacks; theses signature can then be used in a filtering security device. (iv) It is designed to run in real time by making possible to take advantage of the parallelism of our clustering approach.
This algorithm thus opens new perspectives for perform-ing a risk analysis in the Internet - takperform-ing advantage of hon-eypot traffic - and automatically configuring related filtering rules on routers, switches, or firewalls.
Acknowledgements
The author sincerely thanks Michel Cukier and Bertrand Sobesto for providing the traffic traces gathered on the hon-eypots of the University of Maryland. The author thanks Johan Mazel and Pedro Casas who have been first involved in the research work on the sub-space clustering algorithm applied to the full Internet traffic. The author also thanks Richard Turc who started this work on the analysis of the honeypot traffic during his master internship at LAAS. This work is supported by the ONTIC project, funded by the Eu-ropean commission under grant FP7-ICT-2013-11/619633.
11. REFERENCES
[1] R. Agrawal, J. Gehrke, D. Gunopulos, and
P. Raghavan. Automatic subspace clustering of high dimensional data for data mining applications. In Proc. ACM SIGMOD, 1998.
[2] P. Barford, J. Kline, D. Plonka, and A. Ron. A signal analysis of network traffic anomalies. In Proc. ACM IMW, 2002.
[3] R. Berthier, M. Cukier, M. Hiltunen, D. Kormann, G. Vesonder, and D. Sheleheda. Nfsight:
Netflow-based network awareness tool. In Proceedings of the 24th international conference on Large
[4] J. Brutlag. Aberrant behavior detection in time series for network monitoring. In Proc. 14th Systems Administration Conference, 2000.
[5] P. Casas, J. Mazel, and P. Owezarski. Unada: Unsupervised network anomaly detection using sub-space outliers ranking. In IFIP Networking conference, 2011.
[6] P. Casas, S. Vaton, L. Fillatre, and I. Nikiforov. Optimal volume anomaly detection and isolation in large-scale ip networks using coarse-grained measurements. In Computer Networks, vol. 54, pp. 1750-1766, 2010.
[7] G. Cormode and S. Muthukrishnan. What’s new: Finding significant di↵erences in network data streams. In IEEE Trans. on Networking, vol. 13 (6), pp. 1219-1232, 2005.
[8] E. Eskin, A. Arnold, M. Prerau, L. Portnoy, and S. Stolfo. A geometric framework for unsupervised anomaly detection: Detecting intrusions in unlabeled data. In Applications of Data Mining in Computer Security, Kluwer Publisher, 2002.
[9] G. Fernandes and P. Owezarski. Automated classification of network traffic anomalies. In Proc. SecureComm’09, 2009.
[10] A. Fred and A. K. Jain. Combining multiple clusterings using evidence accumulation. In IEEE Trans. Pattern Analysis and Machine Intelligence, vol. 27 (6), pp. 835-850, 2005.
[11] A. K. Jain. Data clustering: 50 years beyond k-means. In Pattern Recognition Letters, vol. 31 (8), pp. 651-666, 2010.
[12] B. Krishnamurthy, S. Sen, Y. Zhang, and Y. Chen. Sketch-based change detection: Methods, evaluation, and applications. In Proc. ACM IMC, 2003.
[13] A. Lakhina, M. Crovella, and C. Diot.
Characterization of network-wide anomalies in traffic flows. In Proc. ACM IMC, 2004.
[14] A. Lakhina, M. Crovella, and C. Diot. Mining anomalies using traffic feature distributions. In Proc. ACM SIGCOMM, 2005.
[15] A. Lakhina, C. Diot, and M. Crovella. Diagnosing network-wide traffic anomalies. In Proc. ACM SIGCOMM, 2004.
[16] K. Leung and C. Leckie. Unsupervised anomaly detection in network intrusion detection using clustering. In Proc. ACSC05, 2005.
[17] X. Li, F. Biang, M. Crovella, C. Diot, R. Govindan, G. Iannaccone, and A. Lakhina. Detection and identification of network anomalies using sketch subspaces. In Proc. ACM IMC, 2006.
[18] J. Mazel. Unsupervised network anomaly detection. In PhD thesis of INSA Toulouse, 2011.
[19] J. Mazel, P. Casas, Y. Labit, and P. Owezarski. Sub-space clustering, interclustering results association & anomaly correlation for unsupervised network anomaly detection. In 7th International Conference on Network and Service Management (CNSM 2011), CNSM’11, october 2011.
[20] L. Parsons, E. Haque, and H. Liu. Subspace clustering for high dimensional data: a review. In ACM SIGKDD Expl. Newsletter, vol. 6 (1), pp. 90-105, 2004.
[21] L. Portnoy, E. Eskin, and S. Stolfo. Intrusion detection with unlabeled data using clustering. In Proc. ACM DMSA Workshop, 2001.
[22] H. Ringberg, A. Soule, J. Rexford, and C. Diot. Sensitivity of pca for traffic anomaly detection. In Proc. ACM SIGMETRICS, 2007.
[23] F. Silveira and C. Diot. Rca: Pulling anomalies by their root causes. In Proc. IEEE INFOCOM, 2010. [24] A. Strehl and J. Ghosh. Cluster ensembles - a
knowledge reuse framework for combining multiple partitions. In Journal on Machine Learning Research, vol. 3, pp. 583-617, 2002.

![Figure 2: Sub-spaces in which anomalies [44], [224], and [327] appear. These sub-spaces correspond to di↵erent IP address aggregation levels and di↵erent temporal granularities](https://thumb-eu.123doks.com/thumbv2/123doknet/14416498.512775/9.918.82.821.90.1006/figure-spaces-anomalies-correspond-address-aggregation-temporal-granularities.webp)