HAL Id: hal-01119157
https://hal.archives-ouvertes.fr/hal-01119157
Submitted on 23 Feb 2015
HAL is a multi-disciplinary open access
archive for the deposit and dissemination of
sci-entific research documents, whether they are
pub-lished or not. The documents may come from
teaching and research institutions in France or
abroad, or from public or private research centers.
L’archive ouverte pluridisciplinaire HAL, est
destinée au dépôt et à la diffusion de documents
scientifiques de niveau recherche, publiés ou non,
émanant des établissements d’enseignement et de
recherche français ou étrangers, des laboratoires
publics ou privés.
Performance Evaluation and Benchmarking of Six
Texture-Based Feature Sets for Segmenting Historical
Documents
Maroua Mehri, Mohamed Mhiri, Pierre Héroux, Petra Gomez-Krämer,
Mohamed Ali Mahjoub, Rémy Mullot
To cite this version:
Maroua Mehri, Mohamed Mhiri, Pierre Héroux, Petra Gomez-Krämer, Mohamed Ali Mahjoub, et al..
Performance Evaluation and Benchmarking of Six Texture-Based Feature Sets for Segmenting
His-torical Documents. International Conference on Pattern Recognition, Aug 2014, Stockholm, Sweden.
pp.2885 - 2890, �10.1109/ICPR.2014.497�. �hal-01119157�
Performance Evaluation and Benchmarking
of Six Texture-based Feature Sets
for Segmenting Historical Documents
Maroua Mehri
∗†, Mohamed Mhiri
‡, Pierre H´eroux
†, Petra Gomez-Kr¨amer
∗,
Mohamed Ali Mahjoub
‡, and R´emy Mullot
∗∗L3i, University of La Rochelle, La Rochelle, France, Emails: {maroua.mehri, petra.gomez, remy.mullot}@univ-lr.fr †LITIS, University of Rouen, Saint-Etienne-du-Rouvray, France, Email: [email protected] ‡SAGE, University of Sousse, Sousse, Tunisia, Emails: [email protected], [email protected]
Abstract—Recently, texture-based features have been used for digitized historical document image segmentation. It has been proven that these methods work effectively with no a priori knowl-edge. Moreover, it has been shown that they are robust when they are applied on degraded documents under different noise levels and types. In this paper an approach of evaluating texture-based feature sets for segmenting historical documents is presented in order to compare them. We aim at determining which texture features could be more adequate for segmenting graphical regions from textual ones on the one hand and for discriminating text in a variety of situations of different fonts and scales on the other hand. For this purpose, six well-known and widely used texture-based feature sets (autocorrelation function, Grey Level Co-occurrence Matrix, Gabor filters, 3-level Haar wavelet transform, 3-level wavelet transform using 3-tap Daubechies filter and 3-level wavelet transform using 4-tap Daubechies filter) are evaluated and compared on a large corpus of historical documents. An additional insight into the computation time and complexity of each texture-based feature set is given. Qualitative and numerical experiments are also given to demonstrate each texture-based feature set performance.
Keywords—Historical digitized document images, Segmentation, Texture, Multiscale approach.
I. INTRODUCTION
The development of the Internet and electronic publishing has increased the need for reliable and efficient document understanding and interpretation system. Moreover, the need to guarantee a lasting preservation and to provide a wider access to material, has generated a raising interest to document image analysis. Document image analysis has become a thriving topic of major interest of many researchers and one of the most explored fields in image analysis [1]. Besides, we are interested in historical digitized document image segmentation and characterization tools.
The literature shows that various problems may arise related to the particularities of historical documents, such as a great variability of the page layout such as noise and degra-dation, page skew, random alignment, specific fonts, presence of embellishments, variations in spacing between the charac-ters, words, lines, paragraphs and margins, overlapping ob-ject boundaries and the superimposition of information layers (stamps, handwritten notes, noise, back-to-front interference, etc.) [2]. Thus, the processing of such kind of document is a non-trivial task, since we need to segment a page layout under
significant and various degradations and without hypothesis on the document structure (document model, typographical parameters, etc.). It has been documented in the literature that texture feature analysis is fundamental to numerous applica-tions including artificial vision, automated inspection, medical image segmentation, urban mapping, satellite image analysis and remote sensing. Furthermore, the use of texture analysis techniques has proliferated over the past two decades such that it has become the appropriate choice for the analysis of many types of images, particularly on synthetic, medical and natural images. More recently, these approaches have been investigated for document processing, such as script and language identification [3].
Our goal is to identify homogenous regions or similar groups of pixels sharing some visual characteristics by labeling and grouping pixels from historical document images. Thus, we explore and compare the various aspects of the texture features by using a texture-based segmentation scheme in order to assist the document image analysis. For our research, non-text regions and non-text regions are expected to have different textural characteristics. Moreover, different text fonts have distinctive visual appearance, so different texture properties [4]. The texture-based methods have proven adequate for meeting the need to segment an image under significant and various degradations and with little a priori knowledge [5], [6]. In our previous work [6], three well-known texture features, extracted from the autocorrelation function [7], the Grey Level Co-occurrence Matrix (GLCM) [8] and Gabor filters [9], are detailed and evaluated on 25 simplified historical document images. In this research, we extend our work by integrating three wavelet-based descriptors [10]: 3-level wavelet transform using Haar filter (Haar), level wavelet transform using 3-tap Daubechies filter (Daubechies3) and 3-level wavelet trans-form using 4-tap Daubechies filter (Daubechies4), which are assessed on more than 300 historical documents.
The paper is summarized as follows. First, Section II presents a brief review of the different texture-based feature sets and particularly the new investigated texture-based feature sets in this work, i.e. wavelet descriptors. Next, an overview of the control scheme of texture-based segmentation is outlined in Section III. Then, the experimental protocol and the results of texture feature analysis experiments are detailed in Sections IV and V respectively. Finally, conclusions from this research and future plans are presented in Section VI.
II. TEXTURE FEATURES
Numerous feature extraction algorithms have been pro-posed. Texture feature analysis methods may be divided into four categories [11]:
• Statistical methods analyze the spatial distribution of gray level values by computing local indices in the image and deriving a set of statistics from the distributions of the local features. The autocorrelation function [7] and the GLCM [8] are the classics of the statistical texture-based segmentation methods. • Geometrical methods are used to describe intricate
patterns, to retrieve and to describe texture primitives. The texture primitives may be extracted for example by the difference-of-Gaussian filter [12]. Those meth-ods attempt to characterize the primitives and find the rules governing their spatial organization.
• Model-based methods compute a parametric gener-ative model based on the intensity distribution of the texture primitives. A widely used class of the model-based methods are probabilistic models, e.g. Conditional Random Fields (CRF) [13].
• Frequency methods investigate the global frequency content of the analyzed image. The most widely used frequency methods are Gabor filters [9], wavelet transforms [10], etc. Some approaches investigate the local properties of the analyzed image. Other methods are based on statistical and/or spatial and/or frequency representations.
A well-researched survey and complete overview of re-cent texture segmentation and feature extraction techniques is presented in [14], including Gabor filters, GLCM, fractals, etc. Qiao et al. [15] combine Gabor, wavelets and kernel-based methods for document image segmentation. Nourbakhsh et al. [16] evaluate two texture-based feature sets: Gabor filters and log-polar wavelets for separating text/non-text in a document image. In this paper, six types of texture primitives are computed for segmentation and characterization of histori-cal digitized document images: autocorrelation, co-occurrence, Gabor and three wavelets features (Haar, Daubechies3 and Daubechies4).
In our work, we choose to analyze the six texture-based feature sets, basically statistical and frequency methods for several reasons: Firstly, we have made a comparative study about choosing the texture feature category, which ensures the best and constructive trade-off between best performances, reduced number of parameter settings and thresholds and lowest computation time [6]. Secondly, the extraction of these texture features needs less parameter settings. Indeed, without hypothesis on the document structure, neither on the document model (layout) nor the typographical parameters, the choice of numerous appropriate thresholds and parameters is a very difficult task. Then, the pertinence of the segmentation ex-periments based on autocorrelation function [5], GLCM [3], multiple channel Gabor filters [17] and wavelets [18] leads us to evaluate and compare these six textural features for segmenting historical documents. Finally, texture descriptors are basically investigated in independent experiments for doc-ument segmentation. Based to our knowledge, there are no
comparative studies of texture features for historical document segmentation. Therefore, this study evaluates and compares some of the well-known and widely used texture-based fea-ture sets, including autocorrelation function, GLCM, multiple channel Gabor filters and three different wavelet transforms, used for segmentation of digitized historical documents. All our experiments are performed with no a priori knowledge about the layout document nor its content. Autocorrelation, GLCM and Gabor features are detailed in [6]. In this research, we extend our work to study and evaluate wavelet features and compute the six texture-based feature sets on more than 300 historical documents.
The new investigated features in our work are wavelet descriptors. Even if the wavelet transform is computationally expensive (i.e. it is carried out by a large combination of filter parameters), it has been proven to be a promising alternative of many texture approaches such as Gabor filters [19]. For page segmentation, Gupta et al. [20] study the distribution of energy over different scales of wavelet decomposition. For document image segmentation, Li and Gray [21] use distribu-tion characteristics of wavelet coefficients of the 1-level Haar, 4-tap Daubechies and 8-tap Daubechies wavelet transforms. Kumar et al. [22] compare Haar discrete wavelet transforms and match wavelets for text extraction and document image segmentation. Acharyya and Kundu [23] present a multiscale analysis method based on wavelet scale-space features using an 8-tap filter for text segmentation in document images. In [24], Etemad et al. present an algorithm based on a pyramidal wavelet transform and a wavelet packet tree using Daubechies filters for segmentation of unstructured document pages.
Haar and Daubechies wavelets are the most used ones since it has been proven that they work effectively in many applications. The Haar wavelet transform is the fastest among all wavelets since its coefficients are either 1 or -1. Thus, they are the less complex, simplest and most widely used wavelets, while Daubechies ones are characterized by fractal structures [25], [26]. The 1st-order and 2nd-order statistics of coefficient sub-bands, such as the mean and standard deviation of wavelet coefficients, are the most commonly used features for texture classification and segmentation problems. Myint et al. [27] prove that classification accuracy decreases when the wavelet decomposition level is high for urban spatial feature discrimination. In [28], Angadi and Kodabagi report that wavelet coefficients are the most suitable for texture representation.
The objective of wavelet transform based methods is to decompose an image into low-frequency and high-frequency sub-band images, i.e. to filter out several frequency ranges. The wavelet transform represents an image with both spatial and frequency characteristics. The two-dimensional J-level wavelets transform decomposes a discrete input image I(x, y) into four sub-bands and it produces 3J + 1 sub-images [10]:
A2-JI, {D(1) 2- j, D (2) 2- j, D (3) 2- j}j=1,2,...,J (1)
where A2-J is the approximation of the input image I(x, y) at
resolution 2-J; D(1) 2- j, D
(2) 2- j and D
(3)
2- j are 3 detail components of
the input image I(x, y) at resolution 2- j. Wavelet coefficients in D(1)2- j, D
(2) 2- j and D
(3)
2- j represent respectively vertical, horizontal
By applying a 3-level wavelet transform to each analyzed block image, 10 sub-bands are produced (A2-3, D
(1) 2-1, D (2) 2-1, D (3) 2-1, D(1)2-2, D (2) 2-2, D (3) 2-2, D (1) 2-3, D (2) 2-3 and D (3) 2-3). In our experiments,
the mean and standard deviation of each of the transform coefficients, i.e. 10 sub-band coefficients are extracted to form a feature vector of 20 terms. The wavelet features are illustrated in Table I, where C(i, j) is the transform coefficient, and Sw and Sh are the width and the height respectively of a sub-band in the wavelet domain.
TABLE I. WAVELET FEATURES EXTRACTED FROM THE WAVELET
TRANSFORM.
Feature Expression
Mean F(1)=∑Swi=0∑Shj=1C(i, j)
Sw∗Sh
Standard deviation F(2)=∑Swi=0∑Shj=1[C(i, j)-F(1)]2
Sw∗Sh
III. TEXTURE-BASED SEGMENTATION SCHEME
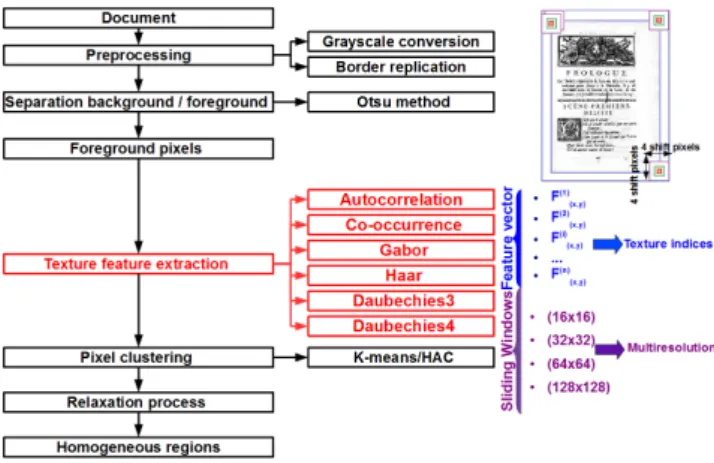
In order to evaluate and compare the six texture-based feature sets, a texture-based segmentation scheme is proposed. Our texture-based segmentation scheme has been conceptual-ized as four modular processes: pre-processing, texture-feature extraction, segmentation of homogeneous regions based on the feature values by using a pixel clustering technique and a relaxation process (cf. Figure 1).
Fig. 1. Proposed texture-based segmentation scheme.
Textural descriptors are only extracted from the selected foreground pixels of the gray-level document images at four different sizes of sliding windows in order to adopt a multiscale approach. The foreground pixel selection step is performed by using a standard non-parametric binarization method, the Otsu method, for the purpose of retrieving only pixels representing the information of the foreground (noise, text fields, graphics, etc.). In order to avoid side effects, we use classically border replication allowing computing texture features on the whole image. Then, a clustering algorithm is performed on the normalized textural features by setting the maximum number of homogeneous and similar content regions equal to the ones defined in our ground-truth [6]. Extracting the texture feature indices for autocorrelation, co-occurrence, Gabor, Haar, Daubechies3 and Daubechies4 using four different sliding window sizes gives a total of 20 (5 autocorrelation indices
× 4 sliding window sizes for multiresolution), 72 (18 co-occurrence indices × 4 sliding window sizes), 192 (48 Gabor indices × 4 sliding window sizes), 80 (20 Haar indices × 4 sliding window sizes), 80 (20 Daubechies3 indices × 4 sliding window sizes) and 80 (20 Daubechies4 indices × 4 sliding window sizes) features respectively (cf. Table II). Two conventional clustering algorithms, k-means and Hierarchical Ascendant Classification (HAC), have been assessed for seg-mentation of homogeneous regions based on the extracted texture-based feature values [6]. The pixel clustering task is performed by partitioning texture-based feature sets into compact and well-separated clusters in the feature space. It does not include spatial information. In this work, we add the multiscale majority voting technique as a relaxation process by taking into consideration the topographical relationships of pixels.
For refinement of the segmentation results, many re-searchers have introduced the relaxation labeling process as a post-processing step. Based on Chang and Kuo [29] the use of a relaxation labeling process is justified by the two following reasons. Firstly, by using a relaxation labeling process, we integrate the topographical or spatial relationships between pixels (median filtering or morphological dilations) which have not been considered when the texture features were extracted and analyzed. Secondly, the authors confirm that texture feature extraction from small predefined windows is not a relevant choice since this technique can generate non-smoothed boundaries. Thus, the segmentation performance will be improved and the variation produced by the predefined size of analysis window can be reduced. Etemad et al. [30] use weighted majority votes in the decision integration scheme in order to identify text, images and graphic areas on a document page after exploiting the wavelet packets technique. For document image segmentation, Jain et al. [31] introduce a connected component analysis in order to obtain smoothed text rectangular blocks after extracting Gabor features. For multiscale segmentation of unstructured document pages, the authors in [24] integrate morphological operations (closing operations) applying on the image regions after analyzing wavelet-based features in order to eliminate noise or outliers from segmented regions.
In our work, the spatial or topographical relationship be-tween pixels is introduced by integrating a spatial multiscale analysis of majority votes since it is parameter-free and it is widely used in case of historical document segmentation. A multiscale majority voting technique is used to remove small isolated groups of pixels. By performing a multiscale approach in the majority voting technique, a local decision on each selected pixel is taken using the maximum number or majority of pixel labels performed at four different sizes of sliding windows.
IV. EXPERIMENTAL PROTOCOL
In order to give insight about the robustness assessment of texture features for historical document segmentation, we aim to assess the discriminant power of texture features and determine which clustering algorithm could be better suited, by testing two conventional clustering algorithms: k-means and HAC. Secondly, we present the experimental evaluation of each feature set. Finally, the contribution of a relaxation
labeling task is analyzed in order to point out the role of the spatial or topographical relationship between pixels.
In the context of the DIGIDOC project (Document Image diGitisation with Interactive DescriptiOn Capability)1, we are interested in simplifying and improving the archiving, pro-cessing, comparison and indexing of ancient digitized books collected from the Gallica digital library (http://gallica.bnf.fr). Thus, in our experiments 314 pages are collected from Gallica, encompassing six centuries (1200-1900) of French history. Our experimental corpus is composed of:
• 89 pages containing only two fonts • 60 pages containing only three fonts
• 108 pages containing graphics and one text font • 57 pages containing graphics and text with two
differ-ent fonts
To evaluate quantitatively the different obtained results, the following clustering and classification accuracy measures are computed: silhouette width (SW ), purity per block (PPB), F-measure (F) and classification accuracy (CA). The higher the values, the better are the results. In Table III, there are two “Overall” values. The “Overall∗” value is obtained by averaging all the respective column values except the value of “Two fonts and graphics∗∗”. The “Overall∗∗” value is obtained by averaging all the respective column values except the value of “Two fonts and graphics∗”. The “Two fonts and graphics∗” value represents the case when every font in the text has a distinct label in the ground-truth and the clustering is performed by setting the number of types of content regions equal to 3 (graphics and text with two different fonts). The “Two fonts and graphics∗∗”value represents the case when all fonts in the text have the same label in the ground-truth and the clustering is performed by setting the number of types of content regions equal to 2 (graphics and text). This distribution points out which texture features could be more adequate for segmenting documents containing two text fonts and graphics into two/three classes, i.e. separating two distinct text fonts when the documents contain graphics.
Analyzing the six sets of texture descriptors from our cor-pus by one clustering algorithm with and without integrating a post-processing task gives a total of 4452 analyzed document images (314 + 57 images × 6 texture approaches × 2). The experiment was run on a SGI Altix ICE 8200 cluster (1 CPU and 2 gigabytes (GB) allocated memory on a Quad-Core [email protected] running Linux).
V. EVALUATION AND RESULTS
The first set of experiments is performed by using two different algorithms (k-means and HAC) in order to compare their performance and to determine which one is more appro-priate. For k-means, when using “Two fonts and graphics∗∗”in computing “Overall∗∗”, we observe that the classification per-formance of the extracted autocorrelation descriptors are much better, i.e. overall performance gains of 7%(SW ), 3%(PPB), 4%(F) and 2%(CA) are noted. Similarly for HAC, we observe overall performance gains of 8%(SW ), 1%(PPB), 5%(F) and 2%(CA). We subsequently show that autocorrelation attributes are more suitable to separate text from non-text regions.
1The DIGIDOC project is referenced under ANR-10-CORD-0020.
By comparing the two clustering methods, k-means and HAC, higher performances are obtained by using HAC, i.e. the following overall performance gains of 4% and 2%(PPB), 2% and 3%(F) and 4% and 4%(CA) are observed respectively for “Overall∗” and “Overall∗∗”. However, we note a slight drop in performance of the average of silhouette width of -2% and -1% respectively for “Overall∗”and “Overall∗∗”. This can be explained by the progressive merge process of HAC, where in higher levels in the hierarchy, two distant data points can be merged together and yet still belong to the same cluster after cutting the dendrogram. This causes a slightly lower value of the silhouette width. This justification can be strengthened by the particularity of the average silhouette width as internal or unsupervised accuracy clustering evaluation which investigates the coherence of a clustering solution by measuring how observations are close to the cluster center and how clusters are well-separated. In conclusion, most of the computed accuracy evaluation metrics are in agreement that the HAC performs better than k-means.
The second set of experiments aims at determining which texture-based method is better suited for discriminating graph-ical regions from textual ones on the one hand and for separating textual regions with different sizes and fonts on the other hand, by comparing the six computed categories of texture features. Moreover, an additional insight into the computation time and complexity is provided in Table II. The processing time depends highly on the resolution, size of the input image and number of foreground pixels. An example of a full page document scanned at 300 dpi (1965*2750 pixels) is illustrated in Table II. The highest time required to process a page (1965*2750 pixels) is obtained when using wavelet approaches while the lowest one is obtained when using co-occurrence descriptors, i.e. it is reduced to only 14 seconds. The computation times of each texture feature sets are in concordance with the complexity. We can see that the Daubechies4-based approach has the highest complexity while the lowest one is noted for the co-occurrence-based approach (cf. Table II). Therefore, this study states the co-occurrence-based approach as the best one in terms of processing time and complexity. However, the co-occurrence and Gabor-based approaches are the highest memory-consuming. Nevertheless, we note the increase of the feature dimension of the Gabor-based approach, i.e. the Gabor signature corresponds to a set of vectors composed of 192 numeric values.
A comparison of the results generated by using the six texture-based feature sets in our texture-based segmentation scheme has been demonstrated in Table III. The computed clustering and classification accuracy values are congruent and very promising. Here, it can be observed that the re-sult of employing Gabor features (cf. Figure 2(a)) yields a better output than the five other extracted textural features for almost all evaluation accuracy metrics without taking into consideration the topographical relationships of pixels. We also observe that the wavelet-based approaches and more specifi-cally Daubechies3 and Daubechies4 (cf. Figure 2(e)), perform slightly superior to the Gabor one in the cases of “One font and graphics” and “Two fonts and graphics∗∗”, i.e. the wavelet-based approach is more suitable for distinguishing textual regions from graphical ones. However, when the numerical complexity is taken into account, the wavelet approach is the highest resource-consuming (computation time) approach. We
TABLE II. COMPUTATION TIME AND COMPLEXITY:AN EXAMPLE OF HISTORICAL DOCUMENT IMAGE(1965*2750PIXELS).
Autocorrelation Co-occurrence Gabor Haar Daubechies3 Daubechies4 Running
time 00:02:33 00:00:14 00:06:05 00:29:17 00:37:53 00:42:21 Used
memory ≈48MB ≈587MB ≈552MB ≈61MB ≈61MB ≈63MB Complexity O(M(θaW log2 W)) O(MdcG2) O( fgθg(N2 log2 N)) O(M(4JW 2 log2 W)) O(M(6JW 2 log2 W)) O(M(8JW 2 log2 W))
Size of the texture vector 20 = Ia×W 72 = Ic×W 192 = Ig×W 80 = Ih×W 80 = Idb3×W 80 = Idb4×W Number of the texture attributes Ia= 5 Ic= 8dc+ 2 = 18 Ig= 2 fgθg= 48 Ih= 2IA 2-J+ 2ID(1) 2-1 + · · · + 2I D(1) 2- j + · · · + 2I D(1) 2-J + 2I D(2) 2-1 + · · · + 2I D(2) 2- j + · · · + 2I D(2) 2-J + 2I D(3) 2-1 + · · · + 2I D(3) 2- j + · · · + 2I D(3) 2-J = 20 Idb3= 2IA 2-J+ 2ID(1) 2-1 + · · · + 2I D(1) 2- j + · · · + 2I D(1) 2-J + 2I D(2) 2-1 + · · · + 2I D(2) 2- j + · · · + 2I D(2) 2-J + 2I D(3) 2-1 + · · · + 2I D(3) 2- j + · · · + 2I D(3) 2-J = 20 Idb4= 2IA 2-J+ 2ID(1) 2-1 + · · · + 2I D(1) 2- j + · · · + 2I D(1) 2-J + 2I D(2) 2-1 + · · · + 2I D(2) 2- j + · · · + 2I D(2) 2-J + 2I D(3) 2-1 + · · · + 2I D(3) 2- j + · · · + 2I D(3) 2-J = 20 where Ia, Ic, Ig, Ih, Idb3and Idb4are autocorrelation, co-occurrence, Gabor, Haar, Daubechies3 and Daubechies4 attributes respectively. IA
2-J, ID(1) 2- j , I D(2) 2- j and I D(3) 2- j
are the approximation and detail sub-images attributes. W is the number of sliding window sizes equal to 4. M is the number of foreground pixels. N is the dimension of the input N × N image. G is the number of gray levels, i.e. 255 gray levels. θais the number of orientation values of the rose of directions, i.e. 180 orientation values. dcis the GLCM particular distance defined
in the probability of the gray level pairs. In our work, dcis equal to 2. fgand θgare spatial frequency and orientation of Gabor filters respectively. In the experiment, the scale of
wavelet decomposition J was 3 levels, i.e. from first, second and third scale. “MB” means megabytes. The time duration has “hh:mm:ss” format [6].
TABLE III. EVALUATION OF THE ANALYZED TEXTURAL FEATURES AND THE RELAXATION LABELING PROCESS.
Autocorrelation Co-occurrence Gabor Haar Daubechies3 Daubechies4 A† B‡ Co A† B‡ Co A† B‡ Co A† B‡ Co A† B‡ Co A† B‡ Co One font and graphics PPB 0,91 0,96 0,05 0,89 0,94 0,05 0,97 0,97 0 0,94 0,97 0,03 0,95 0,97 0,02 0,95 0,97 0,02 CA 0,88 0,92 0,04 0,83 0,89 0,06 0,92 0,92 0 0,91 0,93 0,02 0,94 0,96 0,02 0,94 0,96 0,02 F 0,89 0,92 0,03 0,84 0,89 0,05 0,93 0,93 0 0,91 0,94 0,03 0,93 0,95 0,02 0,94 0,96 0,02 Two fonts and graphics∗ PPB 0,8 0,88 0,08 0,86 0,91 0,05 0,93 0,93 0 0,87 0,93 0,06 0,88 0,94 0,06 0,9 0,94 0,04 CA 0,71 0,82 0,11 0,69 0,75 0,06 0,72 0,72 0 0,72 0,81 0,09 0,74 0,82 0,08 0,77 0,81 0,04 F 0,62 0,69 0,07 0,73 0,69 -0,04 0,72 0,72 0 0,63 0,67 0,04 0,64 0,68 0,04 0,66 0,68 0,02 Two fonts and graphics∗∗ PPB 0,88 0,93 0,05 0,94 0,97 0,03 0,99 0,99 0 0,96 0,98 0,02 0,97 0,99 0,02 0,97 0,99 0,02 CA 0,88 0,92 0,04 0,85 0,89 0,04 0,94 0,94 0 0,93 0,96 0,03 0,95 0,98 0,03 0,94 0,97 0,03 F 0,88 0,93 0,05 0,86 0,91 0,05 0,93 0,93 0 0,93 0,96 0,03 0,95 0,98 0,03 0,94 0,97 0,03 Only two fonts PPB 0,89 0,93 0,04 0,84 0,88 0,04 0,95 0,95 0 0,89 0,93 0,04 0,85 0,9 0,05 0,89 0,93 0,04 CA 0,85 0,89 0,04 0,69 0,69 0 0,88 0,88 0 0,83 0,87 0,04 0,78 0,82 0,04 0,81 0,85 0,04 F 0,79 0,85 0,06 0,73 0,73 0 0,91 0,91 0 0,8 0,84 0,04 0,77 0,81 0,04 0,8 0,84 0,04 Only three fonts PPB 0,75 0,83 0,08 0,79 0,86 0,07 0,89 0,89 0 0,78 0,87 0,09 0,78 0,87 0,09 0,82 0,9 0,08 CA 0,73 0,79 0,06 0,66 0,69 0,03 0,7 0,7 0 0,66 0,69 0,03 0,67 0,68 0,01 0,71 0,75 0,04 F 0,61 0,67 0,06 0,63 0,67 0,04 0,65 0,65 0 0,58 0,61 0,03 0,63 0,66 0,03 0,64 0,68 0,04 Overall∗ PPB 0,84 0,9 0,06 0,84 0,9 0,06 0,93 0,94 0,01 0,87 0,93 0,06 0,86 0,92 0,06 0,89 0,94 0,05 CA 0,79 0,86 0,07 0,72 0,76 0,04 0,81 0,81 0 0,78 0,83 0,05 0,78 0,82 0,04 0,81 0,84 0,03 F 0,73 0,78 0,05 0,71 0,75 0,04 0,8 0,8 0 0,73 0,77 0,04 0,74 0,78 0,04 0,76 0,79 0,03 Overall∗∗ PPB 0,86 0,91 0,05 0,86 0,91 0,05 0,95 0,95 0 0,89 0,94 0,05 0,89 0,93 0,04 0,91 0,95 0,04 CA 0,84 0,88 0,04 0,76 0,79 0,03 0,86 0,86 0 0,83 0,86 0,03 0,84 0,86 0,02 0,85 0,88 0,03 F 0,79 0,84 0,05 0,77 0,8 0,03 0,86 0,86 0 0,81 0,84 0,03 0,82 0,85 0,03 0,83 0,86 0,03
A†, B‡and Corepresent the evaluation of the analysis of the extracted texture features in the case of without a post-processing task, with a post-processing step and the difference
between A†and B‡respectively. Table cells whose background are yellow and green note the best performance of the analysis of the extracted texture features in the case of without
a post-processing task (A†) and with a post-processing step (B‡) respectively.
(a)Gabor PPB= 0, 99 F = 0, 99 (b)Gabor + Post-processing PPB= 0, 99 F = 0, 99 (c)Gabor PPB= 0, 99 F = 0, 99 (d)Gabor + Post-processing PPB= 0, 99 F = 0, 99 (e)Daubechies4 PPB= 0, 96 F = 0, 90 (f)Daubechies4 + Post-processing PPB= 0, 99 F = 0, 94 (g)Daubechies4 PPB= 0, 89 F = 0, 87 (h)Daubechies4 + Post-processing PPB= 0, 94 F = 0, 94
Fig. 2. Examples of segmentation results: 2(a), 2(b), 2(e) and 2(f) represent the “Two fonts and graphics∗∗” category of documents. 2(c), 2(d) , 2(g) and 2(h) represent the “Only three fonts” category of documents. Because the process is unsupervised, the colors attributed to text or graphics may differ from one document image to another.
note that the Gabor approach performs considerably better in segmenting documents containing only textual regions with
distinct fonts (cf. Figures 2(c) and 2(g)) (18%(F) perfor-mance difference rate between the co-occurrence and Gabor
approaches). We observe that the lowest values of the most computed clustering and classification accuracy metrics are obtained for documents containing only distinct fonts when using co-occurrence descriptors. Therefore, we conclude that co-occurrence features are not adequate for separating different text fonts even when it is the lowest time-consuming.
By considering the multiscale approach of majority votes as a relaxation labeling process or a post-processing step, we aim at refining the segmentation results by integrating the topographical relationships of pixels. It is important to point out that our texture-based segmentation scheme is in-dependent of the post-processing task, since the overall results are reasonably promising, i.e. we obtain 80% and 86% of overall F-measure rates for “Overall∗” and “Overall∗∗” re-spectively without taking into consideration the topographical relationships of pixels and their labels. Nevertheless, we note that the Gabor and Daubechies4-based approaches provide the best performance when adding the relaxation labeling process in our texture-based segmentation approach. Furthermore, we note that Gabor feature analysis does not require a post-processing phase, since there is a no performance difference between the cases of without and a post-processing task (cf. Figures 2(b), 2(f), 2(d) and 2(h)). It is worthwhile to note that by adding the multiscale analysis of majority voting as a post-processing phase, the Daubechies4-based approach achieves approximately the performance of the Gabor-based approach (86% of mean F). Although, when the numerical complexity is taken into account by comparing the Gabor and Daubechies4 approaches, the Gabor one would be the better choice, since it also does not require a relaxation labeling process.
VI. CONCLUSIONS AND FURTHER WORK
This study presents an approach for evaluating and bench-marking six texture-based feature sets, including autocorre-lation, co-occurrence and three kinds of wavelet transform-based features. This work has shown the effectiveness of texture analysis approaches in the field of historical document segmentation. Based on our experiments, we can conclude that Gabor and Daubechies4 features are the best choices for discriminating textual regions from graphical ones when taking into account the spatial relationships between pixels, i.e. by introducing a relaxation labeling step. However, when the numerical complexity is taken into account and the uselessness of a relaxation process, the Gabor approach would be the better choice. Furthermore, the Gabor approach is a good choice for segmenting document images containing only textual regions with distinct fonts.
Further work needs to be done in combining the extracted texture descriptors in order to construct an optimal texture-based feature set and to provide a qualitative measure of which features are the most appropriate for segmenting historical documents.
REFERENCES
[1] G. Nagy, “Twenty years of document image analysis in PAMI,” PAMI, pp. 38–62, 2000.
[2] G. Agam, G. Bal, G. Frieder, and O. Frieder, “Degraded document
image enhancement,” in DRR, 2007.
[3] A. Busch, W. W. Boles, and S. Sridharan, “Texture for script identifi-cation,” PAMI, pp. 1720–1732, 2005.
[4] B. Julesz, “Visual pattern discrimination,” IT, pp. 84–92, 1962. [5] N. Journet, J. Ramel, R. Mullot, and V. Eglin, “Document image
char-acterization using a multiresolution analysis of the texture: application to old documents,” IJDAR, pp. 9–18, 2008.
[6] M. Mehri, P. Gomez-Kr¨amer, P. H´eroux, A. Boucher, and R. Mullot, “Texture feature evaluation for segmentation of historical document images,” in HIP, 2013, pp. 102–109.
[7] M. Petrou and P. G. Sevilla, Image processing: dealing with texture. John Wiley & Sons, 2006.
[8] R. M. Haralick, K. Shanmugam, and I. Dinstein, “Textural features for image classification,” SMC, pp. 610–621, 1973.
[9] D. Gabor, “Theory of communication. Part 1: The analysis of informa-tion,” Journal of the Institution of Electrical Engineers - Part III: Radio and Communication Engineering, pp. 429–441, 1946.
[10] S. G. Mallat, “A theory for multiresolution signal decomposition: The wavelet representation,” PAMI, pp. 674–693, 1989.
[11] C. H. Chen, L. F. Pau, and P. Wang, Texture analysis in the handbook of pattern recognition and computer vision. World Scientific, 1998.
[12] M. Tuceryan and A. K. Jain, “Texture segmentation using Voronoi
polygons,” PAMI, pp. 211–216, 1990.
[13] J. Lafferty, A. McCallum, and F. Pereira, “Conditional Random Fields: probabilistic models for segmenting and labeling sequence data,” in ICML, 2001, pp. 282–289.
[14] T. R. Reed and J. M. H. DuBuf, “A review of recent texture segmenta-tion and feature extracsegmenta-tion techniques,” CVGIP: Image Understanding, pp. 359–372, 1993.
[15] Y. Qiao, Z. Lu, C. Song, and S. Sun, “Document image segmentation using Gabor wavelet and kernel-based methods,” in ISSCAA, 2006, pp. 450–455.
[16] F. Nourbakhsh, P. B. Pati, and A. G. Ramakrishnan, “Text localization and extraction from complex gray images,” in ICVGIP, 2006, pp. 776– 785.
[17] A. K. Jain and F. Farrokhnia, “Unsupervised texture segmentation using gabor filters,” PR, pp. 1167–1186, 1991.
[18] S. Kumar, R. Gupta, N. Khanna, S. Chaudhury, and S. D. Joshi, “Text extraction and document image segmentation using matched wavelets and MRF model,” IP, pp. 2117–2128, 2007.
[19] Y. Liu and X. Zhou, “Automatic texture segmentation for texture-based image retrieval,” in MMM, 2004, pp. 285–290.
[20] P. Gupta, N. Vohra, S. Chaudhury, and S. D. Joshi, “Wavelet based page segmentation,” in ICVGIP, 2000, pp. 51–56.
[21] J. Li and R. M. Gray, “Context-based multiscale classification of document images using wavelet coefficient distributions,” IP, pp. 1604– 1616, 2000.
[22] S. Kumar, N. Khanna, S. Chaudhury, and S. D. Joshi, “Locating text in images using matched wavelets,” in ICDAR, 2005, pp. 595–599.
[23] M. Acharyya and M. K. Kundu, “Document image segmentation using
wavelet scale-space features,” TCSVT, pp. 1117–1127, 2002. [24] K. Etemad, D. Doermann, and R. Chellappa, “Multiscale segmentation
of unstructured document pages using soft decision integration,” PAMI, pp. 92–96, 1997.
[25] C. W. Liang and P. Y. Chen, “DWT based text localization,” IJASE, pp. 105–116, 2004.
[26] L. Xavier, B. M. I. Thusnavis, and D. R. W. Newton, “Content
based image retrieval using textural features based on pyramid-structure wavelet transform,” in ICECT, 2011, pp. 79–83.
[27] S. W. Myint, N. S. N. Lam, and J. M. Tyler, “Wavelets for urban spatial feature discrimination: comparisons with fractal, spatial autocorrelation, and spatial co-occurrence approaches,” PE&RS, pp. 803–812, 2004. [28] S. A. Angadi and M. M. Kodabagi, “A fuzzy approach for word level
script identification of text in low resolution display board images using wavelet features,” in ICACCI, 2013, pp. 1804–1811.
[29] T. Chang and C. C. J. Kuo, “Texture segmentation with tree-structured wavelet transform,” in TFTSA, 1992, pp. 543–546.
[30] K. Etemad, D. Doermann, and R. Chellappa, “Page segmentation using decision integration and wavelet packets,” in ICPR, 1994, pp. 345–349. [31] A. K. Jain, S. K. Bkattacharjee, and Y. Chen, “On texture in document