IX. COMMUNICATION RESEARCH
A.
MULTIPATH TRANSMISSION
Prof. L. B. Arguimbau
W. C. Kinzinger
G. M. Rodgers
H. H. Cross
E. E. Manna
R. D. Stuart
R. A. Paananen
1. Speech and Music.
Transatlantic Tests
A new series of tests is under preparation.
In the earlier tests discussed in the
Quarterly Progress Report, April 15, 1952, the results were poor when the spread in
elapsed transmission time was large and distributed. In the new tests a more elaborate
antenna system will be used to reduce the pulse-pattern spread.
L. B. Arguimbau, E. E. Manna
2.
Television
The primary object of this project, which is now completed, was to determine
whether or not it is possible to obtain a higher quality picture at the receiver in the
presence of multipath transmission conditions by the use of frequency modulation. The
theory of the effects of multipath on FM has been given previously, and it has been shown
that the resultant signal is the same as the stronger of the received signals with a spike
interference superimposed upon it.
In the case with which we have been concerned, the
repetition rate of the spikes is such that they are resolved by the receiver and appear
on the picture as a series of lines following high contrast transitions. Efforts have been
made to reduce the effects of these spikes by the use of de-emphasis. However, what
can be accomplished by this means alone has proved to be insufficient to give
satisfac-tory suppression of the interference.
Throughout this work the whole of the bandwidth
available has been used for deviation.
This does give rise to some distortion of the
waveform, but it has been found that it is of such a nature as to cause very little
dete-rioration in the actual picture quality.
The final pictures which were obtained by FM transmission, using a bandwidth
cor-responding to the present assignment for television service, are comparable in quality
to those obtained with AM transmission; in fact, after comparing the two, a majority
of the observers expressed some preference for the FM picture.
One of the troubles encountered in the investigation was that judging the quality of a
picture is a subjective matter. The problem was further aggravated by the fact that the
simpler facsimile equipment that was used produces a still photograph and not a moving
picture on a screen. Any further investigation should be made on a full-scale basis
rather than on the low-frequency one employed thus far.
A great improvement in picture quality can, of course, be obtained by using greater
bandwidth, and it has been found that doubling the bandwidth produces a marked
improve-ment. It may, however, be possible to achieve better picture quality without having to
-64-resort to greater channel width. Some improvements may be obtained by a modification of the contrast curve of the transmitter. This would, of course, detract from the faith-fulness of the reproductions; but from experience already gained, it seems quite likely that the quality of the picture would be marred very little. Here the subjective nature of the problem again arises, and the low-frequency model probably precludes a fair assessment of the possibilities.
L. B. Arguimbau, E. E. Manna, R. D. Stuart
3. Simplified FM Receiver
This work, carried out by H. H. Cross and R. A. Paananen, is complete. Thesis reports have been written and are to be simplified and published as technical reports. In the writer's opinion the receiver is a step in advance in FM receiver design and could very profitably be copied for communication types of receivers or even for high-quality broadcast use.
L. B. Arguimbau 4. Adjacent and Alternate Channel Interference
A study has been made of the influence of discriminator bandwidth in the conventional Foster-Seeley discriminator on the degree of adjacent and alternate channel interference.
The work is an extension of that done previously for the case of co-channel interfer-ence and in this case, also, it has been found that the important quantities are the diode time constant, the discriminator bandwidth in relation to spike height, and the discrim-inator bandwidth in relation to the rate of change of applied frequency. To narrow the problem, an essentially perfect limiter was used.
In the case of adjacent and alternate channel interference, the spike repetition rate is correspondingly higher than that for the co-channel case, and the requirements on the speed of operation of the discriminator become more stringent.
The curve of dc output due to interference vs frequency takes the general shape of the static S curve of the discriminator, especially in the regions of the interference curves where the frequency is removed from the channel center by a minimum equal to the peak separation of the discriminator S curve. The reason for this is obvious from the simple notion of spike clipping.
The results show the desirability of an extremely wide discriminator; and, as the bandwidth is increased, the speed of operation must be correspondingly improved.
W. C. Kinzinger
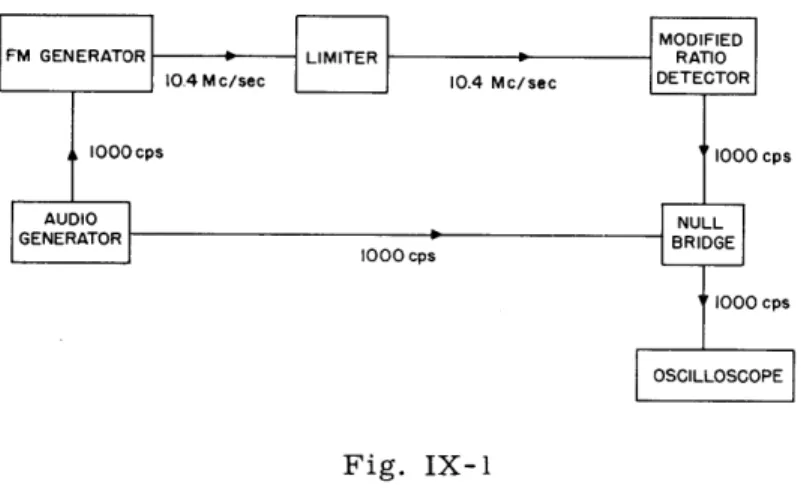
5. Frequency Detector Linearity Measurement
An investigation of accurate measurement of the response of a frequency detector is in progress. The particular method used is that of measuring the derivative of the response curve by applying an FM signal with incremental, sinusoidal deviation, and
(IX. COMMUNICATION RESEARCH)
then measuring with a null bridge the ac output relative to the audio modulating voltage.
A block diagram of the setup is shown in Fig. IX-1.
In frequent applications, the deviation from linearity of the laboratory type of
frequency detectors is of the same order of magnitude as that of the available
signal-generating equipment, so that the accuracy obtainable from the usual type of
measure-ment (with FM generator and wave analyzer) is very limited. It is hoped that this bridge
method will be useful in these cases.
Fig. IX-1
Test setup for measuring ratio detector linearity.
It has seemed desirable to have the nonlinearity of the discriminator expressed in
percentage harmonic distortion for standard +75-kc/sec sinusoidal deviation. Mock tests
have been run by obtaining the derivative curve and integrating graphically to obtain the
coefficients of the first, second, and third harmonic components for the assumed
standard deviation. Actual tests on a modified ratio detector (center frequency, 10. 4
Mc/sec; width, 1. 0 Mc/sec) which had been visually aligned for "optimum" linearity
showed second- and third-harmonic components of 0. 26 percent and 0.07 percent,
respectively.
B. STATISTICAL THEORY OF COMMUNICATION
Prof. J. B. Wiesner Prof. J. F. Reintjes P. E. Green, Jr. Prof. W. B. Davenport, Jr. B. L. Basore A. J. Lephakis
Prof. R. M. Fano C. A. Desoer R. M. Lerner
Prof. Y. W. Lee L. Dolansky M. J. Levin
i. Five-Channel Analog Correlator
This equipment has been completed and tested. It has been used for a brief investi-gation of the nonstationary characteristics of gas-tube noise, speech, and music. The correlator and the results obtained with it will be described in a forthcoming technical report.
Y. W. Lee, J. F. Reintjes, M. J. Levin
2. Information Theory
a. Transmission of information through channels in cascade
Consider a channel perturbed by gaussian noise. Let the input consist of pulses of height +1. The information obtained at the receiver depends on the type of detector used.
A maximum likelihood detector is a detector which indicates the most probable cause of the received signal; it throws away some information, namely, the degree of certainty with which this decision is made.
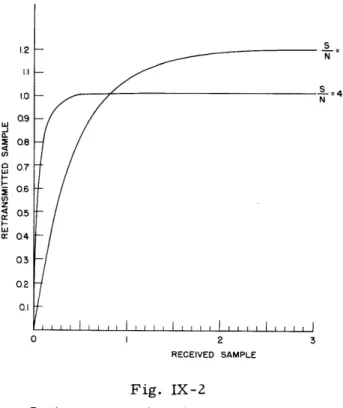
An optimum detector, on the contrary, extracts all the information contained in the received signal, that is, the conditional probabilities of the pulses that may have been transmitted. The amount of information received, measured in bits per sample, has been computed for various values of S/N (the amount of information transmitted is one bit per sample). A few typical results are given in the following table.
S
= 1 -=2S
S
S
= 3 5N
N
N
N
Optimum 0.51 0.73 0.84 0.95 Detector Maximum Likelihood 0. 37 0. 61 0. 75 0. 90 DetectorConsider two channels in cascade. If we assume that the intermediate station processes the signal sample by sample, we may ask the following question: What is the optimum transfer characteristic of the intermediate station? (By transfer characteris-tic we mean the characterischaracteris-tic relating the retransmitted sample amplitude to the
(IX. COMMUNICATION RESEARCH)
The methods of the calculus of variation lead to a very involved integral equation from which the following general result was obtained: For a continuous channel, per-turbed by gaussian noise, the optimum transfer characteristic is a straight line passing through the origin. The slope of the transfer characteristic is determined by the aver-age power available at the intermediate station.
For the discrete case, a method of solution by iteration was considered but was later abandoned in favor of an approximate formulation of the problem, namely, mini-mizing the probability of error. Under these conditions, the transfer characteristics are obtained by a reasonable amount of numerical calculation. The transfer character-istics for S/N = 1 and S/N = 4 are presented in Fig. IX-2.
C. A. Desoer, R. M. Fano
3. Pulse Code Magnetic Recorder
Effort has been concentrated on investigating the mechanical unit; in particular, the recording heads. During testing of the heads an auxiliary amplifier flat up to 0. 5 Mc/sec was used, and the recording current was observed by means of the voltage across a small series resistance in order to find what part of the poor high-frequency response is due to the heads and limited tape speed (30 inches per second).
Two kinds of recording heads have been tested. The Raytheon heads did not give a
-4I
=4
2 3
RECEIVED SAMPLE
Fig. IX-2
Optimum transfer characteristics.
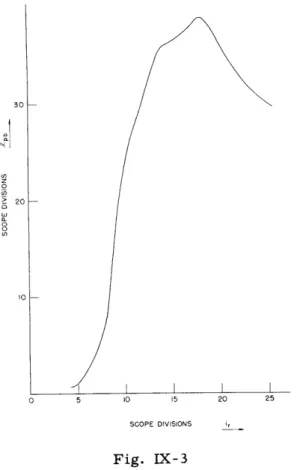
-68-0 40 38 32 z o (n 30 5o L 28 o o 26 24 22 20 18 16 SCOPE DIVISIONS i,
Fig. IX-3
Playback voltage (peak-to-peak) vs
recording current; sine wave,
f
=
25.5 kc/sec; Twin-Trax heads.
L sec e
Fig. IX-4
Playback voltage (peak-to-peak)
vs recording pulse length;
f
=
25 kc/sec; Twin-Trax heads.
kc
Fig. IX-5
Playback voltage vs frequency of pulses; Twin-Trax heads.
(IX. COMMUNICATION RESEARCH)
playback voltage high enough to be separated from noise, primarily due to the fact that the mechanical unit did not permit speeds higher than 30 inches per second. (At this speed, successive pulses begin to interfere at a repetition rate of approximately 5 kc/sec.)
The Twin-Trax heads (Amplifier Corporation of America) gave a signal well above the noise, but failed to give the proper number of zero crossings when a recording of pulses, spaced by random multiples of 40 4sec, was attempted.
Thus, at 30 inches per second, neither arrangement gave the correct pulses at play-back. Since time limitations did not permit the construction of a new multiple-head recording unit, a magnetic drum recorder was obtained and is being tested at present. Although Raytheon heads are again being used, the limitations mentioned above do not apply, in view of the high linear speed of the recording medium (approximately 180 inches per second).
In order to eliminate overlap, the recording must be suppressed except for one revo-lution of the drum. To avoid overlap during recording, a circuit consisting of a micro-switch, a one-shot multivibrator, and a gate was designed and constructed.
Some of the experimentally obtained curves are shown in Figs. IX-3 to IX-5.
J. B. Wiesner, L. Dolansky
-70-C. HUMAN COMMUNICATION SYSTEMS
Dr. L. S. Christie J. Macy, Jr. E. S. Palmer Dr. R. D. Luce L. N. Lindgren D. G. Senft
E. Karp
1. Communication and Learning in Task-Oriented Groups
Forthcoming Technical Report No. 231 has been completed and is scheduled for pub-lication.
L. S. Christie, R. D. Luce, J. Macy, Jr.
2. Experiment on the Effect of Change in Communication Networks
The procedural and apparatus details of this experiment have been previously described (1, 2). Experimental runs were carried out throughout the last quarter, except for short periods when subjects were unavailable. Forty-five different groups have been run. The remaining 15 should be completed during the first month of the next quarter.
The first laborious step of converting the raw data into a form suitable for punching I. B. M. cards has been carried out for the test network "diablo" for approximately one-half of the groups run.
L. S. Christie, R. D. Luce, J. Macy, Jr.
3. Results from Problem 1 on Whirlwind I
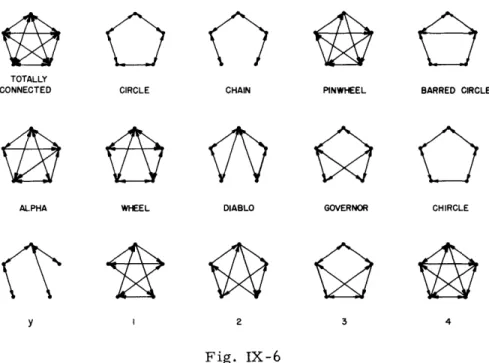
We have previously described a combinatorial problem which was coded for the Whirlwind I computer (1). It may be readily summarized. Let a network on n nodes be given, with one piece of information introduced to each node at time 0, and with no two nodes having the same information. Let time be quantized as ti. At each time ti , each node sends one and only one message which contains all the information it had just prior to t . We may speak of this as the ith act of a trial. The destination of this message is selected by throwing a k-sided die, where k is the number of outgoing links at that node. This process shall continue until each node has all the information intro-duced into the group, which occurs at, say, th; at this point the trial ends. We desired to know the distribution of h for various networks that were of experimental interest. Since this problem, except in certain very simple cases, is not known to have an analytic
solution, and since it was desired to have the results rather quickly, it was decided that statistical estimation from the computer Whirlwind I would be most efficient.
The networks shown in Fig. IX-6 were studied. For the first 7 cases, 3000 trials were run on each network with read-outs at 1000 trials and at 2000 trials. In the last
8 cases only 2000 trials were run, with an additional read-out at 1000 trials. These extra read-outs served as stability checks on the results and they suggest that the
Table 1
Estimated Distribution of Acts to Completion for Equiprobable Random Case
Network 1 2 3 4 5 6 7 8 9 10 >10 Totally Connected 0. 000 0. 000 0.041 0.396 0.326 0.158 0.054 0.018 0.005 0.000 0.001 Circle 0.000 0.000 0.002 0.171 0.376 0.265 0. 112 0.043 0.023 0.006 0.003 Chain 0. 000 0.000 0.000 0.000 0.076 0. 137 0. 195 0.181 0. 123 0.101 0. 177 Pinwheel 0.000 0.000 0.038 0.527 0.299 0.102 0.024 0.008 0.001 0.001 0.000 Barred Circle 0.000 0.000 0.008 0.209 0.312 0.235 0.111 0.069 0.029 0.021 0.007 Alpha 0.000 0.000 0.011 0.273 0.306 0.209 0.100 0.059 0.024 0.011 0.007 Wheel 0.000 0.000 0.026 0.312 0. 357 0.174 0.084 0.036 0.000 0.009 0.002 Diablo 0.000 0.000 0.000 0.064 0. 190 0. 237 0.203 0.148 0.078 0.038 0.044 Governor 0.000 0.000 0. 008 0.270 0. 327 0.220 0. 100 0.045 0.013 0.009 0.008 Chircle 0.000 0.000 0.000 0.058 0. 191 0.222 0. 178 0. 119 0.095 0.045 0.092 Y 0.000 0.000 0.000 0.027 0.079 0.163 0.168 0.135 0.108 0.098 0.230 1 0.000 0.000 0.021 0.370 0.389 0. 143 0.048 0.017 0.007 0.005 0.001 2 0.000 0.000 0.014 0.369 0.373 0. 156 0.065 0.015 0.008 0.000 0.001 3 0.000 0.000 0.011 0.307 0.398 0.205 0.081 0.030 0.014 0.008 0.002 4 0.000 0.000 0.036 0.378 0.374 0. 157 0.047 0.010 0.002 0.001 0.001
TOTALLY
CONNECTED CIRCLE CHAIN PINWHEEL BARRED CIRCLE
ALPHA WHEEL DIABLO GOVERNOR CHIRCLE
y I 2 3 4
Fig. IX-6
Networks examined on Whirlwind I, problem 1.
probable error is of the order of 1 percent. An additional check is available in that it has been possible to determine all possible minimum solutions for the circle (3 time units) and for the chain (5 time units). Thus, the exact value of the equiprobable ran-dom case may be readily computed. The exact value for the circle is 0. 244 percent and the estimated value is 0. 167 percent; for the chain, the exact value is 7. 05 percent and the estimated value is 7. 57 percent. A x2 test of goodness-of-fit gives 0. 20 < p < 0. 30 for the frequency split into minimum vs nonminimum cases for the chain, and 0. 30 < p < 0. 50 for the circle.
The estimated distributions to three decimal places are given in Table 1.
The purpose of this computation was to compare experimental results obtained in the action-quantized experiment, previously described (3, 4), with the equiprobable random case. We shall not present this comparison here, since it is given in context in Tech-nical Report No. 231. It will suffice to say that not only is the equiprobable random case a poor model for all except one of the networks run, but it does not correlate well with the observed experimental results. This strongly suggests that there is a definite inter-action between the combinatorial properties of the network and the conditional sending probabilities of the nodes. In the technical report it is shown that this is the case, and that a more adequate model may be constructed for some of the cases studied experi-mentally.
(IX. COMMUNICATION RESEARCH)
4. A Second Problem for Whirlwind I
Since the simplest probability model, which did not account for the experimental data, was not solvable analytically, it would be surprising if a more complex model could be solved for special cases without the aid of a computer. It develops, that an analytic sol-ution is possible in the case of minimum trials for the circle network, but that no other solutions have been obtained. Since the experimental data and the model accord with reasonable accuracy for this case, it was felt that it would be worthwhile trying to code this more complicated model for computer solution.
It is, as yet, appropriate to say "try," for the programming has barely begun, and it is not yet certain that there will be sufficient computer storage for the model. We may give a very brief outline of what assumptions have been made, and what, therefore, must be stored. We envisage exactly the same situation as described in section 3 above, except that the nodes will not make their decisions simply by a toss of the die. Rather, think of the program as consisting of an experiment in which there are 25 trials, where the ith trial is probabilistically a function of the i-lst in the following sense. Trial 1, act 1, will be determined in an equiprobable random fashion. Trial 1, act j, j > 1 will be determined in terms of the immediately preceeding act by conditional nodal probabili-ties which are a function of the inputs and outputs to the node under consideration. This continues until that trial is completed. Trial 2, act 1, will be a probabilistic function of act 1, trial 1, again determined in terms of conditional nodal probabilities; the par-ticular values of the probabilities are dependent on whether or not trial 1 was completed in minimum acts. Trial 2, act j, j > 1 will be determined by conditional nodal probabil-ities applying to the immediately preceding act of trial 2. One set of probabilities will obtain if trial 1 was completed in minimum and if trial 2, act 1, was the same as trial
1, act 1; and another will obtain if either one or both of these conditions is violated. The ith trial will depend on the i-lst in the same way as 2 on 1; however, the conditional nodal probabilities will be a function of i. Experimentally, it is found that this variation with i is small, compared with the differences explicitly included in the model, but that even so they are important analytically. It develops that there are a total of 16 condi-tional nodal probabilities for the circle; and if we hold them constant over blocks of 5 trials, the computer will have to store 80 conditional probabilities. In addition, it must store random numbers and a code that is appreciably more complex than that employed in the first problem (section 3 above). Since that code and the storage of random numbers consumed an appreciable amount of the Whirlwind storage, it is not immediately clear that the problem described will not exceed the computer capacity.
R. D. Luce with M. Rotenberg (Project Whirlwind)
-74-5. Some Abstract Properties of Networks
For definitions of a network, link, node, and connected network, see reference 2. A network N has degree k for integers;
k > 1, if N is connected; and the removal of k links, but no fewer, will disconnect N; k < 0, if N is not connected; and the addition of -k + 1 links, but no fewer, will connect N.
If N has m nodes, it is obvious that -(m-1) < k < m - 1. N is k-minimal for integers;
k > 1, if the removal of any link results in a network of degree k - 1; k = 1, if the removal of any link results in a disconnected network;
k = 0, if N is not connected and the addition of any possible link results in a connected network;
k < 1, if the addition of any possible link results in a network of degree k + 1.
It follows readily that any disconnected network is 1-minimal. To exclude these cases we shall call a connected 1-minimal network simply minimal. If k is greater than one or less than one, then a k-minimal network is of degree k.
In Fig. IX-6, totally connected is 4-minimal; wheel and No. 4 are 3-minimal; circle, pinwheel, diablo, governor, No. 1, No. 2, and No. 3 are 2-minimal; and chain and Y
are minimal.
We shall state without proof several theorems concerning these classes of networks. First, we shall completely characterize the class of k-minimal networks, k < 0. To do this we need the following terms. If S is a maximal connected subnetwork of N and a, bES imply (ab) E N, then S is called a pseudo-node of N. In particular, any isolated node of N is a pseudo-node. Evidently, pseudo-nodes are nodewise disjoint. If U and V are two disjoint subsets of nodes of a network N and u EU and v EV imply (uv) EN, then we say that a cable exists from U to V.
Theorem: A network N is k-minimal, k,< 0, if, and only if, (a) N is a graph composed of -k + 1 pseudo-nodes having no links among them, or (b) N is not a graph and is com-posed of a set U of -k + 1 pseudo-nodes having no links among them, and a pseudo-node V such that there exists a cable from the nodes of U to those of V or one from V to U, but not both.
The second main result will serve to decompose any connected network into 1-minimal subnetworks and, in particular, will serve to decompose any k-1-minimal, k > 1, network. A subnetwork S of N is complete if it is defined on the same set of nodes as N. N will be called the sum of subnetworks N., i = 1, 2, . t, and written
t
N N.
(IX. COMMUNICATION RESEARCH)
if each link of N is contained in exactly one of the N..
1
Theorem: To every connected network N there exists a unique positive number k, its degree, and at least one set of k + 1 complete 1-minimal subnetworks N., and a
num-1
bering such that: k+ a. N = Ni;
i=l
b. N k+1 is disconnected; c. N1 is minimal;j
d. Ni is j-minimal, 2 < j < k;i=l
1
e. the connected subnetworks of the N., 1 1 i < k, are minimal.
It is easily shown by example that this decomposition is not unique. It is not stated, but from the proof it can be seen that if N is k-minimal, then N k+l has no links; thus,
N is a sum of k 1-minimal subnetworks in which the connected subpieces are, in fact, minimal. This suggests that the next stage of analysis is the study of minimal networks.
We shall call a network reducible if it consists of two disjoint connected subnetworks A and B with a single link from A to B and a single link from B to A; otherwise, it is irreducible. We shall also define a compound circuit of order s. A simple (oriented) circuit is a compound circuit of order 1. Assume the definition up through order s - 1.
Then a compound circuit of order s consists of one of order s - 1 in which a single node has been replaced by a circuit C. Any link to or from the node becomes a single link to or from a node of C. A graph (see any standard text on topology) without circuits (in the usual topological sense) is called a tree. A tree is a minimal network.
Theorem: To any minimal network, which is not a tree, there exist integers t > 1, and y 0, such that N consists of t disjoint irreducible compound circuits C
i, i = 1,
2 .. t, and y nodes Ci+t , i = 1, 2 ... y, not included in the Ci, 1 i < t, subject
to the conditions:
a. there exists, at most, one link from any Ci to any C , i
j,
1,<i,j
<t + y; b. no arc (pair of links (ab) and (ba)) is contained in any of the Ci, 1 is t;c. the network formed by treating the Ci., 1 i < t, as nodes, all other nodes and links remaining unchanged, is a tree, or, if t = 1 and y = 0, a single node.
We shall relate this result to one given in reference 4. The rank of a network r was defined, and it was stated that it can be shown that p + r >, 2m for a connected network where m is the number of nodes and p the number of links. We shall say a connected network with p + r = 2m is rank minimal.
Theorem: A rank minimal network is minimal, and in the above decomposition t = 1,
-76-so the tree that arises is a star (all arcs emanating from a single node).
Further results will be presented in a forthcoming paper (5).
R. D. Luce
References
1.
Quarterly Progress Report, Research Laboratory of Electronics, M. I. T. Jan. 15,
1952, pp. 57-58
2.
Quarterly Progress Report, Research Laboratory of Electronics, M. I. T. April 15,
1952, pp. 56-58
3. Quarterly Progress Report, Research Laboratory of Electronics, M. I. T. Jan. 15,
1951, pp. 78-81
4.
Quarterly Progress Report, Research Laboratory of Electronics, M. I. T. April 15,
1951, pp. 78-81
5.
R. D. Luce: Two Decomposition Theorems for a Class of Finite Oriented Graphs,
Am. J. Math. (in press)
(IX. COMMUNICATION RESEARCH)
D. REPLACEMENT OF VISUAL SENSE IN TASK OF OBSTACLE AVOIDANCE
Dr. C. M. Witcher E. Ruiz de Luzuriaga L. Washington, Jr.
Work has been chiefly concentrated on the development of the step-down detector, and some rather satisfying results have been obtained.
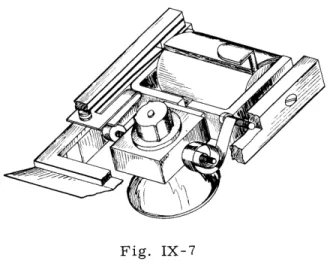
As this quarter began, a first model of the detector was very nearly completed. The first tests made with this model indicated that it was quite unsatisfactory because of the intolerably low signal-to-noise ratio which it yielded. The difficulty was found to lie in the fact that the collimator for the transmission of light from the source to the rotating mirror was extremely inefficient. Theoretical considerations strongly substantiated this result, and it was consequently concluded that no scheme making use of a collimator to limit the beam would be at all desirable. Accordingly, the flashlight bulb and reflec-tor were incorporated into an electromagnetic vibrareflec-tor unit so located that the light beam could pass directly out of the instrument box at its lower front corner and was thus made to sweep back and forth through the required scanning angle by the vibration of the reflector. In constructing this vibratory source unit, the reflector was pivoted about an axis perpendicular to its axis of symmetry and so located as to yield approximately a minimum moment of inertia. The system was made resonant with a Q of approxi-mately 90 by means of a stiff coil spring; the resonant frequency was 15 cps. (Approx-imately two seconds are required for the amplitude of the free oscillation to decrease to 1/e times its initial value.) Torque impulses were furnished to the reflector elec-tromagnetically through a small piece of iron rigidly attached to it, and vibration was maintained by means of a set of make-and-break contacts. The final form of this assembly is shown in Fig. IX-7. It produces a vibration amplitude of 100 to 120 with a power consumption of 80 milliwatts (40 ma at 2 volts). It is now felt that this same form of scanning arrangement may be ideally suited for the lateral scanning required for obstacle detection.
While this source unit was in course of development, some further theoretical work was carried out with reference to the type of signals to be expected from the device. It appeared that two possible sets of operating conditions were of interest. Either (a) the transmitted beam of light could be made to scan in a vertical plane, as outlined in the Quarterly Progress Report, April 15, 1952, or (b) the transmitted beam could be held stationary while the horizontal slit in front of the photocell was made to oscillate verti-cally. For the first case, in which the receiving optical system actually "looked at" a small area on the ground at a fixed distance in front of the device, the occurrence of a step-down would result in a complete cessation of the signal during the period when the small region seen by the receiving system was completely in the shadow of the
-78-Fig. IX-8
Step-down indicator.
(IX. COMMUNICATION RESEARCH)
step-down. For the second case (fixed transmitted beam and moving receiver slit), the signal would have the form discussed in the Quarterly Progress Report cited above. Since case (a) led to the complete vanishing of the signal as the criterion for indication of a step-down, it appeared far more desirable than the alternative result, and thus the
effort required to develop the vibratory light-source unit seemed well justified.
When the vibratory source was developed, it was temporarily attached to the lower front edge of the model described in the last report, and tests were immediately begun. The results were fully in agreement with theory both qualitatively and quantitatively. Using a receiver slit width of 0. 040 inch and a distance of 5 inches between the center of
source and the center of the receiving lens, and viewing the ground at a point 6 feet in front of the device with the bottom of the device 20 inches above the ground, step-downs of 2 inches or more in height produced a complete disappearance of the received signal. In a short series of field tests carried out in various parts of the grounds of the Insti-tute, about 95 percent of all step-downs of 2 inches or more in height were detected. These tests were objective in the sense that no visual cues to the presence of step-downs existed, since the detections were made by Witcher, who is himself blind. However, it is possible that other forms of cues may have been unintentionally furnished by his guide in a few cases. The signals from the device, incidentally, were detected in these tests by listening to them through a pair of head phones. The 15-cycle vibration rate of the source gave a signal repetition rate of 30 pps.
During the past few weeks a new model of the step-down detector has been under con-struction, details of which may be seen in the accompanying drawing, Fig. IX-8. This model is contained in an aluminum box, 6 by 8 by 3 inches in size. The light bulb and reflector (a) pivoted in the source vibrator assembly (b) can be observed in the lower front corner of the box. A section has been removed from the front wall and the bottom of the box in this corner to permit egress of the light beam. Reflected light enters the receiving lens (c) and is focused on the receiving slit of the photocell (d). The signal then passes to the amplifier (e) which is located in the compartment at the upper rear of the box. The lower center section of the box (f) contains a 2-volt storage cell to furnish power for the light and the source vibrator; a 60-volt "B" battery for the ampli-fier; and a small transformer, rectifier, and filter assembly to provide about 100 addi-tional volts to be applied to the photocell. The lower rear compartment (g) will later be used to house the electronic components of the alarm system, which will be designed to operate so as to turn on a buzzer or other vibratory alarm device momentarily when the received signal vanishes for a predetermined interval of time. The alarm vibrator and associated relays will be located in the space directly beneath the receiving lens.
The receiver slit width, 0. 040 inch, and the spacing between centers of source and receiving lens, 5 inches, will be the same as in the previous model. Note that the source holder is tilted forward so that, when the box is held vertically, the light beam
-80-Fig. IX-9
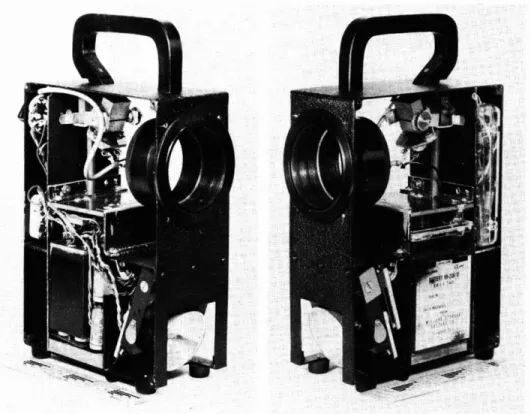
Step-down indicator showing components mounted in the completed unit.
is inclined about 200
below the horizontal at the center of its motion. The photocell is raised above the center of the receiving lens so that the receiving system sees the point on the ground which is approximately at the position where the transmitted beam strikes the ground when the source is at rest and the device is held normally. This point is designed to be approximately 6 feet in front of the device when the bottom of the box is about 20 inches above the ground. Figure IX-9 shows the step-down indicator compo-nents mounted in the completed unit.
(IX. COMMUNICATION RESEARCH)
E. COMMUNICATIONS BIOPHYSICS
Prof. W. A. Rosenblith K. Putter
1. Interaction of Cortical Activity and Evoked Potentials
Research on this topic has been suspended until the new laboratory facilities, now under construction, become available.
W. A. Rosenblith with Dr. M. A. B. Brazier (Massachusetts General Hospital)
2. Variability of Cortical Responses to Acoustic Clicks
Research on this topic continues over a widened range of stimulus rates (from 1 click every 10 sec to 14 clicks per sec). The autocorrelational analysis of the data continues, and the findings are being compared with whatever behavioral data are available for sim-ilar stimulus conditions.
W. A. Rosenblith with K. Safford (Harvard Psycho-Acoustic Laboratory)
3. Instrumentation
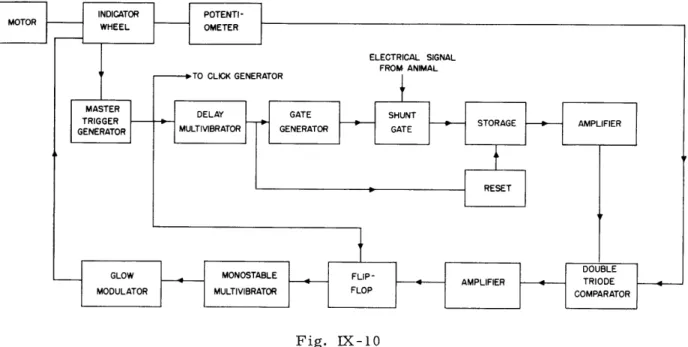
The breadboard version of the time-gated amplitude quantizer (Fig. IX-10) has been completed and is being tested for linearity and stability prior to construction of a unit to be used in electrophysiological research.
Fig. IX-10
Block diagram of time-gated amplitude quantizer.
-82-The unit is mechano-electronic and consists of a motor that drives an indicator wheel and a linear potentiometer on a common shaft, a negative power supply, a positive power supply, and sixteen vacuum tubes and associated circuitry.
Briefly, the sequence of operation, as applied to electrophysiological measurements, is as follows. A master trigger is generated once every revolution of the motor and is used to trigger the click generator which supplies the stimulus to the animal. The same trigger, delayed by an adjustable time interval, triggers a gate generator and shunt-gate arrangement. These circuits select the portion of the animal's response to be analyzed. This portion is then stored and compared to the reference sawtooth voltage from the lin-ear potentiometer in a double-triode comparator. The pulse that marks the equality of the two signals is sharpened and used to trigger a monostable multivibrator through a flip-flop used primarily for isolation. The multivibrator, in turn, triggers a glow-modulator which illuminates the number on the indicator wheel corresponding to the level of the input pulse. The next master trigger resets the storage and the flip-flop circuits, and initiates the next cycle.
Essentially, then, the method used is one of time-modulation, with the amplitude of the reference voltage a linear function of time, and the indicator wheel running in syn-chronism with this reference voltage. The synchronization is accomplished by simple calibration adjustments.
The present specifications call for quantization into 20 levels of electric signals that last from 0.5 msec to 5 msec, and that lag the master trigger by from 1 msec to 10 msec. The required pulse amplitude at the input of the unit is of the order of magnitude of two volts for the minimum level. These specifications do not represent the upper limit of accuracy imposed by linearity and stability; it is quite likely that the number of levels can be doubled, if desired; and that pulses of greater duration and greater delay can be handled. Furthermore, although at the present time the output of the unit is recorded on film, it may be adapted to work in conjunction with equipment that is able to perform an
elementary statistical analysis. K. Putter
4. Latency of Neural Components in Round Window Response to Pure Tones (This material is the abstract of a paper presented to the New York meeting of the American Physiological Society on April 18, 1952.)
When low-frequency tones are presented to the ear of anesthetized cats, neural and microphonic components can be identified in the response recorded by wire electrodes from the round window of the cochlea. The action potentials ("neurals") behave like those recorded in response to acoustic clicks: they are sensitive to prolonged stimula-tion (exhibiting both equilibrastimula-tion and fatigue) and to temperature change. The position of these neurals in the cycle of microphonic potentials varies in a consistent manner with stimulus frequency and intensity. The following straight-line equation describes
(IX. COMMUNICATION RESEARCH)
the position of the neural in a given cycle (data from 7 animals): T = aT + T0. T is the
period of the stimulus tone, and T is the time interval separating the peak of the neural from the 0' crossing of the time axis in a sinusoid;
70
is the intercept of the straight line with the T-axis (its value increases with decreasing stimulus intensity); a is the slope constant of the straight line (its value is approximately 1/2 and apparently inde-pendent of stimulus intensity). This equation can be interpreted as follows: for equal-intensity tones of frequency less than 600 cps, the latency of the neurals is constant when measured from the 1800 crossing of the time axis of the sinusoid. (Research carried out at the Psycho-Acoustic Laboratory under contract N5ori-76 between Harvard Univ. and the Office of Naval Research, U. S. Navy.)W. A. Rosenblith with Mark R. Rosenzweig (Univ. of California, Berkeley)
-84-F. NEUROPHYSIOLOGY*
W. H. Pitts J. Y. Lettvin B. Howland
During the past quarter we have been looking into the properties of microelectrodes, not only the ones that we have used, but others that appear to be better. In addition, we have been struck with the importance of low grid current on the input stage cathode
- 6 2 -9
follower. Using tips of 106 cm , even 10 amp polarizes the electrode to increase the resistance and therewith the noise level; and still worse, the concentration polarization about the tips makes the probes quite sensitive to microphonics, a particularly serious disadvantage due to the location of our laboratory. By selecting tubes for grid currents
-11
no greater than 10 amp and replacing Tophet C by platinized platinum, which has a smaller anodic overvoltage in body fluids, we hope to be able to map the cord with more refined stimulation and smaller signals. Fortunately, the faults of our former system, although inconvenient, have not vitiated our past measurements or the maps computed from them; the reason is that we have considered only those cases where the signal is very much larger than the noise and have only examined relatively rapid transients.
The problem of intracellular recording has been waiting on the development of suit-able electrodes not more than 1l in diameter. We are reluctant to use the usual elec-trolyte-filled capillaries, since their input impedance lies between 30 and 100 megohms, and we have finally devised a metal tip that may serve. An indium alloy, melting at approximately 180°F is injected into a preformed capillary; the tip is flashed with gold and then platinized. Some of the questions we mean to examine demand dc measure-ments, and difficulties arise with both the electrolyte-filled and metal-filled capillaries. In the former case, grid current produces unknown liquid junction potentials; in the latter, various complicated kinds of polarization; in both instances, it increases the time constant of the amplifier and the noise level. Another artifact occurs when the electrode tip passes through regions of varying resistance. With a constant grid current of any size the electrode potential must vary accordingly; and with very small tips, the errors produced can be serious. We can preclude this by measuring the resistance constantly, not by unwisely passing current through the electrode, but by measuring the noise energy continuously, thus avoiding all interference with the input stage.
The problem of finding a suitable electrode (of whatever size) to record both "dc" potentials and rapid transients, and then interpreting the records taken with it, is both
This section has been supported in part by the Bell Telephone Laboratories, Incor-porated.
(IX. COMMUNICATION RESEARCH)
practically exasperating and theoretically discomposing. It is difficult to place any firm upper bounds on liquid junction potentials or their rate of change, when one uses saline bridges. With metal probes, thermodynamics constrains one to "reversible" electrodes for deriving interpretable "dc" potentials; but very few of the ordinary reversible elec-trodes can be made 10p or less in diameter and inserted into tissue. We are told that even Ag-AgCl ceases to be reversible (at least to Cl ) inside cells, apparently on account of amino-acids, whose silver salts are less soluble than AgC1; such an electrode drifts badly, and records from it are not interpretable. Furthermore, the "reversi-bility" of these electrodes is only to "infinitely slow" changes; they can be very slow to follow variations in an impressed field. The transient response of electrodes is a subject little explored by experimental electrochemistry; the few and murky theories which fit any observed response with a superposition of ionic double-layers in a way formally equivalent to approximating an arbitrary (realizable) impedance by a lattice network, but undertaken with a more naive conviction of realism, are hardly good enough to free people from the necessity of detailed measurement of the conduct of their electrodes under the influence of whatever factors are likely to vary in their experi-ments. Nor are matters helped when the exigencies of the problem, or fashion, con-tinually reduce the size of the electrode's recording tip and augment its impedance.
We have begun to attempt resynthesizing the "components" of the dorsal root poten-tial from the sources and sinks that we have mapped in the cord. We have also begun construction of a 12-channel pilot machine for mapping sources and sinks in the cortex directly during spontaneous activity.
-86-G. SEMANTIC INFORMATION AND ITS MEASURES
In the Quarterly Progress Report, April 15, 1952, the concept of semantic informa-tion was explicated and various measures given for it. The present report deals with estimates of the amount of information and derived concepts. It now turns out to be more convenient to have events as arguments of these measure functions and not the statements designating them.
When an experiment is performed the result of which can be just one of the n events h . . ., hn , the class of such events will be called, for brevity, an exhaustive system.
Then we can compute the amounts of information which each outcome would convey. However, so long as the outcome is unknown, we have to be satisfied with a good esti-mate.
Following a general method used in similar situations, we define the (c-mean) esti-mate of the amount of information conveyed by (the members of the exhaustive system) H on (the evidence) e, in symbols: est (in, H, e), as follows:
n
est(in, H, e) = c(hp, e) x in(hp/e). p=l
For the special function inf, we get
n
est(inf, H, e) = - c(h p e) X Log c(hp, e) p=l
a theorem of which the statistical correlate is well known.
If H = fhl . . hn} and K= kl, . . ., km are exhaustive systems, then H. K, defined as h1.k . .. hi. km, h2 ki .. h is exhaustive, too; hence
m n
est(in, H.K, e) = c(h. k , e) x in(h . k
/e).
q=1 p=lWe have, of course,
est(in, H. K., e) < est(in, H, e) + est(in, K, e)
with equality holding if, and only if, the h's and the k's are mutually inductively irrel-evant with respect to that m-function on which in is based.
If the event k has occurred, the posterior estimate of the amount of information conveyed by H on e and k, will, in general, be different from the prior estimate of the amount of information conveyed by H on e alone. This difference is often of spec-ial importance and will therefore receive a specspec-ial name, the amount of specification
(IX. COMMUNICATION RESEARCH)
of H through k on e, and will be denoted by sp(H, k, e). The formal definition is sp(H, k, e) = est(inf, H, e) - est(in, H, e. k).
It is easy to see that sp(H, k, e) = 0 if (but not only if) k is irrelevant to the h's on e. sp may have positive and negative values with its maximum obviously equal to the prior estimate itself. This value will be obtained when e. k L-implies some h . In this case,
P H is completely specified through k (on e).
Situations often arise in which the event k has not yet occurred or, at least, in which it is not known whether it or some other event belonging to a certain exhaustive class of events will occur or has occurred. In such circumstances, it makes sense to ask for some average of the posterior estimate of information conveyed by H on e and (some member of) K (the exhaustive system of the k's). We are led to the (c-mean) estimate of this posterior estimate denoted by est(in, H/K, e) and defined by
m
est(in, H/K, e) = c(k , e) x est(in, H, e. k q). q=
The estimate of the amount of specification of H through K on e is, of course, equal to the difference between the prior estimate of the amount of information conveyed by H on e and the estimate of the posterior estimate of the amount of information conveyed by H on e and K; in symbols
est(sp, H, K, e) = est(in, H, e) - est(in, H/K, e).
In this connection, let us mention only three theorems the statistical correlates of which are well known:
est(in, H/K, e) = est(in, H. K, e) - est(in, K, e)
est(sp, H, K, e) = est(sp, K, H, e) est(sp, H, K, e) > 0.
To give a simple illustration: Let us assume that on the basis of available evidence and with respect to a certain m-function, the c-value of the event, h1, "The maximum temperature in Boston on the 16th of June 1952 is in the eighties or above" is 1/2; the c-value of h2, "The maximum ... is in the seventies," is 1/4; and the c-value of h3,
"The maximum ... is in the sixties or below" is 1/4. Then
est(inf, H, e) = - c(h, e) x Log c(hp, e) = x1 + X2 + X 2 = 1.5.
p
Now let K Now le = k1 , k2, k3} be the exhaustive system of the readings of a barometer
-88-situated in Boston on June 15th, 1952, and let c(k
l,
e.
h l)=
1/4,
c(k
l,e.h
2) = c(kl,e. h
3)
1/2.
The following diagram will visualize the situation.
1 h
1
-h
2S3
2
-1
1
h ---- -. 4 - 7 1 11
--
h?
-
- -
k
1 2 2 4 h---
---
2
- kThen
est(inf, H/K, e) = c(k, e) x est(inf, H, e. k) = Log 3 + Log 3 = 1. 189
q
and
est(sp, H, K, e) = 1.5 - 1.189 = 0. 311.
It
seems that many concepts used in
connection with the
treatment of systems for
transmission of information can be adequately specified on the basis of the concepts
developed above.
The following two examples will illustrate the situation.
By the efficiency of (the conceptual framework of ) the language L1, with
respect to
the amount-of-information function, in, and (the evidence) e, in symbols: ef(L
1, in, e),we understand the ratio of est(in, H
1, e), where
H1
is the class of the full sentences of
all Q-predicators (see [Prob.]
§
31) with an argument not mentioned in e, to max [est
(in, H., e)], where the
H
iare the corresponding classes (equinumerous with H
1) in other
languages L
icovering, intuitively speaking, the same ground.
The choice of the class
of Q-sentences as the class relative to which the efficiency of a language is defined is
not the only possible one but seems quite natural. The efficiency of a language, as
defined here, changes with a change of the evidence taken into account.
A language may
(IX. COMMUNICATION RESEARCH)
become, in a sense, more or less efficient with a change in experience. We also need, therefore, a concept of efficiency which is independent of experience. Such a concept is readily available. We have only to consider the efficiency with respect to the tautologi-cal evidence, that is, ef(L1, in, t). Let us call this concept the initial efficiency. A lan-guage will, accordingly, have maximum initial efficiency if, and only if, each of the mentioned Q-sentences is initially equiprobable. This condition is fulfilled, for instance, with respect to all in-functions based upon mD and m .
The inefficiency of a language is easily defined by inef(L1, in, e) = 1 - ef(L1, in, e).
The second concept is that of transformation through noise or distortion of an exhaustive system. Whenever we are interested in knowing whether or not a certain event from an exhaustive system has occurred (or is going to occur) but are unable, for some reason, to observe the occurrence of these events directly and have to content our-selves with the observation of some event out of another exhaustive system, K1, where
not all of the c-values of the k's on e and the h's are equal to either 1 or 0, we can regard K as a distortion of H. Following this terminology, we might say, for instance, th-at the system of thermometer readings at a certain time is a distortion of temperature situations at that time (for somebody who is interested in the temperatures), that the system of weather predictions of a certain weather bureau is a distortion of the system of weather situations at the time for which the prediction is made, and that the system of symbol printings at the output of a teletypewriter is a distortion of the system of symbol printings at the input.
Finally, let it be remarked that the prevailing statistical theory of information can be mapped without remainder into the semantical theory. This is so, because to the expression "the information carried by the symbol A" the expression "the information conveyed by the (event of) the transmission of the symbol A" can be correlated in a bi-unique fashion. Prevailing information theory deals only with the information conveyed by events of a very special, and also a very important, type, namely, with events con-nected with transmission of messages. It does not deal with the information conveyed by the events described in these messages. The theory outlined here deals with the information conveyed by events of every possible kind. It would be premature to survey all possible fields of application.
Y. Bar-Hillel
-90-H. TRANSIENT PROBLEMS
Prof. E. A. Guillemin F. Ba Hli E. F. Bolinder
Dr. M. V. Cerrillo Dr. F. M. Reza
1. Basic Existence Theorems (continued from Quarterly Progress Reports, Jan. 15, 1952 and April 15, 1952)
Due to its excessive length, Part III of this discussion will not be presented in a Quarterly Progress Report. It will be published as Technical Report No. 233, "Theo-retical Considerations on Rational Fraction Expansions for Network Functions. "
M. V. Cerrillo
2. Study of Convergence Phenomena Associated with the Propagation of Impulses Through Finite Networks
In the theory of network synthesis the problem of transmission of impulses through a finite network occupies an important formal position. Curious and harmful phenomena of convergence appear in this solution, and the present study is aimed toward
under-standing and controlling these undesirable effects. Promising results have been obtained thus far; we shall report some of the methods of attack and solution in the next Quarterly Progress Report.